You are not logged in.
This means you
CAN ONLY VIEW reports that were published prior to Tuesday, February 11, 2025.
You
MUST UPGRADE YOUR MEMBERSHIP if you want to see any current reports.
AFTER MARKET UPDATE - FRIDAY, FEBRUARY 16TH, 2024
Previous After Market Report Next After Market Report >>>
|
|
|
|
DOW |
-145.13 |
38,627.99 |
-0.37% |
|
Volume |
979,972,802 |
+0% |
|
Volume |
5,250,120,100 |
-15% |
|
NASDAQ |
-130.52 |
15,775.65 |
-0.82% |
|
Advancers |
905 |
33% |
|
Advancers |
1,609 |
38% |
|
S&P 500 |
-24.16 |
5,005.57 |
-0.48% |
|
Decliners |
1,852 |
67% |
|
Decliners |
2,678 |
62% |
|
Russell 2000 |
-28.73 |
2,032.74 |
-1.39% |
|
52 Wk Highs |
186 |
|
|
52 Wk Highs |
229 |
|
|
S&P 600 |
-15.16 |
1,304.98 |
-1.15% |
|
52 Wk Lows |
19 |
|
|
52 Wk Lows |
62 |
|
|
 |
Major Indices Ended Slightly Lower
Kenneth J. Gruneisen - Passed the CAN SLIM® Master's Exam
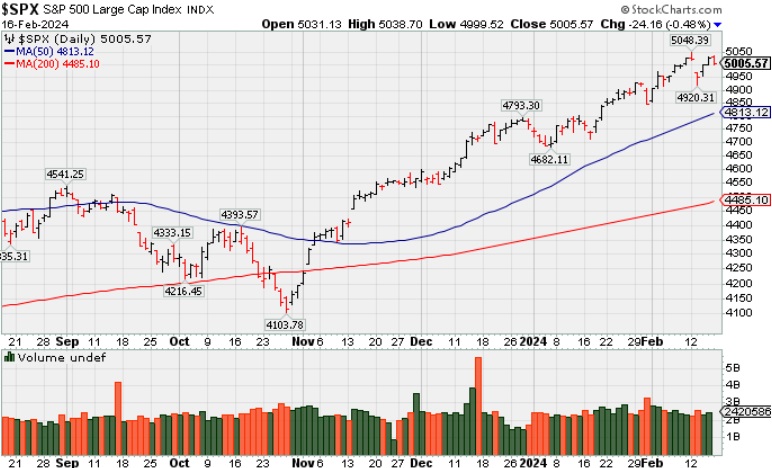
The major indices ended unanimously lower on Friday. Volume was reported near the prior session total on the NYSE and lighter on the Nasdaq exchange. Decliners led advancer by a 2-1 margin on the NYSE and by a 5-3 margin on the Nasdaq exchange. There were 96 high-ranked companies from the Leaders List that hit new 52-week highs and were listed on the BreakOuts Page, versus the total of 117 on the prior session. New 52-week highs totals solidly outnumbered new 52-week lows totals on the NYSE and on the Nasdaq exchange. The major indices are in a confirmed uptrend (M criteria). New buying efforts should be only made in stocks fitting all key criteria of the fact-based investment system.
PICTURED: The S&P 500 Index pulled back after 2 consecutive gains.
Only three of the 11 S&P 500 sectors closed higher including materials (+0.5%), health care (+0.3%), and consumer staples (+0.2%). The communication services sector (-1.6%) logged the largest decline.
The 2-yr note yield settled nine basis points higher at 4.65%. The 10-yr note yield rose six basis points to 4.30%. There was little reaction to another hot inflation reading in the form of January PPI. Bond and equity markets are closed on Monday for Presidents Day. |
 Kenneth J. Gruneisen started out as a licensed stockbroker in August 1987, a couple of months prior to the historic stock market crash that took the Dow Jones Industrial Average down -22.6% in a single day. He has published daily fact-based fundamental and technical analysis on high-ranked stocks online for two decades. Through FACTBASEDINVESTING.COM, Kenneth provides educational articles, news, market commentary, and other information regarding proven investment systems that work in good times and bad.
Comments contained in the body of this report are technical opinions only and are not necessarily those of Gruneisen Growth Corp. The material herein has been obtained from sources believed to be reliable and accurate, however, its accuracy and completeness cannot be guaranteed. Our firm, employees, and customers may effect transactions, including transactions contrary to any recommendation herein, or have positions in the securities mentioned herein or options with respect thereto. Any recommendation contained in this report may not be suitable for all investors and it is not to be deemed an offer or solicitation on our part with respect to the purchase or sale of any securities. |
|
 |
Tech Sector Had a Slightly Negative Bias
Kenneth J. Gruneisen - Passed the CAN SLIM® Master's Exam
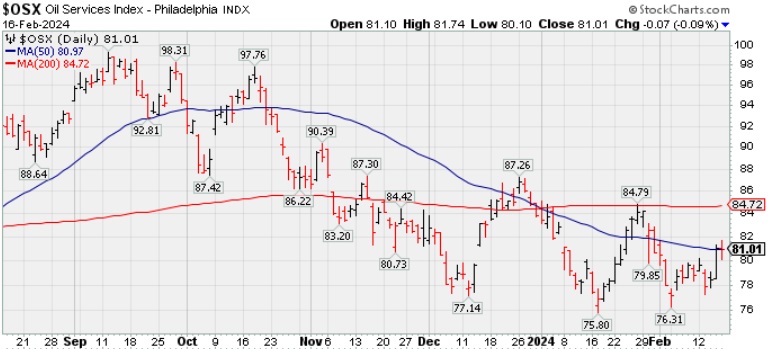
The Broker/Dealer Index ($XBD +0.19%) inched higher while the Bank Index ($BKX -0.30%) edged lower and the Retail Index ($RLX -0.09%) finished flat on Friday. Commodity-linked groups were indecisive as the Gold & Silver Index ($XAU +0.34%) eked out small gain as the Oil Services Index ($OSX -0.09%) and Integrated Oil Index ($XOI -0.29%) both ended slightly lower. The tech sector had a slightly negative bias as the Networking Index ($NWX -0.98%), Biotech Index ($BTK -0.42%), and the Semiconductor Index ($SOX -0.67%) unanimously ended in the red.
![]() PICTURED: The Oil Services Index ($OSX -0.09%) met resistance at its 50-day moving average (DMD) line when rebounding from the recent low.
| Oil Services |
$OSX |
81.01 |
-0.07 |
-0.09% |
-3.43% |
| Integrated Oil |
$XOI |
1,928.68 |
-5.55 |
-0.29% |
+3.56% |
| Semiconductor |
$SOX |
4,527.68 |
-30.42 |
-0.67% |
+8.44% |
| Networking |
$NWX |
833.36 |
-8.28 |
-0.98% |
+0.07% |
| Broker/Dealer |
$XBD |
562.59 |
+1.08 |
+0.19% |
+0.95% |
| Retail |
$RLX |
4,224.71 |
-3.82 |
-0.09% |
+8.64% |
| Gold & Silver |
$XAU |
107.86 |
+0.36 |
+0.34% |
-14.19% |
| Bank |
$BKX |
95.44 |
-0.29 |
-0.30% |
-0.61% |
| Biotech |
$BTK |
5,124.87 |
-21.58 |
-0.42% |
-5.42% |
|
|
|
 |
Featured Stocks
Kenneth J. Gruneisen - Passed the CAN SLIM® Master's Exam
|
|
|
Color Codes Explained :
Y - Better candidates highlighted by our
staff of experts.
G - Previously featured
in past reports as yellow but may no longer be buyable under the
guidelines.
***Last / Change / Volume data in this table is the closing quote data***
Symbol/Exchange
Company Name
Industry Group |
PRICE |
CHANGE
(%Change) |
Day High |
Volume
(% DAV)
(% 50 day avg vol) |
52 Wk Hi
% From Hi |
Featured
Date |
Price
Featured |
Pivot Featured |
|
Max Buy |
 ANET
-
NYSE
ANET
-
NYSE
Arista Networks
Computer-Networking
|
$261.75
|
-4.75
-1.78% |
$268.39
|
2,347,450
111.84% of 50 DAV
50 DAV is 2,099,000
|
$292.66
-10.56%
|
10/31/2023
|
$188.84
|
PP = $198.80
|
|
MB = $208.74
|
Most Recent Note - 2/13/2024 2:39:29 PM
G - Gapped down today following a "negative reversal" at its all-time high after getting very extended from any sound base. Its 50 DMA line ($246.80) defines important near-term support to watch on pullbacks.
>>> FEATURED STOCK ARTICLE : Pulled Back From All Time High With Gap Down on Prior Session - 2/1/2024 |
View all notes |
Set NEW NOTE alert |
Company Profile |
SEC
News |
Chart |
Request a new note
C
A
S
I |
NVO
-
NYSE
Novo Nordisk ADR
Medical-Ethical Drugs
|
$124.01
|
+2.26
1.86% |
$124.64
|
6,584,095
146.77% of 50 DAV
50 DAV is 4,486,000
|
$123.34
0.54%
|
11/2/2023
|
$100.97
|
PP = $104.10
|
|
MB = $109.31
|
 Most Recent Note - 2/16/2024 1:04:42 PM
G - extended from any sound base and hitting yet another new all-time high with today's gain. Its 50 DMA line ($107.53) defines important near-term support to watch on pullbacks.
>>> FEATURED STOCK ARTICLE : Extended From Any Sound Base After Volume-Driven Gains - 2/8/2024 |
View all notes |
Set NEW NOTE alert |
Company Profile |
SEC
News |
Chart |
Request a new note
C
A
S
I |
AXON
-
NASDAQ
Axon Enterprise
Security/Sfty
|
$269.82
|
-2.97
-1.09% |
$273.91
|
249,319
67.20% of 50 DAV
50 DAV is 371,000
|
$274.78
-1.81%
|
11/8/2023
|
$127.84
|
PP = $223.30
|
|
MB = $234.47
|
Most Recent Note - 2/12/2024 6:55:57 PM
G - After hitting a new all-time high today there was a "negative reversal" following 7 consecutive gains. Prior highs in the $260-262 area define initial support to watch above its 50-day moving average (DMA) line ($248.72). See the latest FSU analysis for more details and new annotated graph.
>>> FEATURED STOCK ARTICLE : Reversal at All-Time High After 7 Consecutive Gains - 2/12/2024 |
View all notes |
Set NEW NOTE alert |
Company Profile |
SEC
News |
Chart |
Request a new note
C
A
S
I |
TDG
-
NYSE
TransDigm Group
Aerospace/Defense
|
$1,146.39
|
-11.40
-0.98% |
$1,165.00
|
194,540
92.64% of 50 DAV
50 DAV is 210,000
|
$1,159.39
-1.12%
|
12/12/2023
|
$1,000.39
|
PP = $1,013.18
|
|
MB = $1,063.84
|
Most Recent Note - 2/14/2024 8:17:51 PM
G - Managed a best-ever close today perched near its all-time high. Its 50 DMA line ($1,038) defines near-term support to watch above prior highs in the $1,013-1,015 area. See the latest FSU analysis for more details and a new annotated graph.
>>> FEATURED STOCK ARTICLE : Transdigm Perched Near All-Time High - 2/14/2024 |
View all notes |
Set NEW NOTE alert |
Company Profile |
SEC
News |
Chart |
Request a new note
C
A
S
I |
PANW
-
NASDAQ
Palo Alto Networks
Computer Sftwr-Security
|
$366.41
|
-0.47
-0.13% |
$370.99
|
3,236,896
94.12% of 50 DAV
50 DAV is 3,439,000
|
$380.84
-3.79%
|
1/10/2024
|
$313.65
|
PP = $318.00
|
|
MB = $333.90
|
Most Recent Note - 2/13/2024 2:57:28 PM
G - Volume is above average behind today's loss, retreating from its all-time high. Very extended from any sound base. Prior high ($318) and its 50 DMA line ($319) define important support to watch on pullbacks.
>>> FEATURED STOCK ARTICLE : Paused After 6 Gains to a New All-Time High - 1/17/2024 |
View all notes |
Set NEW NOTE alert |
Company Profile |
SEC
News |
Chart |
Request a new note
C
A
S
I |
Symbol/Exchange
Company Name
Industry Group |
PRICE |
CHANGE
(%Change) |
Day High |
Volume
(% DAV)
(% 50 day avg vol) |
52 Wk Hi
% From Hi |
Featured
Date |
Price
Featured |
Pivot Featured |
|
Max Buy |
URI
-
NYSE
United Rentals
Comml Svcs-Leasing
|
$650.31
|
-10.65
-1.61% |
$660.47
|
366,456
54.05% of 50 DAV
50 DAV is 678,000
|
$673.68
-3.47%
|
1/24/2024
|
$576.90
|
PP = $585.60
|
|
MB = $614.88
|
Most Recent Note - 2/16/2024 1:10:43 PM
Undercutting the recent low with today's loss. A rebound above the 50 DMA line is needed for its outlook to improve. It will be dropped from the Featured Stocks list tonight. Reported Dec '23 quarterly earnings +16% on +13% sales revenues versus the year-ago period, below the +25% minimum earnings guideline (C criteria) raising fundamental concerns.
>>> FEATURED STOCK ARTICLE : Negative Reversal After New High for United Rentals - 1/24/2024 |
View all notes |
Set NEW NOTE alert |
Company Profile |
SEC
News |
Chart |
Request a new note
C
A
S
I |
TBBK
-
NASDAQ
The Bancorp
Banks-Northeast
|
$44.05
|
+0.35
0.80% |
$44.66
|
355,726
74.58% of 50 DAV
50 DAV is 477,000
|
$47.11
-6.50%
|
1/22/2024
|
$40.87
|
PP = $42.56
|
|
MB = $44.69
|
Most Recent Note - 2/16/2024 1:06:20 PM
Y - Consolidating well above prior highs in the $42 area and its 50 DMA liner which define near-term support to watch. Fundamentals remain strong.
>>> FEATURED STOCK ARTICLE : Volume-Driven Breakout Triggered Buy Signal After Earnings Report - 1/26/2024 |
View all notes |
Set NEW NOTE alert |
Company Profile |
SEC
News |
Chart |
Request a new note
C
A
S
I |
LULU
-
NASDAQ
lululemon athletica
Retail-Apparel/Shoes/Acc
|
$449.60
|
-9.38
-2.04% |
$457.39
|
1,340,387
90.44% of 50 DAV
50 DAV is 1,482,000
|
$516.39
-12.93%
|
12/8/2023
|
$490.61
|
PP = $485.93
|
|
MB = $510.23
|
Most Recent Note - 2/15/2024 9:00:12 PM
G - Volume was below average today while it is still lingering below its 50 DMA line ($482) which may act as resistance. A rebound above the 50 DMA line is needed to help its outlook improve.
>>> FEATURED STOCK ARTICLE : Violation of 50-Day Moving Average Hurt Outlook - 2/2/2024 |
View all notes |
Set NEW NOTE alert |
Company Profile |
SEC
News |
Chart |
Request a new note
C
A
S
I |
CRWD
-
NASDAQ
CrowdStrike Holdings
Computer Sftwr-Security
|
$329.32
|
-2.06
-0.62% |
$332.37
|
2,094,673
68.86% of 50 DAV
50 DAV is 3,042,000
|
$338.45
-2.70%
|
1/2/2024
|
$246.42
|
PP = $261.91
|
|
MB = $275.01
|
Most Recent Note - 2/12/2024 7:00:04 PM
G - Very extended from any sound base, it pulled back from its all-time high with average volume behind today's loss after 3 consecutive gains. Its 50 DMA line ($272) defines near-term support to watch. Fundamentals remain strong.
>>> FEATURED STOCK ARTICLE : Volume Totals Cooking While Stubbornly Perched at All-Time High - 2/6/2024 |
View all notes |
Set NEW NOTE alert |
Company Profile |
SEC
News |
Chart |
Request a new note
C
A
S
I |
ELF
-
NYSE
e.l.f. Beauty
Cosmetics/Personal Care
|
$173.98
|
-1.28
-0.73% |
$177.17
|
854,240
57.95% of 50 DAV
50 DAV is 1,474,000
|
$179.58
-3.12%
|
1/2/2024
|
$138.23
|
PP = $153.63
|
|
MB = $161.31
|
Most Recent Note - 2/15/2024 8:53:48 PM
G - Posted a gain today with near average volume for a best-ever close. Reported Dec '23 quarterly earnings +54% on +85% sales revenues versus the year-ago period, continuing its strong earnings track record. Its 50 DMA line ($152) defines important near-term support to watch.
>>> FEATURED STOCK ARTICLE : Peched at All-Time High With Earnings News Due - 2/5/2024 |
View all notes |
Set NEW NOTE alert |
Company Profile |
SEC
News |
Chart |
Request a new note
C
A
S
I |
Symbol/Exchange
Company Name
Industry Group |
PRICE |
CHANGE
(%Change) |
Day High |
Volume
(% DAV)
(% 50 day avg vol) |
52 Wk Hi
% From Hi |
Featured
Date |
Price
Featured |
Pivot Featured |
|
Max Buy |
KOF
-
NYSE
Coca-Cola Femsa ADR
Beverages-Non-Alcoholic
|
$100.75
|
+0.08
0.08% |
$101.42
|
128,107
83.19% of 50 DAV
50 DAV is 154,000
|
$102.94
-2.13%
|
1/12/2024
|
$93.38
|
PP = $99.34
|
|
MB = $104.31
|
Most Recent Note - 2/15/2024 8:58:13 PM
Y - Posted a 2nd consecutive gain with average volume for its second-best ever close. Its 50 DMA line ($93.66) defines important near-term support to watch on pullbacks. A valid secondary buy point was noted up to +5% above the 12/19/23 high since finding support at its 10 WMA line after an earlier breakout. Its Relative Strength Rating is currently 84, above the 80+ minimum guideline for buy candidates.
>>> FEATURED STOCK ARTICLE : Secondary Buy Point Noted After Finding Support - 1/12/2024 |
View all notes |
Set NEW NOTE alert |
Company Profile |
SEC
News |
Chart |
Request a new note
C
A
S
I |
PCAR
-
NASDAQ
Paccar
Trucks and Parts-Hvy Duty
|
$107.77
|
-0.29
-0.27% |
$108.67
|
2,594,308
113.74% of 50 DAV
50 DAV is 2,281,000
|
$108.58
-0.75%
|
1/23/2024
|
$100.35
|
PP = $98.57
|
|
MB = $103.50
|
Most Recent Note - 2/12/2024 7:06:27 PM
G - Hit a new all-time high with today's 8th consecutive gain, getting extended from any sound base. Reported Dec '23 quarterly earnings +53% on +11% sales revenues versus the year-ago period, its 9th quarterly comparison with better than the +25% minimum earnings guideline (C criteria). There was a downturn in FY' 20 annual earnings (A criteria) like many companies during the pandemic.
>>> FEATURED STOCK ARTICLE : Volume-Driven Breakout for Paccar - 1/23/2024 |
View all notes |
Set NEW NOTE alert |
Company Profile |
SEC
News |
Chart |
Request a new note
C
A
S
I |
HUBB
-
NYSE
Hubbell
Electrical-Power/Equipmt
|
$358.88
|
+0.19
0.05% |
$363.46
|
202,287
51.87% of 50 DAV
50 DAV is 390,000
|
$364.76
-1.61%
|
1/30/2024
|
$343.26
|
PP = $336.83
|
|
MB = $353.67
|
Most Recent Note - 2/15/2024 8:55:24 PM
G - Volume totals have been cooling while hovering near its all-time high, extended from the previously noted base. Prior high ($340) defines initial support to watch on pullbacks.
>>> FEATURED STOCK ARTICLE : Volume Heavy Behind Breakout Gain for Hubbell - 1/30/2024 |
View all notes |
Set NEW NOTE alert |
Company Profile |
SEC
News |
Chart |
Request a new note
C
A
S
I |
MANH
-
NASDAQ
Manhattan Associates
Computer Sftwr-Enterprse
|
$243.81
|
-3.59
-1.45% |
$247.50
|
168,720
40.85% of 50 DAV
50 DAV is 413,000
|
$258.91
-5.83%
|
1/31/2024
|
$240.57
|
PP = $230.71
|
|
MB = $242.25
|
Most Recent Note - 2/12/2024 7:05:13 PM
G - Pulled back from its all-time high with light volume behind today's loss. Prior highs in the $230 area define near-term support to watch on pullbacks.
>>> FEATURED STOCK ARTICLE : Big Volume Behind Breakout Gain - 1/31/2024 |
View all notes |
Set NEW NOTE alert |
Company Profile |
SEC
News |
Chart |
Request a new note
C
A
S
I |
TENB
-
NASDAQ
Tenable Holdings
Computer Sftwr-Security
|
$51.05
|
-0.40
-0.78% |
$51.52
|
959,286
96.41% of 50 DAV
50 DAV is 995,000
|
$53.50
-4.58%
|
2/7/2024
|
$49.50
|
PP = $49.87
|
|
MB = $52.36
|
Most Recent Note - 2/16/2024 1:08:29 PM
Y - Volume-totals have been cooling while hovering near its all-time high yet below its "max buy" level. Bullish action came after it reported earnings for the Dec '23 quarter +108% on +16% sales revenues versus the year-ago period. Prior highs in the $49 area define initial support to watch on pullbacks. Fundamentals remain strong.
>>> FEATURED STOCK ARTICLE : Gap Up Gain Followed Latest Earnings Report - 2/7/2024 |
View all notes |
Set NEW NOTE alert |
Company Profile |
SEC
News |
Chart |
Request a new note
C
A
S
I |
Symbol/Exchange
Company Name
Industry Group |
PRICE |
CHANGE
(%Change) |
Day High |
Volume
(% DAV)
(% 50 day avg vol) |
52 Wk Hi
% From Hi |
Featured
Date |
Price
Featured |
Pivot Featured |
|
Max Buy |
USLM
-
NASDAQ
U.S. Lime & Minerals
Bldg-Cement/Concrt/Ag
|
$256.66
|
-2.34
-0.90% |
$258.42
|
9,226
51.26% of 50 DAV
50 DAV is 18,000
|
$266.88
-3.83%
|
2/9/2024
|
$254.68
|
PP = $265.09
|
|
MB = $278.34
|
Most Recent Note - 2/13/2024 9:53:28 PM
Y - Gapped down today retreating from its all-time high after 4 consecutive gains. Finished strong and managed a best-ever close after highlighted in yellow in the 2/09/24 mid-day report with pivot point cited based on its 1/24/24 high plus 10 cents. Subsequent gains and a close above the pivot point backed by at least +40% above average volume may trigger a conviciing new technical buy signal. Through Dec '23 its quarterly and annual earnings (C and A criteria) history has been strong, a good match with the fact-based investment system's guidelines. Thinly traded firm has only 5.7 million shares outstanding (S criteria), which can contribute to greater price volatility in the event of institutional buying or selling.
>>> FEATURED STOCK ARTICLE : Strong Finish for Thinly Traded U.S Lime & Minerals - 2/9/2024 |
View all notes |
Set NEW NOTE alert |
Company Profile |
SEC
News |
Chart |
Request a new note
C
A
S
I |
|
|
|
THESE ARE NOT BUY RECOMMENDATIONS!
Comments contained in the body of this report are technical
opinions only. The material herein has been obtained
from sources believed to be reliable and accurate, however,
its accuracy and completeness cannot be guaranteed.
This site is not an investment advisor, hence it does
not endorse or recommend any securities or other investments.
Any recommendation contained in this report may not
be suitable for all investors and it is not to be deemed
an offer or solicitation on our part with respect to
the purchase or sale of any securities. All trademarks,
service marks and trade names appearing in this report
are the property of their respective owners, and are
likewise used for identification purposes only.
This report is a service available
only to active Paid Premium Members.
You may opt-out of receiving report notifications
at any time. Questions or comments may be submitted
by writing to Premium Membership Services 665 S.E. 10 Street, Suite 201 Deerfield Beach, FL 33441-5634 or by calling 1-800-965-8307
or 954-785-1121.
|
|
|