You are not logged in.
This means you
CAN ONLY VIEW reports that were published prior to Tuesday, March 25, 2025.
You
MUST UPGRADE YOUR MEMBERSHIP if you want to see any current reports.
AFTER MARKET UPDATE - MONDAY, JANUARY 29TH, 2024
Previous After Market Report Next After Market Report >>>
|
|
|
|
DOW |
+224.02 |
38,333.45 |
+0.59% |
|
Volume |
860,167,842 |
+13% |
|
Volume |
5,076,240,600 |
+10% |
|
NASDAQ |
+172.68 |
15,628.04 |
+1.12% |
|
Advancers |
2,022 |
72% |
|
Advancers |
2,957 |
69% |
|
S&P 500 |
+36.96 |
4,927.93 |
+0.76% |
|
Decliners |
770 |
28% |
|
Decliners |
1,344 |
31% |
|
Russell 2000 |
+33.09 |
2,011.42 |
+1.67% |
|
52 Wk Highs |
150 |
|
|
52 Wk Highs |
231 |
|
|
S&P 600 |
+14.58 |
1,304.65 |
+1.13% |
|
52 Wk Lows |
20 |
|
|
52 Wk Lows |
100 |
|
|
 |
Major Averages Rose With Better Leadership
Kenneth J. Gruneisen - Passed the CAN SLIM® Master's Exam
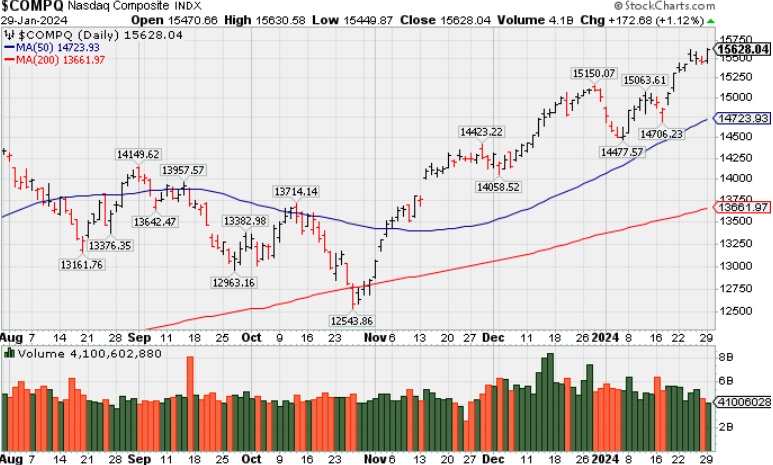
The S&P 500 (+0.8%) closed at a fresh all-time high (4,297.95). The Dow Jones Industrial Average rose 0.6%, the Nasdaq Composite climbed 1.1%, and the Russell 2000 jumped 1.7%. Volume was reported higher than the prior session total on the NYSE and on the Nasdaq exchange. Breadth was positive as advancers led decliners by a 10-4 margin on the NYSE and by more than a 2-1 margin on the Nasdaq exchange. There were 83 high-ranked companies from the Leaders List that hit new 52-week highs and were listed on the BreakOuts Page versus 46 on the prior session. New 52-week highs totals outnumbered new lows on the NYSE and on the Nasdaq exchange. The major indices are in a confirmed uptrend (M criteria). New buying efforts should be only made in stocks fitting all key criteria of the fact-based investment system.
PICTURED: The Nasdaq Composite Index is perched at a new multi-year high. It remains -3.6% off its Nov 2021 all-time high.
Geopolitical concerns rose after a drone attack by an Iranian-backed militant group on a U.S. outpost in Jordan that killed three U.S. soldiers and injured many others. WTI crude oil futures dropped 1.5% today to $76.87/bbl, suggesting the market is not overly concerned about disruptions to supplies. President Biden said that there will be a response to that attack.
The S&P 500 energy sector, which fell 0.2%. The remaining ten sectors saw gains ranging from 0.3% to 1.4%. The market may be indecisive until the FOMC meeting and Fed Chair Powell's press conference on Wednesday. It will be closely watched. The January Employment Situation Report is due to be released on Friday.
The 10-yr note yield dropped to 4.09% and the 2-yr note yield settled at 4.33%. There was a positive reaction to the Treasury Department's first quarter borrowing estimate, after plans to borrow $760 billion in Q1 came in $55 billion below the forecast from October. This was due to higher net fiscal flows and a higher cash balance at the beginning of the quarter. Borrowing in Q2 is expected to reach $202 billion.
|
 Kenneth J. Gruneisen started out as a licensed stockbroker in August 1987, a couple of months prior to the historic stock market crash that took the Dow Jones Industrial Average down -22.6% in a single day. He has published daily fact-based fundamental and technical analysis on high-ranked stocks online for two decades. Through FACTBASEDINVESTING.COM, Kenneth provides educational articles, news, market commentary, and other information regarding proven investment systems that work in good times and bad.
Comments contained in the body of this report are technical opinions only and are not necessarily those of Gruneisen Growth Corp. The material herein has been obtained from sources believed to be reliable and accurate, however, its accuracy and completeness cannot be guaranteed. Our firm, employees, and customers may effect transactions, including transactions contrary to any recommendation herein, or have positions in the securities mentioned herein or options with respect thereto. Any recommendation contained in this report may not be suitable for all investors and it is not to be deemed an offer or solicitation on our part with respect to the purchase or sale of any securities. |
|
 |
Tech, Gold & Silver, Retail, and Financial Indexes Rose
Kenneth J. Gruneisen - Passed the CAN SLIM® Master's Exam
The Retail Index ($RLX +0.94%) finished higher and the financial indexes also rose as the Broker/Dealer Index ($XBD +0.61%) and the Bank Index ($BKX +0.73%) both posted small gains. The tech sector had a positive bias as the Semiconductor Index ($SOX +1.06%), Biotech Index ($BTK +1.37%) and the Networking Index ($NWX +1.19%) posted unanimous gains. The Gold & Silver Index ($XAU +1.23%) rose while the Oil Services Index ($OSX +0.08%) finished flat and the Integrated Oil Index ($XOI -0.31%) edged lower.
Chart courtesy of www.stockcharts.com
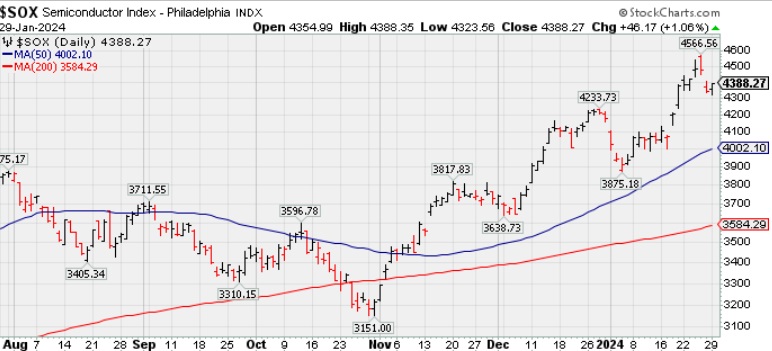
![]() PICTURED: The Semiconductor Index ($SOX +1.06%) posted a small gain while consolidating well above its 50-day moving average line.
| Oil Services |
$OSX |
84.22 |
+0.07 |
+0.08% |
+0.41% |
| Integrated Oil |
$XOI |
1,870.92 |
-5.78 |
-0.31% |
+0.45% |
| Semiconductor |
$SOX |
4,388.28 |
+46.17 |
+1.06% |
+5.10% |
| Networking |
$NWX |
871.41 |
+10.26 |
+1.19% |
+4.64% |
| Broker/Dealer |
$XBD |
552.75 |
+3.34 |
+0.61% |
-0.81% |
| Retail |
$RLX |
4,058.64 |
+37.95 |
+0.94% |
+4.37% |
| Gold & Silver |
$XAU |
115.14 |
+1.40 |
+1.23% |
-8.39% |
| Bank |
$BKX |
97.11 |
+0.71 |
+0.73% |
+1.13% |
| Biotech |
$BTK |
5,247.65 |
+70.94 |
+1.37% |
-3.16% |
|
|
|
 |
Featured Stocks
Kenneth J. Gruneisen - Passed the CAN SLIM® Master's Exam
|
|
|
Color Codes Explained :
Y - Better candidates highlighted by our
staff of experts.
G - Previously featured
in past reports as yellow but may no longer be buyable under the
guidelines.
***Last / Change / Volume data in this table is the closing quote data***
Symbol/Exchange
Company Name
Industry Group |
PRICE |
CHANGE
(%Change) |
Day High |
Volume
(% DAV)
(% 50 day avg vol) |
52 Wk Hi
% From Hi |
Featured
Date |
Price
Featured |
Pivot Featured |
|
Max Buy |
 ANET
-
NYSE
ANET
-
NYSE
Arista Networks
Computer-Networking
|
$269.58
|
+5.18
1.96% |
$269.78
|
1,917,502
119.84% of 50 DAV
50 DAV is 1,600,000
|
$270.63
-0.39%
|
10/31/2023
|
$188.84
|
PP = $198.80
|
|
MB = $208.74
|
Most Recent Note - 1/24/2024 7:11:55 PM
G - Churned higher volume today while hovering near its all-time high, extended from any sound base. Its 50 DMA line ($231.59) defines near-term support above the prior low ($226.60 on 1/04/24) area. Fundamentals remain strong.
>>> FEATURED STOCK ARTICLE : Extended From Base and Hovering at All-Time High - 12/26/2023 |
View all notes |
Set NEW NOTE alert |
Company Profile |
SEC
News |
Chart |
Request a new note
C
A
S
I |
NVO
-
NYSE
Novo Nordisk ADR
Medical-Ethical Drugs
|
$109.02
|
+0.95
0.88% |
$109.02
|
3,907,612
97.40% of 50 DAV
50 DAV is 4,012,000
|
$108.98
0.04%
|
11/2/2023
|
$100.97
|
PP = $104.10
|
|
MB = $109.31
|
Most Recent Note - 1/26/2024 6:34:15 PM
Y - Posted a gain today backed by +36% above average volume for its second-best-ever close. The recent low ($103.38 on 1/23/24) defines important near-term support nearly coinciding with its 50 DMA line ($102.64).
>>> FEATURED STOCK ARTICLE : Gap Up Gain on Prior Session Triggered Technical Buy Signal - 1/5/2024 |
View all notes |
Set NEW NOTE alert |
Company Profile |
SEC
News |
Chart |
Request a new note
C
A
S
I |
QLYS
-
NASDAQ
Qualys
Computer Sftwr-Security
|
$191.68
|
+2.89
1.53% |
$191.91
|
395,659
109.60% of 50 DAV
50 DAV is 361,000
|
$206.35
-7.11%
|
1/24/2024
|
$196.27
|
PP = $206.45
|
|
MB = $216.77
|
Most Recent Note - 1/26/2024 6:30:21 PM
G - Violated its 50 DMA line ($190) with today's loss backed by above-average volume triggering a technical sell signal. Color code is changed to green. Only a prompt rebound above the 50 DMA line would help its outlook improve.
>>> FEATURED STOCK ARTICLE : Posted Light Volume Gain Finding Support at 50-Day Moving Average - 1/8/2024 |
View all notes |
Set NEW NOTE alert |
Company Profile |
SEC
News |
Chart |
Request a new note
C
A
S
I |
AXON
-
NASDAQ
Axon Enterprise
Security/Sfty
|
$254.73
|
+3.37
1.34% |
$254.77
|
281,383
73.09% of 50 DAV
50 DAV is 385,000
|
$262.95
-3.13%
|
11/8/2023
|
$127.84
|
PP = $223.30
|
|
MB = $234.47
|
 Most Recent Note - 1/29/2024 6:32:39 PM
G - Posted a gain with below-average volume, hovering near its all-time high. Its 50-day moving average (DMA) line ($244) defines near-term support above prior highs in the $229-231 area.
>>> FEATURED STOCK ARTICLE : Consolidating Well Above Near-Term Support - 1/9/2024 |
View all notes |
Set NEW NOTE alert |
Company Profile |
SEC
News |
Chart |
Request a new note
C
A
S
I |
TDG
-
NYSE
TransDigm Group
Aerospace/Defense
|
$1,081.73
|
-0.75
-0.07% |
$1,088.41
|
145,437
72.72% of 50 DAV
50 DAV is 200,000
|
$1,089.97
-0.76%
|
12/12/2023
|
$1,000.39
|
PP = $1,013.18
|
|
MB = $1,063.84
|
Most Recent Note - 1/25/2024 5:44:15 PM
G - Posted again today and color code is changed to green as it rose above its "max buy" level for a new all-time high with a volume-driven gain. Prior highs in the $1,013-1,015 area define near-term support to watch on pullbacks.
>>> FEATURED STOCK ARTICLE : Inching to New Highs With 6th Consecutive Gain - 1/11/2024 |
View all notes |
Set NEW NOTE alert |
Company Profile |
SEC
News |
Chart |
Request a new note
C
A
S
I |
Symbol/Exchange
Company Name
Industry Group |
PRICE |
CHANGE
(%Change) |
Day High |
Volume
(% DAV)
(% 50 day avg vol) |
52 Wk Hi
% From Hi |
Featured
Date |
Price
Featured |
Pivot Featured |
|
Max Buy |
PANW
-
NASDAQ
Palo Alto Networks
Computer Sftwr-Security
|
$345.25
|
+2.81
0.82% |
$345.49
|
2,615,247
60.93% of 50 DAV
50 DAV is 4,292,000
|
$350.60
-1.53%
|
1/10/2024
|
$313.65
|
PP = $318.00
|
|
MB = $333.90
|
Most Recent Note - 1/24/2024 6:58:39 PM
Y - Perched near its all-time high, stubbornly holding its ground with recent volume totals below average. A valid secondary buy point exists up to 5% above the prior high after finding support at its 10 WMA line since the prior breakout. Fundamentals remain strong.
>>> FEATURED STOCK ARTICLE : Paused After 6 Gains to a New All-Time High - 1/17/2024 |
View all notes |
Set NEW NOTE alert |
Company Profile |
SEC
News |
Chart |
Request a new note
C
A
S
I |
URI
-
NYSE
United Rentals
Comml Svcs-Leasing
|
$647.73
|
+16.98
2.69% |
$648.25
|
597,795
83.03% of 50 DAV
50 DAV is 720,000
|
$658.51
-1.64%
|
1/24/2024
|
$576.90
|
PP = $585.60
|
|
MB = $614.88
|
Most Recent Note - 1/26/2024 6:31:16 PM
C - Pulled back today with above-average volume. Color code was changed to green after it gapped up on the prior session and rallied to a new all-time high (and above the "max buy" level) with heavy volume triggering a technical buy signal. Reported Dec '23 quarterly earnings +16% on +13% sales revenues versus the year-ago period, below the +25% minimum earnings guideline (C criteria) raising fundamental concerns. Its prior low ($533.70) and 50 DMA line define near-term support to watch.
>>> FEATURED STOCK ARTICLE : Negative Reversal After New High for United Rentals - 1/24/2024 |
View all notes |
Set NEW NOTE alert |
Company Profile |
SEC
News |
Chart |
Request a new note
C
A
S
I |
AMPH
-
NASDAQ
Amphastar Pharm
Medical-Biomed/Biotech
|
$55.42
|
+1.54
2.86% |
$55.56
|
1,156,479
242.45% of 50 DAV
50 DAV is 477,000
|
$67.66
-18.09%
|
12/4/2023
|
$60.84
|
PP = $58.35
|
|
MB = $61.27
|
Most Recent Note - 1/25/2024 5:39:07 PM
G - Quietly slumped further below its 50 DMA line toward its 200 DMA line. A rebound above the 50 DMA line ($57.76) is needed for its outlook to improve. Fundamentals remain strong. See the latest FSU analysis for more details and a new annotated graph.
>>> FEATURED STOCK ARTICLE : Quietly Sinking Toward 200-Day Moving Average Line - 1/25/2024 |
View all notes |
Set NEW NOTE alert |
Company Profile |
SEC
News |
Chart |
Request a new note
C
A
S
I |
TBBK
-
NASDAQ
The Bancorp
Banks-Northeast
|
$45.23
|
+1.58
3.62% |
$45.46
|
532,033
125.18% of 50 DAV
50 DAV is 425,000
|
$44.18
2.38%
|
1/22/2024
|
$40.87
|
PP = $42.56
|
|
MB = $44.69
|
Most Recent Note - 1/26/2024 6:28:01 PM
Y - Powered above its pivot point to a new all-time high with today's gain backed by +86% above average volume triggering a technical buy signal. Bullish action came after it reported Dec '23 quarterly earnings +34% on +16% sales revenues versus the year-ago period. Volume and volatility often increase near earnings news. See the latest FSU analysis for more details and a new annotated graph.
>>> FEATURED STOCK ARTICLE : Volume-Driven Breakout Triggered Buy Signal After Earnings Report - 1/26/2024 |
View all notes |
Set NEW NOTE alert |
Company Profile |
SEC
News |
Chart |
Request a new note
C
A
S
I |
LULU
-
NASDAQ
lululemon athletica
Retail-Apparel/Shoes/Acc
|
$481.99
|
+3.96
0.83% |
$482.44
|
1,071,758
70.70% of 50 DAV
50 DAV is 1,516,000
|
$516.39
-6.66%
|
12/8/2023
|
$490.61
|
PP = $485.93
|
|
MB = $510.23
|
Most Recent Note - 1/23/2024 8:11:28 PM
Y - Still consolidating just above its 50 DMA line ($471) which defines important near-term support to watch. Retreat below its 2021 high of $485 raised concerns, negating its recent breakout from a 2+ year base.
>>> FEATURED STOCK ARTICLE : Perched at All-Time High With Volume Totals Cooling - 12/27/2023 |
View all notes |
Set NEW NOTE alert |
Company Profile |
SEC
News |
Chart |
Request a new note
C
A
S
I |
Symbol/Exchange
Company Name
Industry Group |
PRICE |
CHANGE
(%Change) |
Day High |
Volume
(% DAV)
(% 50 day avg vol) |
52 Wk Hi
% From Hi |
Featured
Date |
Price
Featured |
Pivot Featured |
|
Max Buy |
CRWD
-
NASDAQ
CrowdStrike Holdings
Computer Sftwr-Security
|
$300.67
|
+10.36
3.57% |
$300.70
|
2,947,193
85.97% of 50 DAV
50 DAV is 3,428,000
|
$307.55
-2.24%
|
1/2/2024
|
$246.42
|
PP = $261.91
|
|
MB = $275.01
|
Most Recent Note - 1/25/2024 5:40:57 PM
G - Extended from any sound base and it pulled back from its all-time high with today's volume-driven loss. Prior high in the $261 area defines initial support to watch above its 50 DMA line ($249). Fundamentals remain strong.
>>> FEATURED STOCK ARTICLE : CrowdStrike Holdings Pulling Back After "3-Weeks Tight" Pattern - 1/3/2024 |
View all notes |
Set NEW NOTE alert |
Company Profile |
SEC
News |
Chart |
Request a new note
C
A
S
I |
ELF
-
NYSE
e.l.f. Beauty
Cosmetics/Personal Care
|
$158.84
|
+1.70
1.08% |
$159.00
|
1,251,774
88.34% of 50 DAV
50 DAV is 1,417,000
|
$164.71
-3.56%
|
1/2/2024
|
$138.23
|
PP = $153.63
|
|
MB = $161.31
|
Most Recent Note - 1/29/2024 6:34:13 PM
Y - Holding its ground in a tight range above the pivot point and below its "max buy" level. Fundamentals remain strong.
>>> FEATURED STOCK ARTICLE : Pulled Back After Closing 3 Weeks Tight - 1/2/2024 |
View all notes |
Set NEW NOTE alert |
Company Profile |
SEC
News |
Chart |
Request a new note
C
A
S
I |
KOF
-
NYSE
Coca Cola Femsa Sab Ads
FOOD and BEVERAGE - Beverages - Soft Drinks
|
$92.78
|
+0.86
0.94% |
$93.11
|
116,486
83.50% of 50 DAV
50 DAV is 139,500
|
$99.34
-6.60%
|
1/12/2024
|
$93.38
|
PP = $99.34
|
|
MB = $104.31
|
Most Recent Note - 1/29/2024 6:36:11 PM
Y - Posted a 3rd consecutive gain with lighter volume, finding support above its 50 DMA line ($90.37). Color code was changed to yellow as a valid secondary buy point was noted up to +5% above the recent high since finding support at its 10 WMA line after an earlier breakout. Its Relative Strength Rating is currently 77, below the 80+ minimum guideline for buy candidates.
>>> FEATURED STOCK ARTICLE : Secondary Buy Point Noted After Finding Support - 1/12/2024 |
View all notes |
Set NEW NOTE alert |
Company Profile |
SEC
News |
Chart |
Request a new note
C
A
S
I |
PCAR
-
NASDAQ
Paccar
Trucks and Parts-Hvy Duty
|
$101.39
|
-0.37
-0.36% |
$102.04
|
1,832,733
79.65% of 50 DAV
50 DAV is 2,301,000
|
$103.40
-1.94%
|
1/23/2024
|
$100.35
|
PP = $98.57
|
|
MB = $103.50
|
Most Recent Note - 1/24/2024 7:02:14 PM
Y - Paused today after 6 consecutive gains. Triggered a technical buy signal on the prior session with a considerable gain backed by +153% above average volume. Reported Dec '23 quarterly earnings +53% on +11% sales revenues versus the year-ago period, its 9th quarterly comparison with better than the +25% minimum earnings guideline (C criteria). There was a downturn in FY' 20 annual earnings (A criteria) like many companies during the pandemic.
>>> FEATURED STOCK ARTICLE : Volume-Driven Breakout for Paccar - 1/23/2024 |
View all notes |
Set NEW NOTE alert |
Company Profile |
SEC
News |
Chart |
Request a new note
C
A
S
I |
|
|
|
THESE ARE NOT BUY RECOMMENDATIONS!
Comments contained in the body of this report are technical
opinions only. The material herein has been obtained
from sources believed to be reliable and accurate, however,
its accuracy and completeness cannot be guaranteed.
This site is not an investment advisor, hence it does
not endorse or recommend any securities or other investments.
Any recommendation contained in this report may not
be suitable for all investors and it is not to be deemed
an offer or solicitation on our part with respect to
the purchase or sale of any securities. All trademarks,
service marks and trade names appearing in this report
are the property of their respective owners, and are
likewise used for identification purposes only.
This report is a service available
only to active Paid Premium Members.
You may opt-out of receiving report notifications
at any time. Questions or comments may be submitted
by writing to Premium Membership Services 665 S.E. 10 Street, Suite 201 Deerfield Beach, FL 33441-5634 or by calling 1-800-965-8307
or 954-785-1121.
|
|
|