You are not logged in.
This means you
CAN ONLY VIEW reports that were published prior to Tuesday, March 25, 2025.
You
MUST UPGRADE YOUR MEMBERSHIP if you want to see any current reports.
AFTER MARKET UPDATE - WEDNESDAY, JANUARY 18TH, 2023
Previous After Market Report Next After Market Report >>>
|
|
|
|
DOW |
-613.89 |
33,296.96 |
-1.81% |
|
Volume |
898,034,501 |
-0% |
|
Volume |
5,204,014,100 |
+1% |
|
NASDAQ |
-138.10 |
10,957.01 |
-1.24% |
|
Advancers |
1,020 |
34% |
|
Advancers |
1,421 |
31% |
|
S&P 500 |
-62.11 |
3,928.86 |
-1.56% |
|
Decliners |
2,008 |
66% |
|
Decliners |
3,157 |
69% |
|
Russell 2000 |
-29.92 |
1,854.30 |
-1.59% |
|
52 Wk Highs |
101 |
|
|
52 Wk Highs |
115 |
|
|
S&P 600 |
-19.40 |
1,215.10 |
-1.57% |
|
52 Wk Lows |
8 |
|
|
52 Wk Lows |
27 |
|
|
 |
Breadth Negative as Major Average Slumped
Kenneth J. Gruneisen - Passed the CAN SLIM® Master's Exam
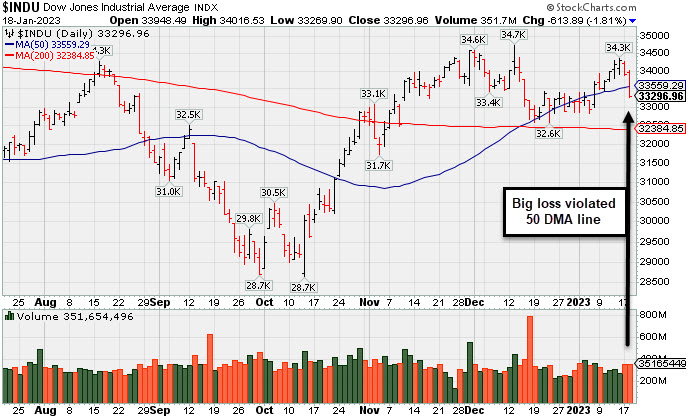
The Dow lost 613 points, while the tech-heavy Nasdaq Composite shed 1.2%. The S&P 500 fell 1.6% with all sectors finishing in negative territory. Volume totals were mixed, lighter than the prior session on the NYSE and higher on the Nasdaq exchange. Breadth was negative as decliners led advancers by a 2-1 margin on the NYSE and on the Nasdaq exchange. There were 28 high-ranked companies from the Leaders List that hit new 52-week highs and were listed on the BreakOuts Page versus the total of 37 on the prior session. New 52-week highs totals contracted yet still outnumbered new 52-week lows on the NYSE and on the Nasdaq exchange. The major indices are in a confirmed uptrend (M criteria) which gives disciplined investors a green light for making new buys only in stocks matching all key criteria of the fact-based investment system.
PICTURED: The Dow Jones Industrial Average violated its 50-day moving average line with Wednesday's big loss.
U.S. equities reversed course to finish lower on Wednesday as weak economic data and earnings renewed concerns over an economic slowdown. Market participants also digested a flurry of commentary from Federal Reserve (Fed) officials. St. Louis Fed President James Bullard indicated rates are “almost” in restrictive territory. Elsewhere Cleveland Fed President Loretta Mester supported further interest rate hikes but did not specify the size of upcoming increases.
On the data front, retail sales fell more than expected, down 1.1% month-over-month in December. The report reflected easing inflation and weak consumer demand. Meanwhile, the December Producer Price Index (PPI) fell more than expected, coming in at -0.5% month-over-month, while core PPI (which excludes more volatile food and energy components) eased as expected to 0.1%. Headline PPI eased from 7.3% year-over-year to 6.2%, while core PPI showed prices rose at a 5.5% annual rate. In corporate news, Microsoft Corp (MSFT -1.89%) fell after announcing they plan to lay off 10,000 workers. The tech-giant is the latest to announce large-scale layoffs as companies grow increasingly concerned about an economic slowdown.
Treasuries rallied, with the yield on the benchmark 10-year note down 18 basis points (0.18%) to 3.37%, while the 30-year bond yield slid 13 basis points (0.13%) to 3.53%. The yield on the two-year note shed 13 basis points (0.13%) to 4.07%. In commodities, West Texas Intermediate (WTI) fell 1.2% to $79.19/barrel amid renewed worries over a potential recession. |
 Kenneth J. Gruneisen started out as a licensed stockbroker in August 1987, a couple of months prior to the historic stock market crash that took the Dow Jones Industrial Average down -22.6% in a single day. He has published daily fact-based fundamental and technical analysis on high-ranked stocks online for two decades. Through FACTBASEDINVESTING.COM, Kenneth provides educational articles, news, market commentary, and other information regarding proven investment systems that work in good times and bad.
Comments contained in the body of this report are technical opinions only and are not necessarily those of Gruneisen Growth Corp. The material herein has been obtained from sources believed to be reliable and accurate, however, its accuracy and completeness cannot be guaranteed. Our firm, employees, and customers may effect transactions, including transactions contrary to any recommendation herein, or have positions in the securities mentioned herein or options with respect thereto. Any recommendation contained in this report may not be suitable for all investors and it is not to be deemed an offer or solicitation on our part with respect to the purchase or sale of any securities. |
|
 |
Losses for Financial, Retail, Tech, and Commodity-Linked Groups
Kenneth J. Gruneisen - Passed the CAN SLIM® Master's Exam
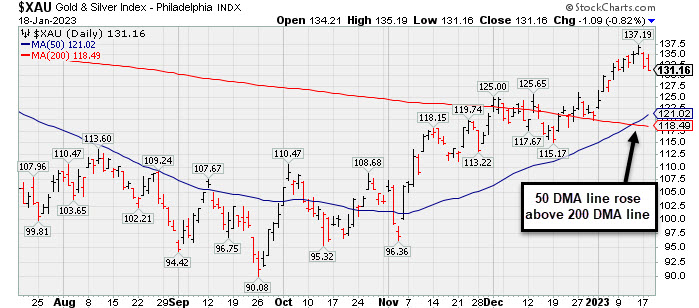
The Bank Index ($BKX -2.56%), Broker/Dealer Index ($XBD -0.97%), and Retail Index ($RLX -0.96%) suffered unanimous losses The Networking Index ($NWX -1.25%) led the tech sector lower while the Semiconductor Index ($SOX -0.64%) and Biotech Index ($BTK -0.53%) both suffered smaller losses. The Oil Services Index ($OSX -3.23%) and Integrated Oil Index ($XOI -1.06%) both outpaced the Gold & Silver Index ($XAU -0.82%) to the downside.
PICTURED: The Gold & Silver Index's ($XAU -0.82%) pulled back for a 2nd consecutive loss. Its 50-day moving average (DMA) line recently rose above its 200 DMA line.
| Oil Services |
$OSX |
89.45 |
-2.99 |
-3.23% |
+6.66% |
| Integrated Oil |
$XOI |
1,824.21 |
-19.48 |
-1.06% |
+2.07% |
| Semiconductor |
$SOX |
2,789.47 |
-18.01 |
-0.64% |
+10.16% |
| Networking |
$NWX |
809.39 |
-10.28 |
-1.25% |
+3.33% |
| Broker/Dealer |
$XBD |
476.88 |
-4.67 |
-0.97% |
+6.18% |
| Retail |
$RLX |
2,943.34 |
-28.51 |
-0.96% |
+6.88% |
| Gold & Silver |
$XAU |
131.16 |
-1.09 |
-0.82% |
+8.52% |
| Bank |
$BKX |
104.62 |
-2.75 |
-2.56% |
+3.74% |
| Biotech |
$BTK |
5,473.64 |
-29.06 |
-0.53% |
+3.65% |
|
|
|
 |
Pulling Back After Rallying From 50-Day Moving Average Line
Kenneth J. Gruneisen - Passed the CAN SLIM® Master's Exam
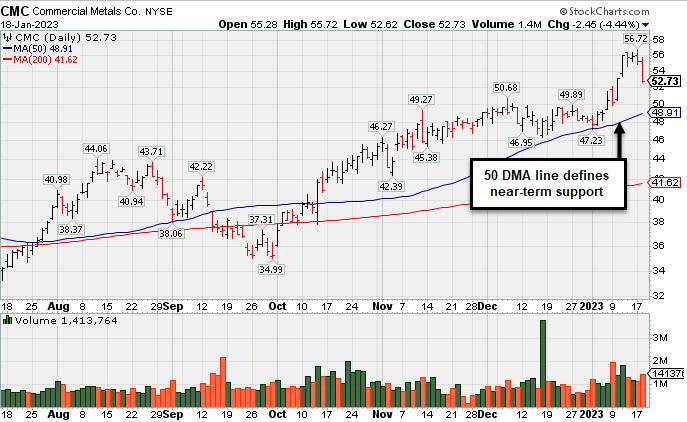
Commercial Metals Co (CMC -$2.45 or -4.44% to $52.73) pulled back today with higher volume following a "negative reversal" on the prior session after hitting a new 52-week high. Its 50-day moving average (DMA) line ($49.05) defines important near-term support to watch on pullbacks. Fundamentals remain strong.
CMC has a highest possible 99 Earnings Per Share Rating. It reported Nov '22 quarterly earnings +38% on +12% sales revenues versus the year ago period and prior quarterly comparisons were well above the +25% minimum earnings guideline (C criteria) of the fact-based investment system. Annual earnings growth has been strong. It hails from the Metal Proc & Fabrication group which is currently ranked 26th on the 197 Industry Groups list (L criteria).
The company has 117.3 million shares outstanding (S criteria). The number of top-rated funds owning its shares rose from 586 in Dec '21 to 650 in Dec '22. Its current Up/Down Volume Ratio of 1.5 is an unbiased indication its shares have been under accumulation over the past 50 days. It has a Timeliness Rating of A and a Sponsorship Rating of B.
|
|
|
Color Codes Explained :
Y - Better candidates highlighted by our
staff of experts.
G - Previously featured
in past reports as yellow but may no longer be buyable under the
guidelines.
***Last / Change / Volume data in this table is the closing quote data***
Symbol/Exchange
Company Name
Industry Group |
PRICE |
CHANGE
(%Change) |
Day High |
Volume
(% DAV)
(% 50 day avg vol) |
52 Wk Hi
% From Hi |
Featured
Date |
Price
Featured |
Pivot Featured |
|
Max Buy |
 CMC
-
NYSE
CMC
-
NYSE
Commercial Metals Co
METALS and MINING - Steel and Iron
|
$52.73
|
-2.45
-4.44% |
$55.72
|
1,414,995
142.64% of 50 DAV
50 DAV is 992,000
|
$56.88
-7.30%
|
10/14/2022
|
$41.61
|
PP = $44.45
|
|
MB = $46.67
|
 Most Recent Note - 1/18/2023 5:15:40 PM
G - Suffered a larger loss today with higher volume after a "negative reversal" on the prior session at its 52-week high. Its 50 DMA line ($49.05) defines important near-term support to watch on pullbacks. Fundamentals remain strong. See the latest FSU analysis for more details and a new annotated graph.
>>> FEATURED STOCK ARTICLE : Pulling Back After Rallying From 50-Day Moving Average Line - 1/18/2023 |
View all notes |
Set NEW NOTE alert |
Company Profile |
SEC
News |
Chart |
Request a new note
C
A
S
I |
GPK
-
NYSE
Graphic Packaging Hldg
CONSUMER NON-DURABLES - Packaging and Containers
|
$22.29
|
+0.06
0.27% |
$22.54
|
2,976,468
103.46% of 50 DAV
50 DAV is 2,876,800
|
$24.07
-7.40%
|
10/25/2022
|
$22.75
|
PP = $24.17
|
|
MB = $25.38
|
Most Recent Note - 1/17/2023 5:59:51 PM
Y - Consolidating near its 50 DMA line ($22.31) after recently finding support at its 200 DMA line ($21.71). More damaging losses may raise concerns. Faces some resistance due to overhead supply up to the $24 level. Fundamentals remain strong.
>>> FEATURED STOCK ARTICLE : Found Support at 200-Day Moving Average and Still Faces Resistance - 1/10/2023 |
View all notes |
Set NEW NOTE alert |
Company Profile |
SEC
News |
Chart |
Request a new note
C
A
S
I |
GFF
-
NYSE
Griffon Corporation
MATERIALS and CONSTRUCTION - General Building Materials
|
$38.57
|
-1.30
-3.26% |
$40.74
|
397,551
83.17% of 50 DAV
50 DAV is 478,000
|
$39.99
-3.55%
|
11/10/2022
|
$34.13
|
PP = $35.02
|
|
MB = $36.77
|
Most Recent Note - 1/17/2023 12:39:58 PM
G - Perched at its 52-week high after recent volume-driven gains. Its 50 DMA line ($35.30) defines near-term support above recent lows in the $33.82 area. Reported Sep '22 quarterly earnings +230% on +24% sales revenues versus the year ago period.
>>> FEATURED STOCK ARTICLE : Rose Above Max Buy Level With 4th Consecutive Gain - 1/4/2023 |
View all notes |
Set NEW NOTE alert |
Company Profile |
SEC
News |
Chart |
Request a new note
C
A
S
I |
CPRX
-
NASDAQ
Catalyst Pharma Inc
Medical-Biomed/Biotech
|
$20.43
|
+0.29
1.44% |
$20.69
|
2,258,094
90.00% of 50 DAV
50 DAV is 2,509,000
|
$22.11
-7.60%
|
11/22/2022
|
$17.38
|
PP = $16.66
|
|
MB = $17.49
|
Most Recent Note - 1/17/2023 5:56:55 PM
G - Pulled back from its 52-week high with today's loss following 4 consecutive gains. Its 50 DMA line ($17.26) defines near-term support to watch on pullbacks.
>>> FEATURED STOCK ARTICLE : Making Gradual Progress Hitting Another New High - 1/11/2023 |
View all notes |
Set NEW NOTE alert |
Company Profile |
SEC
News |
Chart |
Request a new note
C
A
S
I |
TITN
-
NASDAQ
Titan Machinery Inc
SPECIALTY RETAIL
|
$40.81
|
-1.77
-4.16% |
$43.09
|
259,404
111.81% of 50 DAV
50 DAV is 232,000
|
$44.35
-7.98%
|
1/13/2023
|
$40.10
|
PP = $44.45
|
|
MB = $46.67
|
Most Recent Note - 1/18/2023 5:18:53 PM
Y - Pulled back today with higher (near average) volume. The prior high in the $38 area defines important support to watch along with its 50 DMA line ($38.48)..A new pivot point was recently cited based on its 12/01/22 high plus 10 cents.
>>> FEATURED STOCK ARTICLE : Forming New Base for Past 7 Weeks - 1/13/2023 |
View all notes |
Set NEW NOTE alert |
Company Profile |
SEC
News |
Chart |
Request a new note
C
A
S
I |
Symbol/Exchange
Company Name
Industry Group |
PRICE |
CHANGE
(%Change) |
Day High |
Volume
(% DAV)
(% 50 day avg vol) |
52 Wk Hi
% From Hi |
Featured
Date |
Price
Featured |
Pivot Featured |
|
Max Buy |
MYE
-
NYSE
Myers Industries Inc
Containers/Packaging
|
$23.54
|
-0.91
-3.72% |
$24.48
|
93,065
55.40% of 50 DAV
50 DAV is 168,000
|
$25.55
-7.87%
|
12/8/2022
|
$23.94
|
PP = $25.65
|
|
MB = $26.93
|
Most Recent Note - 1/13/2023 5:16:18 PM
Y - Posted a 6th consecutive gain today with below average volume after testing its 50 DMA line ($22.57) last week. Faces little resistance due to overhead supply up to the $25.50 level.
>>> FEATURED STOCK ARTICLE : Pullback Testing 50-Day Moving Average Line - 1/5/2023 |
View all notes |
Set NEW NOTE alert |
Company Profile |
SEC
News |
Chart |
Request a new note
C
A
S
I |
BOX
-
NYSE
Box Inc Cl A
Computer Sftwr-Database
|
$30.62
|
-0.31
-1.00% |
$31.52
|
1,378,522
104.20% of 50 DAV
50 DAV is 1,323,000
|
$33.04
-7.32%
|
12/12/2022
|
$29.83
|
PP = $29.57
|
|
MB = $31.05
|
Most Recent Note - 1/18/2023 5:21:10 PM
Y - There was a "negative reversal today after early gains and it closed near the session low. Its 50 DMA line ($29.37) defines important near-term support to watch. Still faces some resistance due to overhead supply up to the $32 level. Quarterly and annual earnings increases have been strong and steady.
>>> FEATURED STOCK ARTICLE : Pulled Back After Perched Near All-Time High - 1/6/2023 |
View all notes |
Set NEW NOTE alert |
Company Profile |
SEC
News |
Chart |
Request a new note
C
A
S
I |
STRL
-
NASDAQ
Sterling Infrastructure
MATERIALS and; CONSTRUCTION - Heavy Construction
|
$31.85
|
-0.50
-1.55% |
$33.04
|
236,377
112.03% of 50 DAV
50 DAV is 211,000
|
$34.86
-8.63%
|
12/14/2022
|
$32.41
|
PP = $33.72
|
|
MB = $35.41
|
Most Recent Note - 1/17/2023 5:58:57 PM
Y - There was a "negative reversal" today for a loss with higher volume after early gains nearly challenging its prior high. Its 50 DMA line ($32.15) defines important support after its recent failed breakout attempt. Highlighted in yellow with pivot point cited based on its 11/08/22 high plus 10 cents in the 12/14/22 mid-day report. Confirming volume-driven gains for a new high would be a reassuring sign of fresh institutional buying demand.
>>> FEATURED STOCK ARTICLE : Finding Support Near 50-Day Moving Average After Failed Breakout Attempt - 1/9/2023 |
View all notes |
Set NEW NOTE alert |
Company Profile |
SEC
News |
Chart |
Request a new note
C
A
S
I |
|
|
|
THESE ARE NOT BUY RECOMMENDATIONS!
Comments contained in the body of this report are technical
opinions only. The material herein has been obtained
from sources believed to be reliable and accurate, however,
its accuracy and completeness cannot be guaranteed.
This site is not an investment advisor, hence it does
not endorse or recommend any securities or other investments.
Any recommendation contained in this report may not
be suitable for all investors and it is not to be deemed
an offer or solicitation on our part with respect to
the purchase or sale of any securities. All trademarks,
service marks and trade names appearing in this report
are the property of their respective owners, and are
likewise used for identification purposes only.
This report is a service available
only to active Paid Premium Members.
You may opt-out of receiving report notifications
at any time. Questions or comments may be submitted
by writing to Premium Membership Services 665 S.E. 10 Street, Suite 201 Deerfield Beach, FL 33441-5634 or by calling 1-800-965-8307
or 954-785-1121.
|
|
|