You are not logged in.
This means you
CAN ONLY VIEW reports that were published prior to Monday, April 7, 2025.
You
MUST UPGRADE YOUR MEMBERSHIP if you want to see any current reports.
AFTER MARKET UPDATE - TUESDAY, JANUARY 3RD, 2023
Previous After Market Report Next After Market Report >>>
|
|
|
|
DOW |
-10.88 |
33,136.37 |
-0.03% |
|
Volume |
909,717,398 |
+20% |
|
Volume |
4,722,636,900 |
+21% |
|
NASDAQ |
-79.50 |
10,386.98 |
-0.76% |
|
Advancers |
1,832 |
61% |
|
Advancers |
2,504 |
54% |
|
S&P 500 |
-15.36 |
3,824.14 |
-0.40% |
|
Decliners |
1,183 |
39% |
|
Decliners |
2,142 |
46% |
|
Russell 2000 |
-10.51 |
1,750.73 |
-0.60% |
|
52 Wk Highs |
71 |
|
|
52 Wk Highs |
108 |
|
|
S&P 600 |
-2.00 |
1,155.53 |
-0.17% |
|
52 Wk Lows |
36 |
|
|
52 Wk Lows |
94 |
|
|
The market is in a correction (M criteria). Thin leadership was a recent warning sign as weakness in the major averages was noted. Disciplined investors know to avoid new buying, reduce exposure and raise cash until a new confirmed rally with a solid follow-through day is noted.
|
 |
Indices Erased Early Gains to End First Session of New Year Lower
Kenneth J. Gruneisen - Passed the CAN SLIM® Master's Exam
The Dow lost 10 points, while the S&P 500 slid 0.4%. The technology-heavy Nasdaq Composite declined 0.8%. Volume totals were higher than the prior session on the NYSE and on the Nasdaq exchange. Advancers led decliners by a 3-2 margin on the NYSE and by a narrower margin on the Nasdaq exchange. There were 10 high-ranked companies from the Leaders List that hit new 52-week highs and were listed on the BreakOuts Page versus the total of 5 on the prior session. New 52-week highs outnumbered new 52-week lows on the NYSE and on the Nasdaq exchange. The market is in a correction (M criteria). Disciplined investors know to avoid new buying, reduce exposure and raise cash until a new confirmed rally with a solid follow-through day is noted.
Chart courtesy of www.stockcharts.com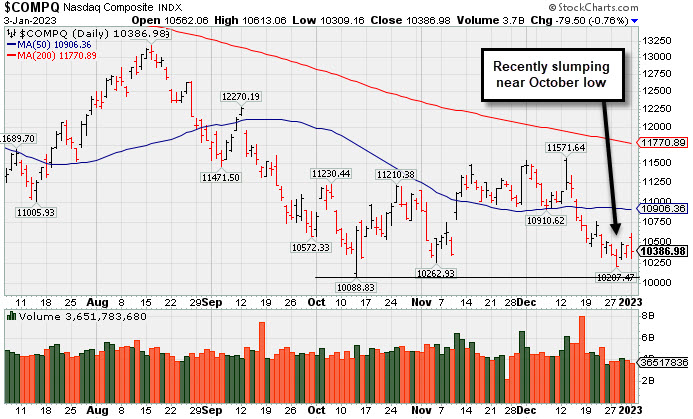 PICTURED: The Nasdaq Composite Index has recently been slumping toward its October low.
U.S. equities pared earlier gains to finish lower Tuesday as investors struggled to shake off concerns over high inflation and an impending recession that plagued last year. Six of 11 sectors in the S&P 500 finished in negative territory for the day. Technology was hit hard in 2022 as the Federal Reserve’s (Fed) ultra-aggressive monetary policy pressured growth-related shares.
On the data front, a final update from S&P Global’s U.S. Manufacturing Purchasing Managers’ Index (PMI) remained unchanged at 46.2, marking its fastest pace of declines since May 2020. Meanwhile, construction spending unexpectedly climbed 0.2% month-over-month in November, up from the prior month’s 0.2% monthly decline. In corporate news, a massive sell-off of shares of Apple Inc (AAPL -3.74%) has pushed the company’s market capitalization under $2 trillion. Elsewhere, Tesla Inc (TSLA -12.24%) sank after reporting that fourth-quarter vehicles fell short of forecasts.
Treasuries strengthened, with the yield on the benchmark 10-year note down 10 basis points (0.10%) to 3.77%, while the 30-year bond yield shed nine basis points (0.09%) to 3.87%. The yield on the more Fed-sensitive two-year note dipped five basis points (0.05%) to 4.38%. In commodities, West Texas Intermediate (WTI) crude declined 3.8% to $77.22/barrel amid heightened demand concerns due to a darkening economic outlook and weak data from China. The U.S. Dollar Index climbed 1.1%, further pressuring commodities prices.
|
 Kenneth J. Gruneisen started out as a licensed stockbroker in August 1987, a couple of months prior to the historic stock market crash that took the Dow Jones Industrial Average down -22.6% in a single day. He has published daily fact-based fundamental and technical analysis on high-ranked stocks online for two decades. Through FACTBASEDINVESTING.COM, Kenneth provides educational articles, news, market commentary, and other information regarding proven investment systems that work in good times and bad.
Comments contained in the body of this report are technical opinions only and are not necessarily those of Gruneisen Growth Corp. The material herein has been obtained from sources believed to be reliable and accurate, however, its accuracy and completeness cannot be guaranteed. Our firm, employees, and customers may effect transactions, including transactions contrary to any recommendation herein, or have positions in the securities mentioned herein or options with respect thereto. Any recommendation contained in this report may not be suitable for all investors and it is not to be deemed an offer or solicitation on our part with respect to the purchase or sale of any securities. |
|
 |
Energy-Linked Groups Fell; Gold & Silver, Retail, and Financials Rose
Kenneth J. Gruneisen - Passed the CAN SLIM® Master's Exam
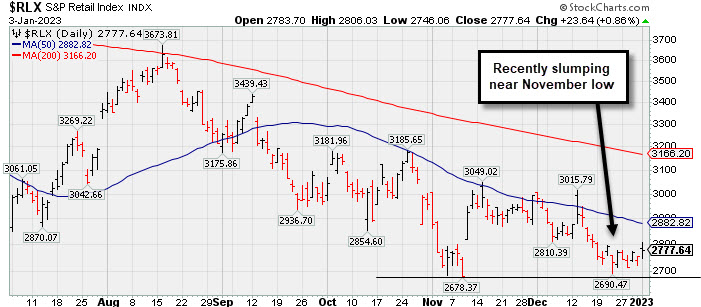
The Retail Index ($RLX +0.86%) and Bank Index ($BKX +0.61%) each posted a small gain and the Broker/Dealer Index ($XBD +0.18%) also inched higher. Commodity-linked groups were mixed as the Oil Services Index ($OSX -4.34%) and Integrated Oil Index ($XOI -4.15%) both suffered big losses while the Gold & Silver Index ($XAU +2.76%) posted a solid gain. The Semiconductor Index ($SOX -1.23%) and Biotech Index ($BTK -0.52%) lost ground while the Networking Index ($NWX +0.31%) inched higher.
PICTURED: The Retail Index ($RLX +0.86%) recently met resistance near its 50-day moving average (DMA) line and has been slumping near its November low.
| Oil Services |
$OSX |
80.21 |
-3.64 |
-4.34% |
-4.35% |
| Integrated Oil |
$XOI |
1,713.07 |
-74.18 |
-4.15% |
-4.15% |
| Semiconductor |
$SOX |
2,500.99 |
-31.12 |
-1.23% |
-1.23% |
| Networking |
$NWX |
785.75 |
+2.45 |
+0.31% |
+0.31% |
| Broker/Dealer |
$XBD |
449.92 |
+0.79 |
+0.18% |
+0.18% |
| Retail |
$RLX |
2,777.64 |
+23.64 |
+0.86% |
+0.86% |
| Gold & Silver |
$XAU |
124.19 |
+3.33 |
+2.76% |
+2.76% |
| Bank |
$BKX |
101.46 |
+0.61 |
+0.61% |
+0.61% |
| Biotech |
$BTK |
5,253.58 |
-27.52 |
-0.52% |
-0.52% |
|
|
|
 |
Consolidating Above 50-Day Moving Average Line and Prior High
Kenneth J. Gruneisen - Passed the CAN SLIM® Master's Exam
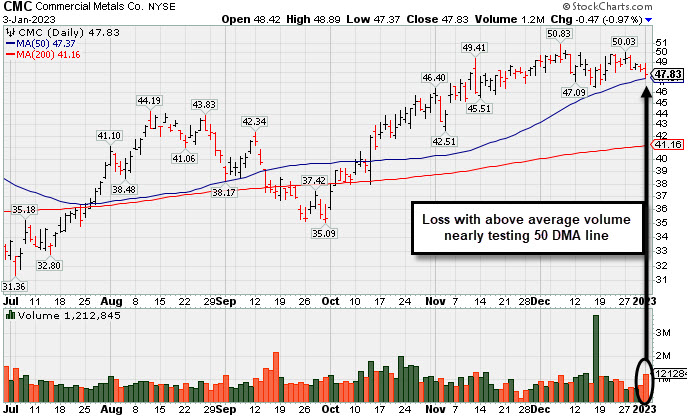
Commercial Metals Co (CMC-$0.47 or -0.97% to $47.83) suffered a loss today while volume was +23% above average. It pulled back to just above its 50-day moving average (DMA) line ($47.38) and prior highs in the $46 area defining important near-term support to watch. Fundamentals remain strong.
CMC has a highest possible 99 Earnings Per Share Rating. It reported Aug '22 quarterly earnings +94% on +19% sales revenues versus the year ago period and prior quarterly comparisons were well above the +25% minimum earnings guideline (C criteria) of the fact-based investment system. Annual earnings growth has been strong. It hails from the Metal Proc & Fabrication group which is currently ranked 25th on the 197 Industry Groups list (L criteria).
CMC was highlighted in yellow with pivot point cited based on its 8/11/22 high plus 10 cents in the 10/14/22 mid-day report (read here). It was last shown in this FSU section on 12/02/22 with an annotated graph under the headline, "Wedging Higher With Recent Gains Lacking Great Volume".
The company has 117.3 million shares outstanding (S criteria). The number of top-rated funds owning its shares rose from 586 in Dec '21 to 631 in Sep '22. Its current Up/Down Volume Ratio of 2.1 is an unbiased indication its shares have been under accumulation over the past 50 days. It has a Timeliness Rating of A and a Sponsorship Rating of B.
|
|
|
Color Codes Explained :
Y - Better candidates highlighted by our
staff of experts.
G - Previously featured
in past reports as yellow but may no longer be buyable under the
guidelines.
***Last / Change / Volume data in this table is the closing quote data***
Symbol/Exchange
Company Name
Industry Group |
PRICE |
CHANGE
(%Change) |
Day High |
Volume
(% DAV)
(% 50 day avg vol) |
52 Wk Hi
% From Hi |
Featured
Date |
Price
Featured |
Pivot Featured |
|
Max Buy |
 CMC
-
NYSE
CMC
-
NYSE
Commercial Metals Co
METALS and MINING - Steel and Iron
|
$47.83
|
-0.47
-0.97% |
$48.89
|
1,212,842
123.01% of 50 DAV
50 DAV is 986,000
|
$50.83
-5.90%
|
10/14/2022
|
$41.61
|
PP = $44.45
|
|
MB = $46.67
|
 Most Recent Note - 1/3/2023 5:13:17 PM
G - Volume was +23% above average behind today's loss while consolidating just above its 50 DMA line ($47.38) and prior highs in the $46 area defining important near-term support to watch. Fundamentals remain strong.
>>> FEATURED STOCK ARTICLE : Consolidating Above 50-Day Moving Average Line and Prior High - 1/3/2023 |
View all notes |
Set NEW NOTE alert |
Company Profile |
SEC
News |
Chart |
Request a new note
C
A
S
I |
GPK
-
NYSE
Graphic Packaging Hldg
CONSUMER NON-DURABLES - Packaging and Containers
|
$21.73
|
-0.52
-2.34% |
$22.34
|
3,319,702
107.16% of 50 DAV
50 DAV is 3,098,000
|
$24.07
-9.72%
|
10/25/2022
|
$22.75
|
PP = $24.17
|
|
MB = $25.38
|
Most Recent Note - 1/3/2023 5:18:14 PM
G - Slumped near its 200 DMA line ($21.61) with today's loss on higher (near average) volume. Recently met resistance near its 50 DMA line ($22.36). Faces resistance due to overhead supply up to the $24 level. Fundamentals remain strong.
>>> FEATURED STOCK ARTICLE : Violated 50-Day Moving Average After Recently Failing to Break Out - 12/15/2022 |
View all notes |
Set NEW NOTE alert |
Company Profile |
SEC
News |
Chart |
Request a new note
C
A
S
I |
HRMY
-
NASDAQ
Harmony Biosciences Holdings
Medical-Biomed/Biotech
|
$52.96
|
-2.14
-3.88% |
$55.60
|
343,410
76.21% of 50 DAV
50 DAV is 450,600
|
$62.09
-14.70%
|
11/1/2022
|
$55.31
|
PP = $57.23
|
|
MB = $60.09
|
Most Recent Note - 1/3/2023 5:11:36 PM
Slumped further below its 50 DMA line today, sinking below the 12/28/22 low ($53.79) raising more serious concerns and triggering a worrisome technical sell signal. It will be dropped from the Featured Stocks list tonight.
>>> FEATURED STOCK ARTICLE : Finding Support Near Prior Highs and 50-Day Moving Average Line - 12/23/2022 |
View all notes |
Set NEW NOTE alert |
Company Profile |
SEC
News |
Chart |
Request a new note
C
A
S
I |
GFF
-
NYSE
Griffon Corporation
MATERIALS and CONSTRUCTION - General Building Materials
|
$36.01
|
+0.22
0.61% |
$36.95
|
533,318
125.49% of 50 DAV
50 DAV is 425,000
|
$37.69
-4.46%
|
11/10/2022
|
$34.13
|
PP = $35.02
|
|
MB = $36.77
|
Most Recent Note - 1/3/2023 5:16:19 PM
Y - Posted another small gain with above average volume yet it remains below its "max buy" level. Found support near prior highs in the $34 area and above its 50 DMA line ($34.23). Reported Sep '22 quarterly earnings +230% on +24% sales revenues versus the year ago period.
>>> FEATURED STOCK ARTICLE : No Meaningful Progress After Breakout 3 Weeks Ago - 12/7/2022 |
View all notes |
Set NEW NOTE alert |
Company Profile |
SEC
News |
Chart |
Request a new note
C
A
S
I |
CPRX
-
NASDAQ
Catalyst Pharma Inc
Medical-Biomed/Biotech
|
$18.06
|
-0.54
-2.90% |
$18.89
|
1,898,640
79.81% of 50 DAV
50 DAV is 2,379,000
|
$19.78
-8.70%
|
11/22/2022
|
$17.38
|
PP = $16.66
|
|
MB = $17.49
|
Most Recent Note - 1/3/2023 5:14:03 PM
G - Still quietly consolidating above its "max buy" level. Found prompt support near the prior high and well above its 50 DMA line ($16.21).
>>> FEATURED STOCK ARTICLE : Powerful Rally to New High for Catalyst - 12/20/2022 |
View all notes |
Set NEW NOTE alert |
Company Profile |
SEC
News |
Chart |
Request a new note
C
A
S
I |
Symbol/Exchange
Company Name
Industry Group |
PRICE |
CHANGE
(%Change) |
Day High |
Volume
(% DAV)
(% 50 day avg vol) |
52 Wk Hi
% From Hi |
Featured
Date |
Price
Featured |
Pivot Featured |
|
Max Buy |
TITN
-
NASDAQ
Titan Machinery Inc
SPECIALTY RETAIL
|
$39.60
|
-0.13
-0.33% |
$40.82
|
273,095
127.61% of 50 DAV
50 DAV is 214,000
|
$44.35
-10.71%
|
11/30/2022
|
$40.10
|
PP = $38.68
|
|
MB = $40.61
|
Most Recent Note - 1/3/2023 12:46:18 PM
Y - Found support when recently consolidating near the prior high in the $38 area which defines initial support to watch above its 50 DMA line ($36.89). Fundamentals remain strong after reporting Oct '22 quarterly earnings +91% on +47% sales revenues.
>>> FEATURED STOCK ARTICLE : Found Support Near Prior High Following Breakout - 12/30/2022 |
View all notes |
Set NEW NOTE alert |
Company Profile |
SEC
News |
Chart |
Request a new note
C
A
S
I |
MYE
-
NYSE
Myers Industries Inc
Containers/Packaging
|
$22.45
|
+0.22
0.99% |
$22.80
|
130,059
77.42% of 50 DAV
50 DAV is 168,000
|
$25.55
-12.13%
|
12/8/2022
|
$23.94
|
PP = $25.65
|
|
MB = $26.93
|
Most Recent Note - 1/3/2023 5:19:45 PM
Y - Volume totals have been cooling while consolidating above its 50 DMA line ($21.85). Still faces resistance due to overhead supply up to the $25.50 level. Disciplined investors will note that it has failed thus far to produce the gains above the pivot point backed by at least +40% above average volume necessary to trigger a technical buy signal.
>>> FEATURED STOCK ARTICLE : Myers Industries on Track for 9th Straight Weekly Gain - 12/8/2022 |
View all notes |
Set NEW NOTE alert |
Company Profile |
SEC
News |
Chart |
Request a new note
C
A
S
I |
BOX
-
NYSE
Box Inc Cl A
Computer Sftwr-Database
|
$31.31
|
+0.18
0.58% |
$31.98
|
1,741,382
154.93% of 50 DAV
50 DAV is 1,124,000
|
$33.04
-5.24%
|
12/12/2022
|
$29.83
|
PP = $29.57
|
|
MB = $31.05
|
Most Recent Note - 1/3/2023 12:21:44 PM
G - Erased much of the session's early gain, still consolidating in a tight range near its "max buy" level. Faces little very resistance due to overhead supply up to the $33 level. Quarterly and annual earnings increases have been strong and steady.
>>> FEATURED STOCK ARTICLE : Volume Heavy Behind Breakout for Box Inc - 12/12/2022 |
View all notes |
Set NEW NOTE alert |
Company Profile |
SEC
News |
Chart |
Request a new note
C
A
S
I |
STRL
-
NASDAQ
Sterling Infrastructure
MATERIALS and; CONSTRUCTION - Heavy Construction
|
$33.45
|
+0.65
1.98% |
$34.86
|
670,456
342.07% of 50 DAV
50 DAV is 196,000
|
$33.62
-0.51%
|
12/14/2022
|
$32.41
|
PP = $33.72
|
|
MB = $35.41
|
Most Recent Note - 1/3/2023 5:21:34 PM
Y - Finished the session in the bottom third of its intra-day range after hitting a new 52-week high with a gain backed by +241% above average volume. Highlighted in yellow with pivot point cited based on its 11/08/22 high plus 10 cents in the 12/14/22 mid-day report. Faces no resistance due to overhead supply. Prior mid-day reports noted - "Subsequent gains above the pivot point backed by at least +40% above average volume are needed to trigger a proper technical buy signal." New buying efforts are discouraged in all stocks while the market is in a correction. Disciplined investors will watch for a new confirmed uptrend with follow-through day to be noted.
>>> FEATURED STOCK ARTICLE : Sterling Infrastructure Forming Orderly Base Pattern - 12/14/2022 |
View all notes |
Set NEW NOTE alert |
Company Profile |
SEC
News |
Chart |
Request a new note
C
A
S
I |
|
|
|
THESE ARE NOT BUY RECOMMENDATIONS!
Comments contained in the body of this report are technical
opinions only. The material herein has been obtained
from sources believed to be reliable and accurate, however,
its accuracy and completeness cannot be guaranteed.
This site is not an investment advisor, hence it does
not endorse or recommend any securities or other investments.
Any recommendation contained in this report may not
be suitable for all investors and it is not to be deemed
an offer or solicitation on our part with respect to
the purchase or sale of any securities. All trademarks,
service marks and trade names appearing in this report
are the property of their respective owners, and are
likewise used for identification purposes only.
This report is a service available
only to active Paid Premium Members.
You may opt-out of receiving report notifications
at any time. Questions or comments may be submitted
by writing to Premium Membership Services 665 S.E. 10 Street, Suite 201 Deerfield Beach, FL 33441-5634 or by calling 1-800-965-8307
or 954-785-1121.
|
|
|