You are not logged in.
This means you
CAN ONLY VIEW reports that were published prior to Thursday, April 10, 2025.
You
MUST UPGRADE YOUR MEMBERSHIP if you want to see any current reports.
AFTER MARKET UPDATE - TUESDAY, JANUARY 10TH, 2023
Previous After Market Report Next After Market Report >>>
|
|
|
|
DOW |
+186.45 |
33,704.10 |
+0.56% |
|
Volume |
788,335,718 |
-15% |
|
Volume |
4,652,620,800 |
-9% |
|
NASDAQ |
+106.98 |
10,742.63 |
+1.01% |
|
Advancers |
2,135 |
72% |
|
Advancers |
3,119 |
69% |
|
S&P 500 |
+27.16 |
3,919.25 |
+0.70% |
|
Decliners |
844 |
28% |
|
Decliners |
1,392 |
31% |
|
Russell 2000 |
+3.11 |
1,795.91 |
+0.17% |
|
52 Wk Highs |
61 |
|
|
52 Wk Highs |
102 |
|
|
S&P 600 |
+15.23 |
1,201.19 |
+1.28% |
|
52 Wk Lows |
6 |
|
|
52 Wk Lows |
39 |
|
|
The market is in a correction (M criteria). Disciplined investors know to avoid new buying, reduce exposure and raise cash until a new confirmed rally with a solid follow-through day is noted.
|
 |
Major Indices Rose With Lighter Volume and Less Leadership
Kenneth J. Gruneisen - Passed the CAN SLIM® Master's Exam
The Dow added 186 points, while the Nasdaq Composite climbed 1%. The S&P 500 advanced 0.7%. Volume totals were lighter than the prior session on the NYSE and on the Nasdaq exchange. Advancers led decliners by a 3-2 margin on the NYSE and on the Nasdaq exchange. There were 16 high-ranked companies from the Leaders List that hit new 52-week highs and were listed on the BreakOuts Page versus the total of 25 on the prior session. New 52-week highs totals also contracted yet still outnumbered new 52-week lows on the NYSE and on the Nasdaq exchange. The market is in a correction (M criteria). Disciplined investors know to avoid new buying, reduce exposure and raise cash until a new confirmed rally with a solid follow-through day is noted.
Chart courtesy of www.stockcharts.com PICTURED: The S&P 500 Index is consolidating near its 50-day moving average line and remains below its 200 DMA line.
10 of 11 sectors finished in positive territory as U.S. equities rose on Tuesday while investors looked towards this week’s Consumer Price Index (CPI) report and anticipated the beginning of fourth-quarter earnings season. Market participants are also digesting the latest commentary from Federal Reserve (Fed) officials. This morning, Fed Chairman Jerome Powell highlighted the need for the central bank to remain apolitical amid its efforts to curb inflation. He did not provide any clues as to the monetary policy outlook in his statement but indicated some of the measures they need to put in place may not be popular. Fed Governor Michelle Bowman said she sees more interest rate hikes in the near future and reiterated her commitment to bringing inflation down.
On the data front, the NFIB Small Business Optimism Index declined in December to its second-weakest print since 2013. Elsewhere, a final update on November wholesale inventories remained unchanged, notching a 1% monthly gain. Treasuries weakened, with the yield on the benchmark 10-year note up eight basis points (0.08%) to 3.61%, while the 30-year bond yield climbed nine basis points (0.09%) to 3.74%. The yield on the more Fed-sensitive two-year note advanced four basis points (0.04%) to 4.24%. In commodities, West Texas Intermediate (WTI) crude gained 0.5% to $75.03/barrel as investors await Thursday’s inflation data.
|
 Kenneth J. Gruneisen started out as a licensed stockbroker in August 1987, a couple of months prior to the historic stock market crash that took the Dow Jones Industrial Average down -22.6% in a single day. He has published daily fact-based fundamental and technical analysis on high-ranked stocks online for two decades. Through FACTBASEDINVESTING.COM, Kenneth provides educational articles, news, market commentary, and other information regarding proven investment systems that work in good times and bad.
Comments contained in the body of this report are technical opinions only and are not necessarily those of Gruneisen Growth Corp. The material herein has been obtained from sources believed to be reliable and accurate, however, its accuracy and completeness cannot be guaranteed. Our firm, employees, and customers may effect transactions, including transactions contrary to any recommendation herein, or have positions in the securities mentioned herein or options with respect thereto. Any recommendation contained in this report may not be suitable for all investors and it is not to be deemed an offer or solicitation on our part with respect to the purchase or sale of any securities. |
|
 |
Retail, Financial, Tech, and Commodity-Linked Groups Rose
Kenneth J. Gruneisen - Passed the CAN SLIM® Master's Exam
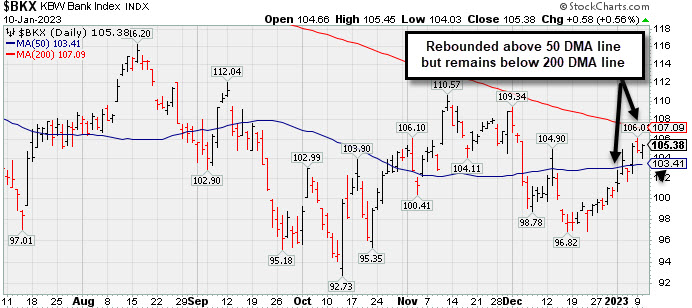
The Retail Index ($RLX +1.74%) posted an influential gain and the Broker/Dealer Index ($XBD +0.80%) and Bank Index ($BKX +0.56%) both edged higher. The Biotech Index ($BTK +2.21%) led the tech sector higher while the Semiconductor Index ($SOX +1.29%) also posted a solid gain and the Networking Index ($NWX +0.37%) edged higher. The Gold & Silver Index ($XAU +2.00%), Oil Services Index ($OSX +1.56%), and Integrated Oil Index ($XOI +0.53%) each posted gains.
PICTURED: The Bank Index ($BKX +0.56%) is consolidating above its 50-day moving average (DMA) line but remains below its 200 DMA line.
| Oil Services |
$OSX |
88.29 |
+1.35 |
+1.56% |
+5.28% |
| Integrated Oil |
$XOI |
1,790.76 |
+9.40 |
+0.53% |
+0.20% |
| Semiconductor |
$SOX |
2,721.29 |
+34.54 |
+1.29% |
+7.47% |
| Networking |
$NWX |
804.57 |
+2.93 |
+0.37% |
+2.71% |
| Broker/Dealer |
$XBD |
470.48 |
+3.75 |
+0.80% |
+4.75% |
| Retail |
$RLX |
2,866.57 |
+48.93 |
+1.74% |
+4.09% |
| Gold & Silver |
$XAU |
133.95 |
+2.62 |
+2.00% |
+10.83% |
| Bank |
$BKX |
105.38 |
+0.58 |
+0.56% |
+4.50% |
| Biotech |
$BTK |
5,449.69 |
+117.66 |
+2.21% |
+3.19% |
|
|
|
 |
Found Support at 200-Day Moving Average and Still Faces Resistance
Kenneth J. Gruneisen - Passed the CAN SLIM® Master's Exam
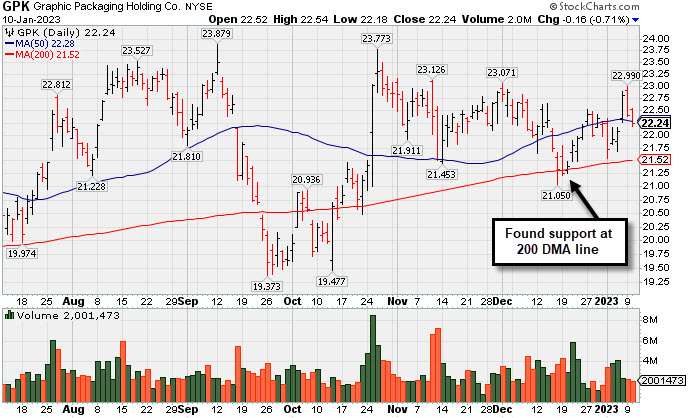
Graphic Packaging Hldg (GPK -$0.16 or -0.71% to $22.24) is consolidating near its 50-day moving average (DMA) line ($22.35) after recently finding support at its 200 DMA line ($21.67). More damaging losses may raise concerns. It faces some resistance due to overhead supply up to the $24 level. Fundamentals remain strong.
GPK was highlighted in yellow with pivot point cited based on its 9/12/22 high plus 10 cents in the 10/25/22 mid-day report (read here). GPK has a 98 Earnings Per Share Rating. It reported Sep '22 quarterly earnings +79% on +38% sales revenues versus the year ago period. It was last shown in this FSU section on 12/15/22 with an annotated graph under the headline, "Violated 50-Day Moving Average After Recently Failing to Break Out". The past 3 quarterly comparisons were well above the +25% minimum earnings guideline (C criteria). Its annual earnings history has been good, meeting the fact-based investment system's fundamental guidelines (A criteria).
The Paper & Paper Products group is ranked 117th on the 197 Industry Groups list and it has a C (41) Group Relative Strength Rating (L criteria). The number of top-rated funds owning its shares rose from 596 in Sep '21 to 697 in Dec '22, a reassuring sign concerning the I criteria. Its current Up/Down Volume Ratio of 1.0 is an unbiased indication its shares have been neutral concerning accumulation/distributional pressure over the past 50 days.
|
|
|
Color Codes Explained :
Y - Better candidates highlighted by our
staff of experts.
G - Previously featured
in past reports as yellow but may no longer be buyable under the
guidelines.
***Last / Change / Volume data in this table is the closing quote data***
Symbol/Exchange
Company Name
Industry Group |
PRICE |
CHANGE
(%Change) |
Day High |
Volume
(% DAV)
(% 50 day avg vol) |
52 Wk Hi
% From Hi |
Featured
Date |
Price
Featured |
Pivot Featured |
|
Max Buy |
 CMC
-
NYSE
CMC
-
NYSE
Commercial Metals Co
METALS and MINING - Steel and Iron
|
$53.27
|
+2.94
5.84% |
$53.29
|
1,370,018
143.46% of 50 DAV
50 DAV is 955,000
|
$52.27
1.91%
|
10/14/2022
|
$41.61
|
PP = $44.45
|
|
MB = $46.67
|
 Most Recent Note - 1/10/2023 1:32:33 PM
G - Hitting another new 52-week high with today's big gain. Its 50 DMA line ($47.97) and prior low in the $46.50 area define important near-term support to watch on pullbacks. Fundamentals remain strong.
>>> FEATURED STOCK ARTICLE : Consolidating Above 50-Day Moving Average Line and Prior High - 1/3/2023 |
View all notes |
Set NEW NOTE alert |
Company Profile |
SEC
News |
Chart |
Request a new note
C
A
S
I |
GPK
-
NYSE
Graphic Packaging Hldg
CONSUMER NON-DURABLES - Packaging and Containers
|
$22.24
|
-0.16
-0.71% |
$22.54
|
2,001,473
68.31% of 50 DAV
50 DAV is 2,930,000
|
$24.07
-7.60%
|
10/25/2022
|
$22.75
|
PP = $24.17
|
|
MB = $25.38
|
Most Recent Note - 1/10/2023 4:56:18 PM
Y - Consolidating near its 50 DMA line ($22.35) after recently finding support at its 200 DMA line ($21.67). More damaging losses may raise concerns. Faces some resistance due to overhead supply up to the $24 level. Fundamentals remain strong. See the latest FSU analysis for more details and a new annotated graph.
>>> FEATURED STOCK ARTICLE : Found Support at 200-Day Moving Average and Still Faces Resistance - 1/10/2023 |
View all notes |
Set NEW NOTE alert |
Company Profile |
SEC
News |
Chart |
Request a new note
C
A
S
I |
GFF
-
NYSE
Griffon Corporation
MATERIALS and CONSTRUCTION - General Building Materials
|
$39.32
|
+0.57
1.47% |
$39.41
|
523,081
114.96% of 50 DAV
50 DAV is 455,000
|
$39.59
-0.68%
|
11/10/2022
|
$34.13
|
PP = $35.02
|
|
MB = $36.77
|
Most Recent Note - 1/9/2023 1:25:35 PM
G - Hitting a new high and rising above its "max buy" level with today's big volume-driven gain and its color code is changed to green. Its 50 DMA line ($34.61) defines near-term support above recent lows in the $33.82 area. Reported Sep '22 quarterly earnings +230% on +24% sales revenues versus the year ago period.
>>> FEATURED STOCK ARTICLE : Rose Above Max Buy Level With 4th Consecutive Gain - 1/4/2023 |
View all notes |
Set NEW NOTE alert |
Company Profile |
SEC
News |
Chart |
Request a new note
C
A
S
I |
CPRX
-
NASDAQ
Catalyst Pharma Inc
Medical-Biomed/Biotech
|
$19.73
|
+0.71
3.73% |
$19.74
|
1,793,409
74.23% of 50 DAV
50 DAV is 2,416,000
|
$20.51
-3.80%
|
11/22/2022
|
$17.38
|
PP = $16.66
|
|
MB = $17.49
|
Most Recent Note - 1/9/2023 7:39:06 PM
G - After hitting a new 52-week high on the prior session it ended near the session low with a big loss today. Its 50 DMA line ($16.61) defines near-term support to watch on pullbacks..
>>> FEATURED STOCK ARTICLE : Powerful Rally to New High for Catalyst - 12/20/2022 |
View all notes |
Set NEW NOTE alert |
Company Profile |
SEC
News |
Chart |
Request a new note
C
A
S
I |
TITN
-
NASDAQ
Titan Machinery Inc
SPECIALTY RETAIL
|
$42.52
|
+1.42
3.45% |
$42.85
|
210,761
92.85% of 50 DAV
50 DAV is 227,000
|
$44.35
-4.13%
|
11/30/2022
|
$40.10
|
PP = $38.68
|
|
MB = $40.61
|
Most Recent Note - 1/10/2023 1:35:28 PM
G - Color code is changed to green while rising back above its "max buy" level. Found support when recently consolidating near the prior high in the $38 area which defines initial support to watch above its 50 DMA line ($37.70). Fundamentals remain strong.
>>> FEATURED STOCK ARTICLE : Found Support Near Prior High Following Breakout - 12/30/2022 |
View all notes |
Set NEW NOTE alert |
Company Profile |
SEC
News |
Chart |
Request a new note
C
A
S
I |
Symbol/Exchange
Company Name
Industry Group |
PRICE |
CHANGE
(%Change) |
Day High |
Volume
(% DAV)
(% 50 day avg vol) |
52 Wk Hi
% From Hi |
Featured
Date |
Price
Featured |
Pivot Featured |
|
Max Buy |
MYE
-
NYSE
Myers Industries Inc
Containers/Packaging
|
$23.73
|
+0.40
1.71% |
$23.83
|
122,880
71.44% of 50 DAV
50 DAV is 172,000
|
$25.55
-7.12%
|
12/8/2022
|
$23.94
|
PP = $25.65
|
|
MB = $26.93
|
Most Recent Note - 1/9/2023 7:40:02 PM
Y - Posted a 2nd consecutive gain today with below average volume after testing its 50 DMA line ($22.24) last week. More damaging losses would trigger a technical sell signal. Still faces resistance due to overhead supply up to the $25.50 level.
>>> FEATURED STOCK ARTICLE : Pullback Testing 50-Day Moving Average Line - 1/5/2023 |
View all notes |
Set NEW NOTE alert |
Company Profile |
SEC
News |
Chart |
Request a new note
C
A
S
I |
BOX
-
NYSE
Box Inc Cl A
Computer Sftwr-Database
|
$27.96
|
-1.88
-6.30% |
$28.72
|
3,497,788
293.19% of 50 DAV
50 DAV is 1,193,000
|
$33.04
-15.38%
|
12/12/2022
|
$29.83
|
PP = $29.57
|
|
MB = $31.05
|
Most Recent Note - 1/10/2023 1:30:19 PM
G - Gapped down today violating its 50 DMA line ($29.20) triggering a technical sell signal and its color code is changed to green. Only a prompt rebound above the 50 DMA line would help its outlook improve Quarterly and annual earnings increases have been strong and steady.
>>> FEATURED STOCK ARTICLE : Pulled Back After Perched Near All-Time High - 1/6/2023 |
View all notes |
Set NEW NOTE alert |
Company Profile |
SEC
News |
Chart |
Request a new note
C
A
S
I |
STRL
-
NASDAQ
Sterling Infrastructure
MATERIALS and; CONSTRUCTION - Heavy Construction
|
$32.92
|
+0.73
2.27% |
$32.98
|
160,124
73.45% of 50 DAV
50 DAV is 218,000
|
$34.86
-5.57%
|
12/14/2022
|
$32.41
|
PP = $33.72
|
|
MB = $35.41
|
Most Recent Note - 1/9/2023 7:37:29 PM
Y - Testing support at its 50 DMA line ($31.66) after its recent failed breakout attempt. Highlighted in yellow with pivot point cited based on its 11/08/22 high plus 10 cents in the 12/14/22 mid-day report. See the latest FSU analysis for more details and a new annotated graph. New buying efforts are discouraged in all stocks while the market is in a correction. Disciplined investors will watch for a new confirmed uptrend with follow-through day to be noted.
>>> FEATURED STOCK ARTICLE : Finding Support Near 50-Day Moving Average After Failed Breakout Attempt - 1/9/2023 |
View all notes |
Set NEW NOTE alert |
Company Profile |
SEC
News |
Chart |
Request a new note
C
A
S
I |
|
|
|
THESE ARE NOT BUY RECOMMENDATIONS!
Comments contained in the body of this report are technical
opinions only. The material herein has been obtained
from sources believed to be reliable and accurate, however,
its accuracy and completeness cannot be guaranteed.
This site is not an investment advisor, hence it does
not endorse or recommend any securities or other investments.
Any recommendation contained in this report may not
be suitable for all investors and it is not to be deemed
an offer or solicitation on our part with respect to
the purchase or sale of any securities. All trademarks,
service marks and trade names appearing in this report
are the property of their respective owners, and are
likewise used for identification purposes only.
This report is a service available
only to active Paid Premium Members.
You may opt-out of receiving report notifications
at any time. Questions or comments may be submitted
by writing to Premium Membership Services 665 S.E. 10 Street, Suite 201 Deerfield Beach, FL 33441-5634 or by calling 1-800-965-8307
or 954-785-1121.
|
|
|