You are not logged in.
This means you
CAN ONLY VIEW reports that were published prior to Tuesday, March 25, 2025.
You
MUST UPGRADE YOUR MEMBERSHIP if you want to see any current reports.
AFTER MARKET UPDATE - FRIDAY, JANUARY 13TH, 2023
Previous After Market Report Next After Market Report >>>
|
|
|
|
DOW |
+112.64 |
34,302.61 |
+0.33% |
|
Volume |
784,071,220 |
-10% |
|
Volume |
5,017,537,100 |
-11% |
|
NASDAQ |
+78.05 |
11,079.16 |
+0.71% |
|
Advancers |
1,867 |
62% |
|
Advancers |
2,824 |
62% |
|
S&P 500 |
+15.92 |
3,999.09 |
+0.40% |
|
Decliners |
1,127 |
38% |
|
Decliners |
1,710 |
38% |
|
Russell 2000 |
+10.97 |
1,887.03 |
+0.58% |
|
52 Wk Highs |
104 |
|
|
52 Wk Highs |
127 |
|
|
S&P 600 |
+6.95 |
1,238.88 |
+0.56% |
|
52 Wk Lows |
6 |
|
|
52 Wk Lows |
20 |
|
|
The solid gain from the Nasdaq Composite Index on Wednesday was marked by higher volume and an expansion in the new highs list. This was a follow-through day that confirmed a new market uptrend (M criteria).
|
 |
Major Indices Posted More Constructive Gains
Kenneth J. Gruneisen - Passed the CAN SLIM® Master's Exam
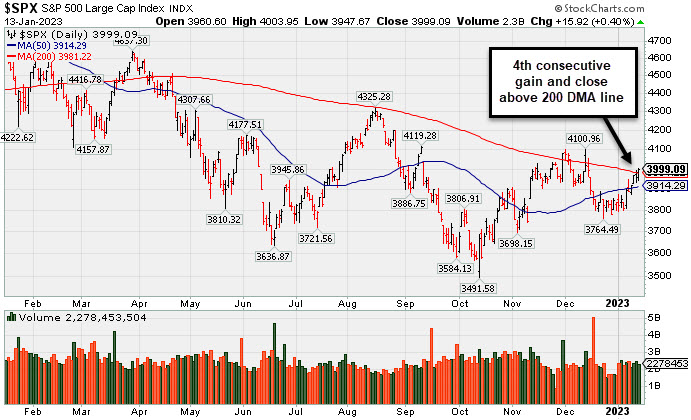
The S&P 500 added 0.4%, while the Nasdaq Composite climbed 0.7%. Both indexes posted their best weekly performance since November (climbing 2.7% and 4.8%, respectively). The Dow advanced 112 points and notched a 2% weekly gain. Volume totals were lighter than the prior session on the NYSE and on the Nasdaq exchange. Advancers led decliners by a 3-2 margin on the NYSE and on the Nasdaq exchange. There were 39 high-ranked companies from the Leaders List that hit new 52-week highs and were listed on the BreakOuts Page versus the total of 37 on the prior session. New 52-week highs totals solidly outnumbered shrinking new 52-week lows on the NYSE and on the Nasdaq exchange. The solid gains on Wednesday marked a follow-through day confirming a new uptrend for the major indices (M criteria).
PICTURED: The S&P 500 Index posted a 4th consecutive gain and closed above its 200-day moving average line.
U.S. equities reversed early losses to finish higher Friday as investors shook-off the impacts of this morning’s bank earnings. The first round of key earnings results highlighted the docket today with Wall Street’s biggest banks reporting. While investors found fourth-quarter earnings and revenue to be, for the most part, better than expected, each bank noted they are increasing the amount of money set aside for credit losses and indicated they believe the economy will slow in the coming months.
On the data front, the University of Michigan’s Consumer Sentiment Index came in better than expected in January. The report cited inflation showing continued signs of easing and the labor market remaining robust as key drivers behind the boost in sentiment. The short-term inflation expectations component of the report eased more than expected to come in at 4%, while long-term inflation expectations ticked up from 2.9% to 3%.
Treasuries weakened, with the yield on the benchmark 10-year note up eight basis points (0.08%) to 3.50%, while the 30-year bond yield climbed six basis points (0.06%) to 3.61%. The yield on the two-year note advanced 11 basis points (0.11%) to 4.23%. In commodities, West Texas Intermediate (WTI) crude added 2% to $79.98/barrel amid optimism over demand growth in China. The domestic benchmark climbed 8.4% this week, to see its best weekly performance since October. |
 Kenneth J. Gruneisen started out as a licensed stockbroker in August 1987, a couple of months prior to the historic stock market crash that took the Dow Jones Industrial Average down -22.6% in a single day. He has published daily fact-based fundamental and technical analysis on high-ranked stocks online for two decades. Through FACTBASEDINVESTING.COM, Kenneth provides educational articles, news, market commentary, and other information regarding proven investment systems that work in good times and bad.
Comments contained in the body of this report are technical opinions only and are not necessarily those of Gruneisen Growth Corp. The material herein has been obtained from sources believed to be reliable and accurate, however, its accuracy and completeness cannot be guaranteed. Our firm, employees, and customers may effect transactions, including transactions contrary to any recommendation herein, or have positions in the securities mentioned herein or options with respect thereto. Any recommendation contained in this report may not be suitable for all investors and it is not to be deemed an offer or solicitation on our part with respect to the purchase or sale of any securities. |
|
 |
Retail, Financial, Tech, and Commodity-Linked Groups Rose
Kenneth J. Gruneisen - Passed the CAN SLIM® Master's Exam
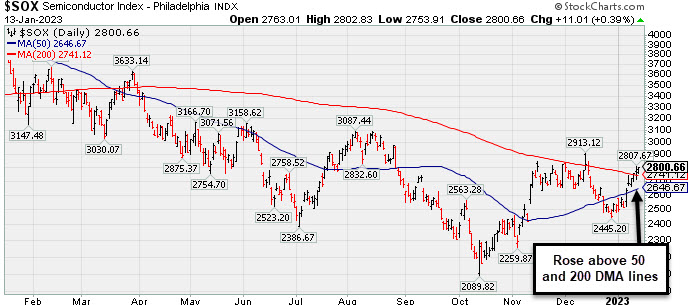
The Retail Index ($RLX +1.64%) posted an influential gain and the Broker/Dealer Index ($XBD +0.76%) and Bank Index ($BKX +0.70%) both posted smaller gains on Friday. The tech sector had a slightly positive bias as the Semiconductor Index ($SOX +0.39%), Networking Index ($NWX +0.40%), and Biotech Index ($BTK +0.32%) each edged higher. The Gold & Silver Index ($XAU +1.18%) and Oil Services Index ($OSX +1.04%) both posted solid gains and the Integrated Oil Index ($XOI +0.25%) also inched higher.
PICTURED: The Semiconductor Index ($SOX +0.39%) recently rose above its 50-day and 200-day moving average (DMA) lines.
| Oil Services |
$OSX |
91.60 |
+0.94 |
+1.04% |
+9.23% |
| Integrated Oil |
$XOI |
1,840.64 |
+4.59 |
+0.25% |
+2.99% |
| Semiconductor |
$SOX |
2,800.66 |
+11.01 |
+0.39% |
+10.61% |
| Networking |
$NWX |
816.08 |
+3.27 |
+0.40% |
+4.18% |
| Broker/Dealer |
$XBD |
481.21 |
+3.64 |
+0.76% |
+7.14% |
| Retail |
$RLX |
3,012.79 |
+48.58 |
+1.64% |
+9.40% |
| Gold & Silver |
$XAU |
136.70 |
+1.60 |
+1.18% |
+13.11% |
| Bank |
$BKX |
107.63 |
+0.74 |
+0.70% |
+6.72% |
| Biotech |
$BTK |
5,524.61 |
+17.67 |
+0.32% |
+4.61% |
|
|
|
 |
Forming New Base for Past 7 Weeks
Kenneth J. Gruneisen - Passed the CAN SLIM® Master's Exam
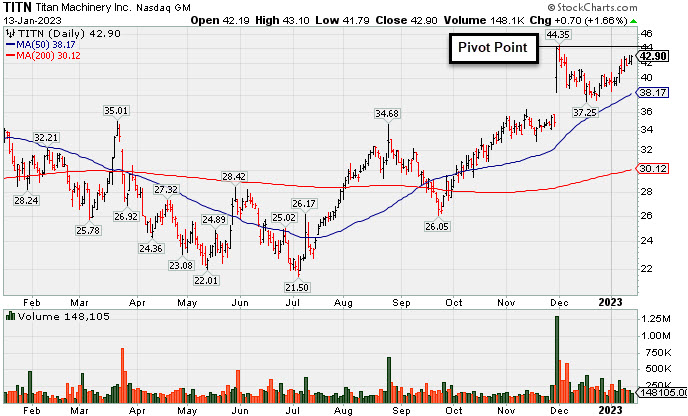
Titan Machinery Inc (TITN +$0.70 or +1.66% to $42.90) posted another gain with light volume. It found support when recently consolidating near the prior high in the $38 area which defines important support to watch along with its 50-day moving average (DMA) line ($38.17). Its color code has been changed to yellow with a new pivot point cited based on its 12/01/22 high plus 10 cents. Subsequent gains above the pivot point backed by at least +40% above average volume may trigger a new technical buy signal. A valid secondary buy point also may be considered up to 5% above the recent high since it found support at the 10-week moving average line.
Fundamentals remain strong after reporting Oct '22 quarterly earnings +91% on +47% sales revenues. It currently has the highest possible earnings Per Share Rating of 99. Following years of losses it has shown strong earnings growth for FY '19-22. TITN was highlighted in yellow with pivot point cited based on its 11/23/21 high plus 10 cents in the 11/30/22 mid-day report (read here). It was last shown in greater detail on 12/30/22 with an annotated graph under the headline, "Found Support Near Prior High Following Breakout".
The small supply of only 22.7 million shares outstanding (S criteria) can contribute to greater price volatility in the event of institutional buying or selling. The number of top-rated funds owning its shares rose from 241 in Dec '20 to 355 in Dec '22, a reassuring sign concerning the I criteria. Its current Up/Down Volume Ratio of 1.1 is an unbiased indication its shares have been under slight accumulation over the past 50 days.
|
|
|
Color Codes Explained :
Y - Better candidates highlighted by our
staff of experts.
G - Previously featured
in past reports as yellow but may no longer be buyable under the
guidelines.
***Last / Change / Volume data in this table is the closing quote data***
Symbol/Exchange
Company Name
Industry Group |
PRICE |
CHANGE
(%Change) |
Day High |
Volume
(% DAV)
(% 50 day avg vol) |
52 Wk Hi
% From Hi |
Featured
Date |
Price
Featured |
Pivot Featured |
|
Max Buy |
 CMC
-
NYSE
CMC
-
NYSE
Commercial Metals Co
METALS and MINING - Steel and Iron
|
$56.06
|
+0.18
0.32% |
$56.57
|
1,161,203
118.01% of 50 DAV
50 DAV is 984,000
|
$56.60
-0.95%
|
10/14/2022
|
$41.61
|
PP = $44.45
|
|
MB = $46.67
|
Most Recent Note - 1/11/2023 7:38:36 PM
G - Hit yet another new 52-week high with today's big gain. Its 50 DMA line ($48.22) and prior low in the $46.50 area define important near-term support to watch on pullbacks. Fundamentals remain strong.
>>> FEATURED STOCK ARTICLE : Consolidating Above 50-Day Moving Average Line and Prior High - 1/3/2023 |
View all notes |
Set NEW NOTE alert |
Company Profile |
SEC
News |
Chart |
Request a new note
C
A
S
I |
GPK
-
NYSE
Graphic Packaging Hldg
CONSUMER NON-DURABLES - Packaging and Containers
|
$22.43
|
-0.12
-0.53% |
$22.70
|
2,761,608
96.39% of 50 DAV
50 DAV is 2,865,100
|
$24.07
-6.81%
|
10/25/2022
|
$22.75
|
PP = $24.17
|
|
MB = $25.38
|
Most Recent Note - 1/10/2023 4:56:18 PM
Y - Consolidating near its 50 DMA line ($22.35) after recently finding support at its 200 DMA line ($21.67). More damaging losses may raise concerns. Faces some resistance due to overhead supply up to the $24 level. Fundamentals remain strong. See the latest FSU analysis for more details and a new annotated graph.
>>> FEATURED STOCK ARTICLE : Found Support at 200-Day Moving Average and Still Faces Resistance - 1/10/2023 |
View all notes |
Set NEW NOTE alert |
Company Profile |
SEC
News |
Chart |
Request a new note
C
A
S
I |
GFF
-
NYSE
Griffon Corporation
MATERIALS and CONSTRUCTION - General Building Materials
|
$39.57
|
+1.27
3.32% |
$39.82
|
750,576
161.76% of 50 DAV
50 DAV is 464,000
|
$39.77
-0.50%
|
11/10/2022
|
$34.13
|
PP = $35.02
|
|
MB = $36.77
|
 Most Recent Note - 1/13/2023 5:15:23 PM
G - Hit another new high with today's volume-driven gain. Its 50 DMA line ($35.14) defines near-term support above recent lows in the $33.82 area. Reported Sep '22 quarterly earnings +230% on +24% sales revenues versus the year ago period.
>>> FEATURED STOCK ARTICLE : Rose Above Max Buy Level With 4th Consecutive Gain - 1/4/2023 |
View all notes |
Set NEW NOTE alert |
Company Profile |
SEC
News |
Chart |
Request a new note
C
A
S
I |
CPRX
-
NASDAQ
Catalyst Pharma Inc
Medical-Biomed/Biotech
|
$21.05
|
+0.08
0.38% |
$22.11
|
2,753,704
111.44% of 50 DAV
50 DAV is 2,471,000
|
$21.15
-0.47%
|
11/22/2022
|
$17.38
|
PP = $16.66
|
|
MB = $17.49
|
Most Recent Note - 1/12/2023 8:30:29 PM
G - Hit another new 52-week high with today's 3rd consecutive gain. Its 50 DMA line ($16.98) defines near-term support to watch on pullbacks. See the latest FSU analysis for more details and an annotated graph.
>>> FEATURED STOCK ARTICLE : Making Gradual Progress Hitting Another New High - 1/11/2023 |
View all notes |
Set NEW NOTE alert |
Company Profile |
SEC
News |
Chart |
Request a new note
C
A
S
I |
TITN
-
NASDAQ
Titan Machinery Inc
SPECIALTY RETAIL
|
$42.90
|
+0.70
1.66% |
$43.10
|
148,105
64.11% of 50 DAV
50 DAV is 231,000
|
$44.35
-3.27%
|
1/13/2023
|
$40.10
|
PP = $44.45
|
|
MB = $46.67
|
Most Recent Note - 1/13/2023 5:14:11 PM
Y - Color code is changed to yellow with new pivot point cited based on its 12/01/22 high plus 10 cents. Found support when recently consolidating near the prior high in the $38 area which defines important support to watch along with its 50 DMA line ($38.17). See the latest FSU analysis for more details and a new annotated graph.
>>> FEATURED STOCK ARTICLE : Forming New Base for Past 7 Weeks - 1/13/2023 |
View all notes |
Set NEW NOTE alert |
Company Profile |
SEC
News |
Chart |
Request a new note
C
A
S
I |
Symbol/Exchange
Company Name
Industry Group |
PRICE |
CHANGE
(%Change) |
Day High |
Volume
(% DAV)
(% 50 day avg vol) |
52 Wk Hi
% From Hi |
Featured
Date |
Price
Featured |
Pivot Featured |
|
Max Buy |
MYE
-
NYSE
Myers Industries Inc
Containers/Packaging
|
$24.75
|
+0.42
1.73% |
$24.83
|
108,405
64.53% of 50 DAV
50 DAV is 168,000
|
$25.55
-3.13%
|
12/8/2022
|
$23.94
|
PP = $25.65
|
|
MB = $26.93
|
Most Recent Note - 1/13/2023 5:16:18 PM
Y - Posted a 6th consecutive gain today with below average volume after testing its 50 DMA line ($22.57) last week. Faces little resistance due to overhead supply up to the $25.50 level.
>>> FEATURED STOCK ARTICLE : Pullback Testing 50-Day Moving Average Line - 1/5/2023 |
View all notes |
Set NEW NOTE alert |
Company Profile |
SEC
News |
Chart |
Request a new note
C
A
S
I |
BOX
-
NYSE
Box Inc Cl A
Computer Sftwr-Database
|
$30.50
|
+0.83
2.80% |
$30.50
|
1,613,935
124.72% of 50 DAV
50 DAV is 1,294,000
|
$33.04
-7.69%
|
12/12/2022
|
$29.83
|
PP = $29.57
|
|
MB = $31.05
|
Most Recent Note - 1/13/2023 5:18:08 PM
Y - Rebounded further above the 50 DMA line ($29.25) with 3 consecutive gains helping its outlook improve. Still faces some resistance due to overhead supply up to the $32 level. Quarterly and annual earnings increases have been strong and steady.
>>> FEATURED STOCK ARTICLE : Pulled Back After Perched Near All-Time High - 1/6/2023 |
View all notes |
Set NEW NOTE alert |
Company Profile |
SEC
News |
Chart |
Request a new note
C
A
S
I |
STRL
-
NASDAQ
Sterling Infrastructure
MATERIALS and; CONSTRUCTION - Heavy Construction
|
$33.87
|
+0.70
2.11% |
$34.05
|
265,895
123.10% of 50 DAV
50 DAV is 216,000
|
$34.86
-2.84%
|
12/14/2022
|
$32.41
|
PP = $33.72
|
|
MB = $35.41
|
Most Recent Note - 1/13/2023 5:17:07 PM
Y - Found support at its 50 DMA line ($32.10) after its recent failed breakout attempt. Highlighted in yellow with pivot point cited based on its 11/08/22 high plus 10 cents in the 12/14/22 mid-day report.
>>> FEATURED STOCK ARTICLE : Finding Support Near 50-Day Moving Average After Failed Breakout Attempt - 1/9/2023 |
View all notes |
Set NEW NOTE alert |
Company Profile |
SEC
News |
Chart |
Request a new note
C
A
S
I |
|
|
|
THESE ARE NOT BUY RECOMMENDATIONS!
Comments contained in the body of this report are technical
opinions only. The material herein has been obtained
from sources believed to be reliable and accurate, however,
its accuracy and completeness cannot be guaranteed.
This site is not an investment advisor, hence it does
not endorse or recommend any securities or other investments.
Any recommendation contained in this report may not
be suitable for all investors and it is not to be deemed
an offer or solicitation on our part with respect to
the purchase or sale of any securities. All trademarks,
service marks and trade names appearing in this report
are the property of their respective owners, and are
likewise used for identification purposes only.
This report is a service available
only to active Paid Premium Members.
You may opt-out of receiving report notifications
at any time. Questions or comments may be submitted
by writing to Premium Membership Services 665 S.E. 10 Street, Suite 201 Deerfield Beach, FL 33441-5634 or by calling 1-800-965-8307
or 954-785-1121.
|
|
|