You are not logged in.
This means you
CAN ONLY VIEW reports that were published prior to Tuesday, March 25, 2025.
You
MUST UPGRADE YOUR MEMBERSHIP if you want to see any current reports.
AFTER MARKET UPDATE - WEDNESDAY, JANUARY 11TH, 2023
Previous After Market Report Next After Market Report >>>
|
|
|
|
DOW |
+268.91 |
33,973.01 |
+0.80% |
|
Volume |
866,631,855 |
+10% |
|
Volume |
5,297,665,000 |
+14% |
|
NASDAQ |
+189.04 |
10,931.67 |
+1.76% |
|
Advancers |
2,320 |
77% |
|
Advancers |
3,124 |
68% |
|
S&P 500 |
+50.36 |
3,969.61 |
+1.28% |
|
Decliners |
679 |
23% |
|
Decliners |
1,499 |
32% |
|
Russell 2000 |
+21.40 |
1,844.05 |
+1.17% |
|
52 Wk Highs |
81 |
|
|
52 Wk Highs |
131 |
|
|
S&P 600 |
+13.38 |
1,214.57 |
+1.11% |
|
52 Wk Lows |
5 |
|
|
52 Wk Lows |
31 |
|
|
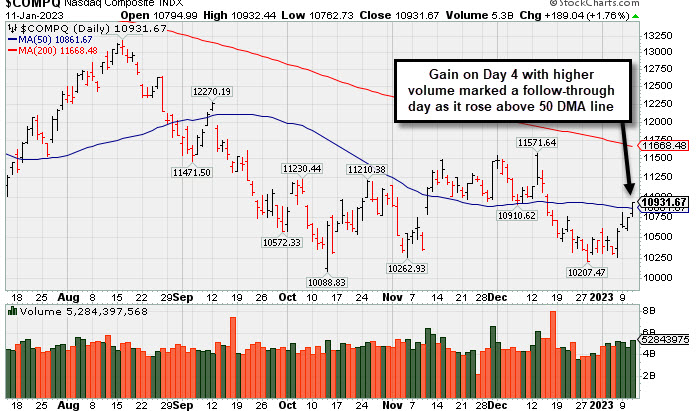
The solid gain from the Nasdaq Composite Index on Wednesday was marked by higher volume and an expansion in the new highs list. This was a follow-through day that confirmed a new market uptrend (M criteria).
|
 |
Nasdaq Composite Index Posted Solid Follow-Through Gain
Kenneth J. Gruneisen - Passed the CAN SLIM® Master's Exam
The Dow added 268 points, while the S&P 500 increased 1.3% with all sectors finishing in positive territory. The Nasdaq Composite gained 1.8% Volume totals were higher than the prior session on the NYSE and on the Nasdaq exchange. Advancers led decliners by more than a 3-1 margin on the NYSE and 2-1 on the Nasdaq exchange. There were 22 high-ranked companies from the Leaders List that hit new 52-week highs and were listed on the BreakOuts Page versus the total of 16 on the prior session. New 52-week highs totals expanded and outnumbered new 52-week lows on the NYSE and on the Nasdaq exchange. The solid gain marked a follow-through day confirming a new uptrend for the major indices (M criteria).
PICTURED: The Nasdaq Composite Index posted a solid gain with higher volume on Day 4 of the rally attempt as it rose above its 50-day moving average line.
U.S. equities rose during Wednesday’s trading session as investors bet on a cooler inflation reading ahead of tomorrow’s release of December’s Consumer Price Index (CPI). Analysts currently expect December’s headline (CPI) to ease to a 6.5% print from November’s 7.1%.
In the central bank space, Boston Federal (Fed) Reserve President Susan Collins announced she is leaning towards a smaller rate hike of 25 basis points (0.25%) ahead of the next meeting. She believes adjusting slowly will allow the Fed more time to assess the incoming data before they make their next decision.
Treasuries strengthened with the yield on the benchmark 10-year note declining eight basis points (0.08%) to 3.53%, while the 30-year bond yield dipped nine basis points (0.09%) to 3.65%. The yield on the two-year note, which is more sensitive to changes in Fed policy, decreased three basis points (0.03%) to 4.21%. In commodities, West Texas Intermediate (WTI) crude surged 3.3% to $77.59/barrel to close at its highest level since December 30 on hopes for an improved global economy. However, market participants are keeping a close eye on Thursday’s inflation data as this may have an impact on the strength of the U.S. dollar. A weaker dollar makes commodities cheaper and will boost oil demand for other currency holders. In the metals complex, Copper jumped 2.5%, climbing for its fifth straight day amid reports inflation may have peaked. |
 Kenneth J. Gruneisen started out as a licensed stockbroker in August 1987, a couple of months prior to the historic stock market crash that took the Dow Jones Industrial Average down -22.6% in a single day. He has published daily fact-based fundamental and technical analysis on high-ranked stocks online for two decades. Through FACTBASEDINVESTING.COM, Kenneth provides educational articles, news, market commentary, and other information regarding proven investment systems that work in good times and bad.
Comments contained in the body of this report are technical opinions only and are not necessarily those of Gruneisen Growth Corp. The material herein has been obtained from sources believed to be reliable and accurate, however, its accuracy and completeness cannot be guaranteed. Our firm, employees, and customers may effect transactions, including transactions contrary to any recommendation herein, or have positions in the securities mentioned herein or options with respect thereto. Any recommendation contained in this report may not be suitable for all investors and it is not to be deemed an offer or solicitation on our part with respect to the purchase or sale of any securities. |
|
 |
Retail Index Posted Standout Gain
Kenneth J. Gruneisen - Passed the CAN SLIM® Master's Exam
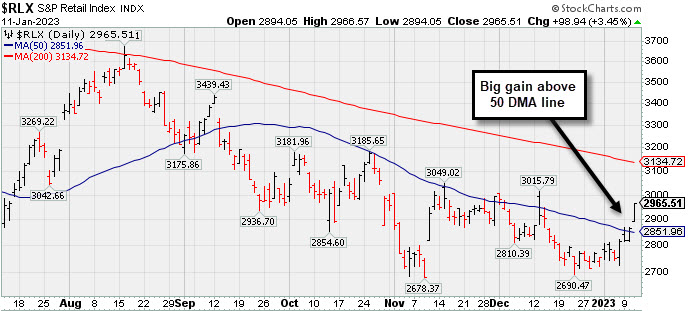
The Retail Index ($RLX +3.45%) posted an influential gain while the Bank Index ($BKX +0.88%) and Broker/Dealer Index ($XBD +0.36%) also rose. The Semiconductor Index ($SOX +1.25%) led the tech sector higher while the Networking Index ($NWX +0.42%) and Biotech Index ($BTK +0.37%) both posted smaller gains. The Oil Services Index ($OSX +0.20%) and Integrated Oil Index ($XOI +0.42%) both posted small gains while the Gold & Silver Index ($XAU -0.65%) edged lower.
PICTURED: The Retail Index ($RLX +3.45%) posted a solid gain, rebounding well above its 50-day moving average (DMA) line, but it remains below its 200 DMA line.
| Oil Services |
$OSX |
88.46 |
+0.17 |
+0.20% |
+5.49% |
| Integrated Oil |
$XOI |
1,798.22 |
+7.46 |
+0.42% |
+0.61% |
| Semiconductor |
$SOX |
2,755.36 |
+34.08 |
+1.25% |
+8.82% |
| Networking |
$NWX |
807.94 |
+3.37 |
+0.42% |
+3.14% |
| Broker/Dealer |
$XBD |
472.18 |
+1.70 |
+0.36% |
+5.13% |
| Retail |
$RLX |
2,965.51 |
+98.94 |
+3.45% |
+7.68% |
| Gold & Silver |
$XAU |
133.08 |
-0.88 |
-0.65% |
+10.11% |
| Bank |
$BKX |
106.31 |
+0.92 |
+0.88% |
+5.41% |
| Biotech |
$BTK |
5,469.92 |
+20.24 |
+0.37% |
+3.58% |
|
|
|
 |
Making Gradual Progress Hitting Another New High
Kenneth J. Gruneisen - Passed the CAN SLIM® Master's Exam
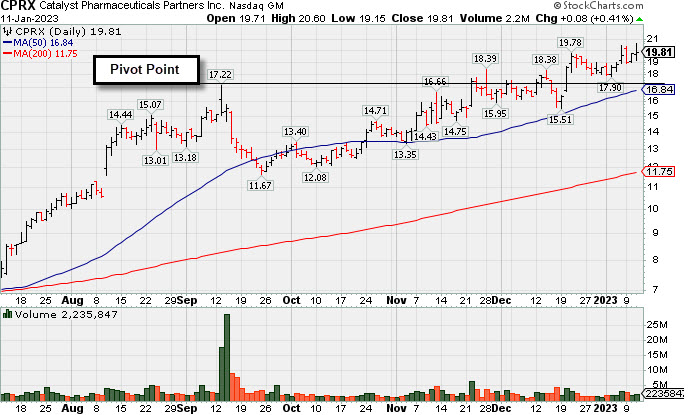
Catalyst Pharma Inc (CPRX +$0.08 or +0.41% to $19.81) touched a new 52-week high today Its 50-day moving average (DMA) line ($16.84) defines near-term support to watch on pullbacks..
CPRX finished strong after highlighted in yellow with new pivot point cited based on its 11/11/22 high in the 11/22/22 mid-day report (read here). It was shown in this FSU section on 12/20/22 with an annotated graph under the headline, "Powerful Rally to New High for Catalyst".
It has an Earnings Per Share rating of 99. Recently it reported Sep '22 quarterly earnings +86% on +59% sales revenues versus the year ago period, its 4th consecutive quarterly comparison above the +25% minimum earnings guideline (C criteria). Annual earnings (A criteria) growth has been strong since turning profitable in FY '19.
The Medical-Biomed/Biotech industry group is currently ranked 28th on the 197 Industry Groups list, a reassuring sign concerning the L criteria. It has only 88.5 million shares in the public float. The number of top-rated funds owning its shares rose from 311 in Sep '21 to 405 in Dec '22, a reassuring sign concerning the I criteria. Its current Up/Down Volume Ratio of 1.2 is an unbiased indication its shares have been under accumulation over the past 50 days.
|
|
|
Color Codes Explained :
Y - Better candidates highlighted by our
staff of experts.
G - Previously featured
in past reports as yellow but may no longer be buyable under the
guidelines.
***Last / Change / Volume data in this table is the closing quote data***
Symbol/Exchange
Company Name
Industry Group |
PRICE |
CHANGE
(%Change) |
Day High |
Volume
(% DAV)
(% 50 day avg vol) |
52 Wk Hi
% From Hi |
Featured
Date |
Price
Featured |
Pivot Featured |
|
Max Buy |
 CMC
-
NYSE
CMC
-
NYSE
Commercial Metals Co
METALS and MINING - Steel and Iron
|
$56.17
|
+2.90
5.44% |
$56.20
|
1,801,611
186.70% of 50 DAV
50 DAV is 965,000
|
$53.29
5.40%
|
10/14/2022
|
$41.61
|
PP = $44.45
|
|
MB = $46.67
|
 Most Recent Note - 1/11/2023 7:38:36 PM
G - Hit yet another new 52-week high with today's big gain. Its 50 DMA line ($48.22) and prior low in the $46.50 area define important near-term support to watch on pullbacks. Fundamentals remain strong.
>>> FEATURED STOCK ARTICLE : Consolidating Above 50-Day Moving Average Line and Prior High - 1/3/2023 |
View all notes |
Set NEW NOTE alert |
Company Profile |
SEC
News |
Chart |
Request a new note
C
A
S
I |
GPK
-
NYSE
Graphic Packaging Hldg
CONSUMER NON-DURABLES - Packaging and Containers
|
$22.05
|
-0.19
-0.85% |
$22.51
|
3,295,514
114.11% of 50 DAV
50 DAV is 2,888,000
|
$24.07
-8.39%
|
10/25/2022
|
$22.75
|
PP = $24.17
|
|
MB = $25.38
|
Most Recent Note - 1/10/2023 4:56:18 PM
Y - Consolidating near its 50 DMA line ($22.35) after recently finding support at its 200 DMA line ($21.67). More damaging losses may raise concerns. Faces some resistance due to overhead supply up to the $24 level. Fundamentals remain strong. See the latest FSU analysis for more details and a new annotated graph.
>>> FEATURED STOCK ARTICLE : Found Support at 200-Day Moving Average and Still Faces Resistance - 1/10/2023 |
View all notes |
Set NEW NOTE alert |
Company Profile |
SEC
News |
Chart |
Request a new note
C
A
S
I |
GFF
-
NYSE
Griffon Corporation
MATERIALS and CONSTRUCTION - General Building Materials
|
$38.80
|
-0.52
-1.32% |
$39.77
|
420,404
91.79% of 50 DAV
50 DAV is 458,000
|
$39.59
-2.00%
|
11/10/2022
|
$34.13
|
PP = $35.02
|
|
MB = $36.77
|
Most Recent Note - 1/9/2023 1:25:35 PM
G - Hitting a new high and rising above its "max buy" level with today's big volume-driven gain and its color code is changed to green. Its 50 DMA line ($34.61) defines near-term support above recent lows in the $33.82 area. Reported Sep '22 quarterly earnings +230% on +24% sales revenues versus the year ago period.
>>> FEATURED STOCK ARTICLE : Rose Above Max Buy Level With 4th Consecutive Gain - 1/4/2023 |
View all notes |
Set NEW NOTE alert |
Company Profile |
SEC
News |
Chart |
Request a new note
C
A
S
I |
CPRX
-
NASDAQ
Catalyst Pharma Inc
Medical-Biomed/Biotech
|
$19.81
|
+0.08
0.41% |
$20.60
|
2,236,075
92.17% of 50 DAV
50 DAV is 2,426,000
|
$20.51
-3.41%
|
11/22/2022
|
$17.38
|
PP = $16.66
|
|
MB = $17.49
|
Most Recent Note - 1/11/2023 7:51:49 PM
G - Hit another new 52-week high today. Its 50 DMA line ($16.84) defines near-term support to watch on pullbacks. See the latest FSU analysis for more details and a new annotated graph.
>>> FEATURED STOCK ARTICLE : Making Gradual Progress Hitting Another New High - 1/11/2023 |
View all notes |
Set NEW NOTE alert |
Company Profile |
SEC
News |
Chart |
Request a new note
C
A
S
I |
TITN
-
NASDAQ
Titan Machinery Inc
SPECIALTY RETAIL
|
$41.75
|
-0.77
-1.81% |
$42.63
|
182,032
79.84% of 50 DAV
50 DAV is 228,000
|
$44.35
-5.86%
|
11/30/2022
|
$40.10
|
PP = $38.68
|
|
MB = $40.61
|
Most Recent Note - 1/10/2023 1:35:28 PM
G - Color code is changed to green while rising back above its "max buy" level. Found support when recently consolidating near the prior high in the $38 area which defines initial support to watch above its 50 DMA line ($37.70). Fundamentals remain strong.
>>> FEATURED STOCK ARTICLE : Found Support Near Prior High Following Breakout - 12/30/2022 |
View all notes |
Set NEW NOTE alert |
Company Profile |
SEC
News |
Chart |
Request a new note
C
A
S
I |
Symbol/Exchange
Company Name
Industry Group |
PRICE |
CHANGE
(%Change) |
Day High |
Volume
(% DAV)
(% 50 day avg vol) |
52 Wk Hi
% From Hi |
Featured
Date |
Price
Featured |
Pivot Featured |
|
Max Buy |
MYE
-
NYSE
Myers Industries Inc
Containers/Packaging
|
$23.89
|
+0.16
0.67% |
$23.94
|
84,167
49.22% of 50 DAV
50 DAV is 171,000
|
$25.55
-6.50%
|
12/8/2022
|
$23.94
|
PP = $25.65
|
|
MB = $26.93
|
Most Recent Note - 1/9/2023 7:40:02 PM
Y - Posted a 2nd consecutive gain today with below average volume after testing its 50 DMA line ($22.24) last week. More damaging losses would trigger a technical sell signal. Still faces resistance due to overhead supply up to the $25.50 level.
>>> FEATURED STOCK ARTICLE : Pullback Testing 50-Day Moving Average Line - 1/5/2023 |
View all notes |
Set NEW NOTE alert |
Company Profile |
SEC
News |
Chart |
Request a new note
C
A
S
I |
BOX
-
NYSE
Box Inc Cl A
Computer Sftwr-Database
|
$28.71
|
+0.75
2.68% |
$28.86
|
2,360,161
188.44% of 50 DAV
50 DAV is 1,252,500
|
$32.00
-10.28%
|
12/12/2022
|
$29.83
|
PP = $29.57
|
|
MB = $31.05
|
Most Recent Note - 1/10/2023 1:30:19 PM
G - Gapped down today violating its 50 DMA line ($29.20) triggering a technical sell signal and its color code is changed to green. Only a prompt rebound above the 50 DMA line would help its outlook improve Quarterly and annual earnings increases have been strong and steady.
>>> FEATURED STOCK ARTICLE : Pulled Back After Perched Near All-Time High - 1/6/2023 |
View all notes |
Set NEW NOTE alert |
Company Profile |
SEC
News |
Chart |
Request a new note
C
A
S
I |
STRL
-
NASDAQ
Sterling Infrastructure
MATERIALS and; CONSTRUCTION - Heavy Construction
|
$32.82
|
-0.10
-0.30% |
$33.43
|
189,255
87.21% of 50 DAV
50 DAV is 217,000
|
$34.86
-5.85%
|
12/14/2022
|
$32.41
|
PP = $33.72
|
|
MB = $35.41
|
Most Recent Note - 1/9/2023 7:37:29 PM
Y - Testing support at its 50 DMA line ($31.66) after its recent failed breakout attempt. Highlighted in yellow with pivot point cited based on its 11/08/22 high plus 10 cents in the 12/14/22 mid-day report. See the latest FSU analysis for more details and a new annotated graph. New buying efforts are discouraged in all stocks while the market is in a correction. Disciplined investors will watch for a new confirmed uptrend with follow-through day to be noted.
>>> FEATURED STOCK ARTICLE : Finding Support Near 50-Day Moving Average After Failed Breakout Attempt - 1/9/2023 |
View all notes |
Set NEW NOTE alert |
Company Profile |
SEC
News |
Chart |
Request a new note
C
A
S
I |
|
|
|
THESE ARE NOT BUY RECOMMENDATIONS!
Comments contained in the body of this report are technical
opinions only. The material herein has been obtained
from sources believed to be reliable and accurate, however,
its accuracy and completeness cannot be guaranteed.
This site is not an investment advisor, hence it does
not endorse or recommend any securities or other investments.
Any recommendation contained in this report may not
be suitable for all investors and it is not to be deemed
an offer or solicitation on our part with respect to
the purchase or sale of any securities. All trademarks,
service marks and trade names appearing in this report
are the property of their respective owners, and are
likewise used for identification purposes only.
This report is a service available
only to active Paid Premium Members.
You may opt-out of receiving report notifications
at any time. Questions or comments may be submitted
by writing to Premium Membership Services 665 S.E. 10 Street, Suite 201 Deerfield Beach, FL 33441-5634 or by calling 1-800-965-8307
or 954-785-1121.
|
|
|