You are not logged in.
This means you
CAN ONLY VIEW reports that were published prior to Tuesday, March 25, 2025.
You
MUST UPGRADE YOUR MEMBERSHIP if you want to see any current reports.
AFTER MARKET UPDATE - THURSDAY, JANUARY 5TH, 2023
Previous After Market Report Next After Market Report >>>
|
|
|
|
DOW |
-339.69 |
32,930.08 |
-1.02% |
|
Volume |
876,666,035 |
-11% |
|
Volume |
4,727,710,700 |
-7% |
|
NASDAQ |
-153.52 |
10,305.24 |
-1.47% |
|
Advancers |
1,232 |
41% |
|
Advancers |
1,805 |
40% |
|
S&P 500 |
-44.87 |
3,808.10 |
-1.16% |
|
Decliners |
1,758 |
59% |
|
Decliners |
2,760 |
60% |
|
Russell 2000 |
-19.35 |
1,753.19 |
-1.09% |
|
52 Wk Highs |
64 |
|
|
52 Wk Highs |
106 |
|
|
S&P 600 |
-10.31 |
1,159.12 |
-0.88% |
|
52 Wk Lows |
37 |
|
|
52 Wk Lows |
90 |
|
|
The market is in a correction (M criteria). Thin leadership was a recent warning sign as weakness in the major averages was noted. Disciplined investors know to avoid new buying, reduce exposure and raise cash until a new confirmed rally with a solid follow-through day is noted.
|
 |
Major Averages Lost Ground With Lighter Volume Totals
Kenneth J. Gruneisen - Passed the CAN SLIM® Master's Exam
The Dow lost 339 points, while the Nasdaq Composite fell 1.5%. The S&P 500 shed 1.2%. Volume totals were lighter than the prior session on the NYSE and on the Nasdaq exchange. Decliners led advancers by a 3-2 margin on the NYSE and on the Nasdaq exchange. There were 10 high-ranked companies from the Leaders List that hit new 52-week highs and were listed on the BreakOuts Page versus the total of 9 on the prior session. New 52-week highs outnumbered new 52-week lows on the NYSE and on the Nasdaq exchange. The market is in a correction (M criteria). Disciplined investors know to avoid new buying, reduce exposure and raise cash until a new confirmed rally with a solid follow-through day is noted.
Chart courtesy of www.stockcharts.com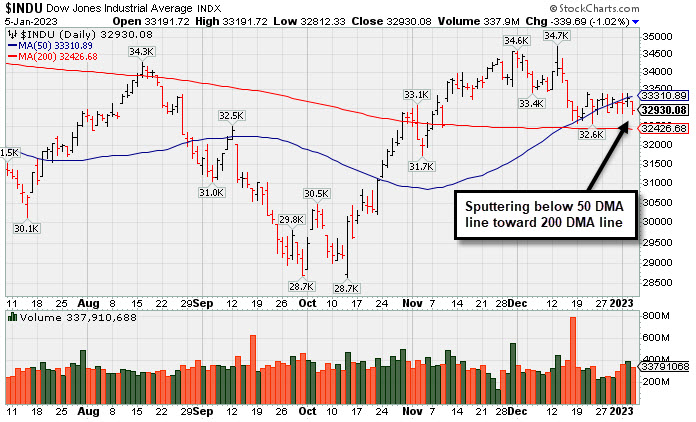 PICTURED: The Dow Jones Industrial Average recently has been sputtering below its 50-day moving average (DMA) line toward its 200 DMA line.
U.S. equities finished lower Thursday as investors digested today’s batch of labor market data. Initial jobless claims for the week ended December 31 came in at 204,000, down from the prior week’s 223,000 print, while the ADP Employment Change Report showed business payrolls surged 235,000 in December versus estimates of a 150,000 gain. The hotter-than-expected prints indicate the jobs market remains robust, which could factor into the Federal Reserve’s (Fed) next monetary policy move. Ten of 11 S&P 500 sectors finished in negative territory, with Energy bucking the downtrend.
Elsewhere on the data front, the final December update for S&P Global U.S. Services Purchasing Managers’ Index (PMI) was upwardly revised to 44.7 from 44.4. In the central bank space, St. Louis Fed President James Bullard said the central bank has raised rates almost as high as they need to go to curb inflation. His remarks come after Minneapolis Fed President Neel Kashkari said he believes rates will need to climb to 5.4% before easing off on Wednesday.
Treasuries were mixed, with the yield on the benchmark 10-year note up three basis points (0.03%) to 3.71%, while the 30-year bond yield dipped one basis point (0.01%) to 3.78%. The yield on the two-year note, which is more sensitive to changes in Fed policy, advanced nine basis points (0.09%) to 4.45%. In commodities, West Texas Intermediate (WTI) crude added 1.2% to $73.71/barrel after the Energy Information Agency’s (EIA) weekly inventory report showed a drawdown in domestic gasoline stockpiles.
|
 Kenneth J. Gruneisen started out as a licensed stockbroker in August 1987, a couple of months prior to the historic stock market crash that took the Dow Jones Industrial Average down -22.6% in a single day. He has published daily fact-based fundamental and technical analysis on high-ranked stocks online for two decades. Through FACTBASEDINVESTING.COM, Kenneth provides educational articles, news, market commentary, and other information regarding proven investment systems that work in good times and bad.
Comments contained in the body of this report are technical opinions only and are not necessarily those of Gruneisen Growth Corp. The material herein has been obtained from sources believed to be reliable and accurate, however, its accuracy and completeness cannot be guaranteed. Our firm, employees, and customers may effect transactions, including transactions contrary to any recommendation herein, or have positions in the securities mentioned herein or options with respect thereto. Any recommendation contained in this report may not be suitable for all investors and it is not to be deemed an offer or solicitation on our part with respect to the purchase or sale of any securities. |
|
 |
Retail, Bank, and Tech Indexes Led Declines
Kenneth J. Gruneisen - Passed the CAN SLIM® Master's Exam
The Retail Index ($RLX -1.18%). Bank Index ($BKX -1.10%), and Broker/Dealer Index ($XBD -0.27%) each lost ground. The Semiconductor Index ($SOX -1.98%) and Networking Index ($NWX -1.09%) both lost ground and Biotech Index ($BTK -0.18%) also ended slightly in the red. The Oil Services Index ($OSX +1.83%) and Integrated Oil Index ($XOI +2.20%) both posted gains while the Gold & Silver Index ($XAU -0.61%) edged lower.
PICTURED: The Broker/Dealer Index ($XBD -0.27%) recently slumped below its 50-day moving average (DMA) line.
| Oil Services |
$OSX |
82.51 |
+1.48 |
+1.83% |
-1.61% |
| Integrated Oil |
$XOI |
1,747.15 |
+37.64 |
+2.20% |
-2.24% |
| Semiconductor |
$SOX |
2,518.52 |
-50.94 |
-1.98% |
-0.54% |
| Networking |
$NWX |
775.85 |
-8.56 |
-1.09% |
-0.95% |
| Broker/Dealer |
$XBD |
451.61 |
-1.22 |
-0.27% |
+0.55% |
| Retail |
$RLX |
2,751.64 |
-32.77 |
-1.18% |
-0.09% |
| Gold & Silver |
$XAU |
128.90 |
-0.80 |
-0.61% |
+6.65% |
| Bank |
$BKX |
102.66 |
-1.14 |
-1.10% |
+1.80% |
| Biotech |
$BTK |
5,322.79 |
-9.85 |
-0.18% |
+0.79% |
|
|
|
 |
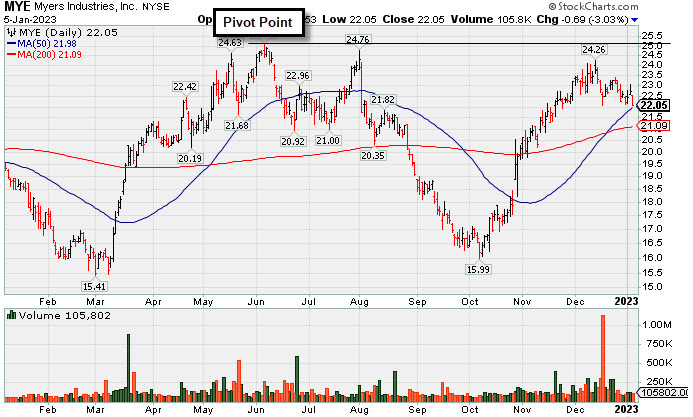
Pullback Testing 50-Day Moving Average Line
Kenneth J. Gruneisen - Passed the CAN SLIM® Master's Exam
Myers Industries Inc (MYE -$0.69 or -3.03% to $22.05) lost ground today with below average volume while testing its 50-day moving average (DMA) line ($22.04). More damaging losses would trigger a technical sell signal. Still faces resistance due to overhead supply up to the $25.50 level.
MYE was highlighted in yellow in the 12/08/22 mid-day report (read here) and covered in greater detail that evening with an annotated graph under the headline, "Myers Industries on Track for 9th Straight Weekly Gain". It has a 96 Earnings Per Share Rating. The Sep '22 quarter showed +78% earnings on +14% sales revenues versus the year ago period. The past 4 quarterly comparisons were above the +25% minimum guideline (C criteria), however, its sales revenues growth rate has shown deceleration in sequential comparisons +45%, +29%, +24%, to +14%. Annual earnings (A criteria) history had a slight downturn in FY '19 but growth has been otherwise strong and steady.
It hails from the Containers/Packaging industry group which is now ranked 26th on the 197 Industry Groups list (L criteria). There are only 36.5 million shares outstanding (S criteria) which can contribute to greater price volatility in the event of institutional buying or selling. The number of top-rated funds owning its shares was 336 in Mar '22 and was reported at 335 as of Dec '22. Its current Up/Down Volume Ratio of 1.1 is an unbiased indication its shares have been under slight accumulation over the past 50 days (I criteria).
|
|
|
Color Codes Explained :
Y - Better candidates highlighted by our
staff of experts.
G - Previously featured
in past reports as yellow but may no longer be buyable under the
guidelines.
***Last / Change / Volume data in this table is the closing quote data***
Symbol/Exchange
Company Name
Industry Group |
PRICE |
CHANGE
(%Change) |
Day High |
Volume
(% DAV)
(% 50 day avg vol) |
52 Wk Hi
% From Hi |
Featured
Date |
Price
Featured |
Pivot Featured |
|
Max Buy |
 CMC
-
NYSE
CMC
-
NYSE
Commercial Metals Co
METALS and MINING - Steel and Iron
|
$49.16
|
+0.16
0.33% |
$49.48
|
879,333
90.56% of 50 DAV
50 DAV is 971,000
|
$50.83
-3.29%
|
10/14/2022
|
$41.61
|
PP = $44.45
|
|
MB = $46.67
|
Most Recent Note - 1/3/2023 5:13:17 PM
G - Volume was +23% above average behind today's loss while consolidating just above its 50 DMA line ($47.38) and prior highs in the $46 area defining important near-term support to watch. Fundamentals remain strong.
>>> FEATURED STOCK ARTICLE : Consolidating Above 50-Day Moving Average Line and Prior High - 1/3/2023 |
View all notes |
Set NEW NOTE alert |
Company Profile |
SEC
News |
Chart |
Request a new note
C
A
S
I |
GPK
-
NYSE
Graphic Packaging Hldg
CONSUMER NON-DURABLES - Packaging and Containers
|
$22.09
|
+0.16
0.73% |
$22.17
|
4,025,029
128.55% of 50 DAV
50 DAV is 3,131,000
|
$24.07
-8.23%
|
10/25/2022
|
$22.75
|
PP = $24.17
|
|
MB = $25.38
|
 Most Recent Note - 1/5/2023 12:10:03 PM
G - Testing near its 200 DMA line ($21.63) which has recently acted as support while it met resistance near its 50 DMA line ($22.39). A rebound above the 50 DMA line is needed for its outlook to improve. Faces resistance due to overhead supply up to the $24 level. Fundamentals remain strong.
>>> FEATURED STOCK ARTICLE : Violated 50-Day Moving Average After Recently Failing to Break Out - 12/15/2022 |
View all notes |
Set NEW NOTE alert |
Company Profile |
SEC
News |
Chart |
Request a new note
C
A
S
I |
GFF
-
NYSE
Griffon Corporation
MATERIALS and CONSTRUCTION - General Building Materials
|
$35.02
|
-1.83
-4.97% |
$36.68
|
285,855
65.56% of 50 DAV
50 DAV is 436,000
|
$37.69
-7.08%
|
11/10/2022
|
$34.13
|
PP = $35.02
|
|
MB = $36.77
|
Most Recent Note - 1/5/2023 5:41:28 PM
Y - Color code is changed to yellow after today's loss with light volume pulling back below its "max buy" level. Its 50 DMA line ($34.43) defines near-term support above recent lows in the $33.82 area. Reported Sep '22 quarterly earnings +230% on +24% sales revenues versus the year ago period. See the latest FSU analysis for more details and an annotated graph.
>>> FEATURED STOCK ARTICLE : Rose Above Max Buy Level With 4th Consecutive Gain - 1/4/2023 |
View all notes |
Set NEW NOTE alert |
Company Profile |
SEC
News |
Chart |
Request a new note
C
A
S
I |
CPRX
-
NASDAQ
Catalyst Pharma Inc
Medical-Biomed/Biotech
|
$18.83
|
+0.28
1.51% |
$18.98
|
1,735,528
72.68% of 50 DAV
50 DAV is 2,388,000
|
$19.78
-4.80%
|
11/22/2022
|
$17.38
|
PP = $16.66
|
|
MB = $17.49
|
Most Recent Note - 1/4/2023 2:55:03 PM
G - Posting a quiet gain today. Found prompt support near the prior high and well above its 50 DMA line ($16.32).
>>> FEATURED STOCK ARTICLE : Powerful Rally to New High for Catalyst - 12/20/2022 |
View all notes |
Set NEW NOTE alert |
Company Profile |
SEC
News |
Chart |
Request a new note
C
A
S
I |
TITN
-
NASDAQ
Titan Machinery Inc
SPECIALTY RETAIL
|
$40.12
|
+0.45
1.13% |
$40.23
|
166,715
76.13% of 50 DAV
50 DAV is 219,000
|
$44.35
-9.54%
|
11/30/2022
|
$40.10
|
PP = $38.68
|
|
MB = $40.61
|
Most Recent Note - 1/3/2023 12:46:18 PM
Y - Found support when recently consolidating near the prior high in the $38 area which defines initial support to watch above its 50 DMA line ($36.89). Fundamentals remain strong after reporting Oct '22 quarterly earnings +91% on +47% sales revenues.
>>> FEATURED STOCK ARTICLE : Found Support Near Prior High Following Breakout - 12/30/2022 |
View all notes |
Set NEW NOTE alert |
Company Profile |
SEC
News |
Chart |
Request a new note
C
A
S
I |
Symbol/Exchange
Company Name
Industry Group |
PRICE |
CHANGE
(%Change) |
Day High |
Volume
(% DAV)
(% 50 day avg vol) |
52 Wk Hi
% From Hi |
Featured
Date |
Price
Featured |
Pivot Featured |
|
Max Buy |
MYE
-
NYSE
Myers Industries Inc
Containers/Packaging
|
$22.05
|
-0.69
-3.03% |
$22.53
|
105,802
62.24% of 50 DAV
50 DAV is 170,000
|
$25.55
-13.70%
|
12/8/2022
|
$23.94
|
PP = $25.65
|
|
MB = $26.93
|
Most Recent Note - 1/5/2023 5:33:57 PM
Y - Lost ground today with below average volume while testing its 50 DMA line ($22.04). More damaging losses would trigger a technical sell signal. Still faces resistance due to overhead supply up to the $25.50 level. See the latest FSU analysis for more details and a new annotated graph.
>>> FEATURED STOCK ARTICLE : Pullback Testing 50-Day Moving Average Line - 1/5/2023 |
View all notes |
Set NEW NOTE alert |
Company Profile |
SEC
News |
Chart |
Request a new note
C
A
S
I |
BOX
-
NYSE
Box Inc Cl A
Computer Sftwr-Database
|
$30.21
|
-1.37
-4.34% |
$31.37
|
1,423,546
122.51% of 50 DAV
50 DAV is 1,162,000
|
$33.04
-8.57%
|
12/12/2022
|
$29.83
|
PP = $29.57
|
|
MB = $31.05
|
Most Recent Note - 1/5/2023 5:38:27 PM
Y - Slumped for a bigger loss today after trading in a tight range for the past 3 weeks and its color code is changed to yellow while pulling back below its "max buy" level. Faces some resistance due to overhead supply up to the $33 level. Quarterly and annual earnings increases have been strong and steady.
>>> FEATURED STOCK ARTICLE : Volume Heavy Behind Breakout for Box Inc - 12/12/2022 |
View all notes |
Set NEW NOTE alert |
Company Profile |
SEC
News |
Chart |
Request a new note
C
A
S
I |
STRL
-
NASDAQ
Sterling Infrastructure
MATERIALS and; CONSTRUCTION - Heavy Construction
|
$31.61
|
-1.75
-5.25% |
$33.22
|
306,450
147.33% of 50 DAV
50 DAV is 208,000
|
$34.86
-9.32%
|
12/14/2022
|
$32.41
|
PP = $33.72
|
|
MB = $35.41
|
Most Recent Note - 1/5/2023 5:35:19 PM
Y - Abruptly retreating from its 52-week high with 2 consecutive losses back by above average volume. Highlighted in yellow with pivot point cited based on its 11/08/22 high plus 10 cents in the 12/14/22 mid-day report. Faces no resistance due to overhead supply. Prior mid-day reports noted - "Subsequent gains above the pivot point backed by at least +40% above average volume are needed to trigger a proper technical buy signal." New buying efforts are discouraged in all stocks while the market is in a correction. Disciplined investors will watch for a new confirmed uptrend with follow-through day to be noted.
>>> FEATURED STOCK ARTICLE : Sterling Infrastructure Forming Orderly Base Pattern - 12/14/2022 |
View all notes |
Set NEW NOTE alert |
Company Profile |
SEC
News |
Chart |
Request a new note
C
A
S
I |
|
|
|
THESE ARE NOT BUY RECOMMENDATIONS!
Comments contained in the body of this report are technical
opinions only. The material herein has been obtained
from sources believed to be reliable and accurate, however,
its accuracy and completeness cannot be guaranteed.
This site is not an investment advisor, hence it does
not endorse or recommend any securities or other investments.
Any recommendation contained in this report may not
be suitable for all investors and it is not to be deemed
an offer or solicitation on our part with respect to
the purchase or sale of any securities. All trademarks,
service marks and trade names appearing in this report
are the property of their respective owners, and are
likewise used for identification purposes only.
This report is a service available
only to active Paid Premium Members.
You may opt-out of receiving report notifications
at any time. Questions or comments may be submitted
by writing to Premium Membership Services 665 S.E. 10 Street, Suite 201 Deerfield Beach, FL 33441-5634 or by calling 1-800-965-8307
or 954-785-1121.
|
|
|