You are not logged in.
This means you
CAN ONLY VIEW reports that were published prior to Sunday, April 6, 2025.
You
MUST UPGRADE YOUR MEMBERSHIP if you want to see any current reports.
AFTER MARKET UPDATE - TUESDAY, JANUARY 17TH, 2023
Previous After Market Report Next After Market Report >>>
|
|
|
|
DOW |
-391.76 |
33,910.85 |
-1.14% |
|
Volume |
902,336,122 |
+15% |
|
Volume |
5,132,127,700 |
+2% |
|
NASDAQ |
+15.96 |
11,095.11 |
+0.14% |
|
Advancers |
1,636 |
54% |
|
Advancers |
2,346 |
51% |
|
S&P 500 |
-8.12 |
3,990.97 |
-0.20% |
|
Decliners |
1,398 |
46% |
|
Decliners |
2,277 |
49% |
|
Russell 2000 |
-2.75 |
1,884.29 |
-0.15% |
|
52 Wk Highs |
126 |
|
|
52 Wk Highs |
141 |
|
|
S&P 600 |
-4.38 |
1,234.50 |
-0.35% |
|
52 Wk Lows |
10 |
|
|
52 Wk Lows |
23 |
|
|
 |
Goldman Sachs' Loss Creates a Drag on the Dow Industrials
Kenneth J. Gruneisen - Passed the CAN SLIM® Master's Exam
The Dow lost 391 points mainly fueled by Goldman Sach’s (GS -6.44%) decline while the Nasdaq Composite increased 0.1% and the S&P 500 decreased 0.2%. Volume totals were higher than the prior session on the NYSE and on the Nasdaq exchange. Advancers led decliners by an 8-7 margin on the NYSE while the mix was near even on the Nasdaq exchange. There were 37 high-ranked companies from the Leaders List that hit new 52-week highs and were listed on the BreakOuts Page versus the total of 39 on the prior session. New 52-week highs totals expanded and solidly outnumbered new 52-week lows on the NYSE and on the Nasdaq exchange. The solid gains last Wednesday marked a follow-through day confirming a new uptrend for the major indices (M criteria).
PICTURED: The Nasdaq Composite Index posted a 7th consecutive gain and made more progress above its 50-day moving average line, but it remains well below its 200 DMA line.
U.S equities finished mixed Tuesday following a slew of bank earnings. Goldman Sachs declined 6.5% after reporting its largest earning miss in a decade following declines in investment banking and asset management revenues. On the other side of the spectrum, Morgan Stanley increased 5.8% after its fourth-quarter earnings beat analyst expectations in part to record wealth management revenue. Six of the eleven S&P sectors finished in negative territory with Materials leading laggards.
On the data front, January’s New York Manufacturing Activity Index plummeted to its lowest level since the start of the pandemic in mid-2020, notching its fifth-worst reading in the survey’s history, the index plunged 21.7 points from last month’s -11.2 print to a -32.9 reading in January.
Treasuries finished mixed as market participants continue to look for key insights regarding the central bank’s policy plans at their next meeting. The yield on the benchmark 10-year note increased five basis points (0.05%) to 3.55%, while the 30-year bond yield climbed five basis points (0.05%) to 3.66%. The yield on the two-year note declined three basis points (0.03%) to 4.20%. In commodities, West Texas Intermediate (WTI) crude added 1.6% to $81.17/barrel, hitting a two-week high amid optimism over demand growth in China. The Chinese government reading was weak but still beat annual economic growth estimates as investor optimism increases as the country shifts from its strict zero COVID-19 policy. |
 Kenneth J. Gruneisen started out as a licensed stockbroker in August 1987, a couple of months prior to the historic stock market crash that took the Dow Jones Industrial Average down -22.6% in a single day. He has published daily fact-based fundamental and technical analysis on high-ranked stocks online for two decades. Through FACTBASEDINVESTING.COM, Kenneth provides educational articles, news, market commentary, and other information regarding proven investment systems that work in good times and bad.
Comments contained in the body of this report are technical opinions only and are not necessarily those of Gruneisen Growth Corp. The material herein has been obtained from sources believed to be reliable and accurate, however, its accuracy and completeness cannot be guaranteed. Our firm, employees, and customers may effect transactions, including transactions contrary to any recommendation herein, or have positions in the securities mentioned herein or options with respect thereto. Any recommendation contained in this report may not be suitable for all investors and it is not to be deemed an offer or solicitation on our part with respect to the purchase or sale of any securities. |
|
 |
Gold & Silver Index Slumped and Retail Index Also Created a Drag
Kenneth J. Gruneisen - Passed the CAN SLIM® Master's Exam
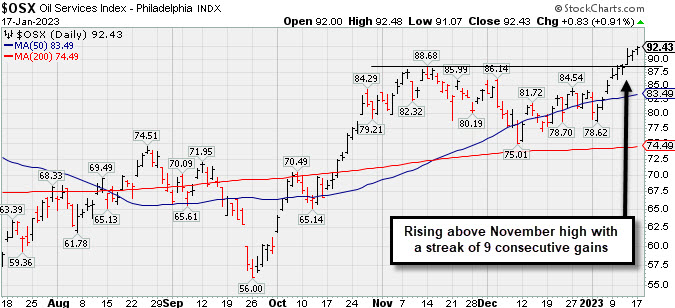
The Retail Index ($RLX -1.36%) lost ground while the Bank Index ($BKX -0.24%) ended slightly in the red and the Broker/Dealer Index ($XBD +0.07%) finished flat. The tech sector saw modest gains from the Semiconductor Index ($SOX +0.24%) and Networking Index ($NWX +0.44%) while the Biotech Index ($BTK -0.40%) edged lower. The Oil Services Index ($OSX +0.91%) and Integrated Oil Index ($XOI +0.17%) posted small gains. The Gold & Silver Index ($XAU -3.26%) slumped and was a standout decliner.
PICTURED: The Oil Services Index ($OSX +0.91%) recently rose above its November high with a streak of 9 consecutive gains.
| Oil Services |
$OSX |
92.43 |
+0.83 |
+0.91% |
+10.22% |
| Integrated Oil |
$XOI |
1,843.69 |
+3.06 |
+0.17% |
+3.16% |
| Semiconductor |
$SOX |
2,807.48 |
+6.81 |
+0.24% |
+10.88% |
| Networking |
$NWX |
819.67 |
+3.59 |
+0.44% |
+4.64% |
| Broker/Dealer |
$XBD |
481.55 |
+0.34 |
+0.07% |
+7.22% |
| Retail |
$RLX |
2,971.85 |
-40.94 |
-1.36% |
+7.91% |
| Gold & Silver |
$XAU |
132.25 |
-4.45 |
-3.26% |
+9.42% |
| Bank |
$BKX |
107.37 |
-0.26 |
-0.24% |
+6.47% |
| Biotech |
$BTK |
5,502.69 |
-21.92 |
-0.40% |
+4.20% |
|
|
|
 |
Featured Stocks
Kenneth J. Gruneisen - Passed the CAN SLIM® Master's Exam
|
|
|
Color Codes Explained :
Y - Better candidates highlighted by our
staff of experts.
G - Previously featured
in past reports as yellow but may no longer be buyable under the
guidelines.
***Last / Change / Volume data in this table is the closing quote data***
Symbol/Exchange
Company Name
Industry Group |
PRICE |
CHANGE
(%Change) |
Day High |
Volume
(% DAV)
(% 50 day avg vol) |
52 Wk Hi
% From Hi |
Featured
Date |
Price
Featured |
Pivot Featured |
|
Max Buy |
 CMC
-
NYSE
CMC
-
NYSE
Commercial Metals Co
METALS and MINING - Steel and Iron
|
$55.34
|
-0.72
-1.28% |
$56.88
|
1,130,382
114.30% of 50 DAV
50 DAV is 989,000
|
$56.60
-2.23%
|
10/14/2022
|
$41.61
|
PP = $44.45
|
|
MB = $46.67
|
 Most Recent Note - 1/17/2023 6:01:17 PM
G - There was a "negative reversal" today after hitting yet another new 52-week high. Its 50 DMA line ($48.87) defines important near-term support to watch on pullbacks. Fundamentals remain strong.
>>> FEATURED STOCK ARTICLE : Consolidating Above 50-Day Moving Average Line and Prior High - 1/3/2023 |
View all notes |
Set NEW NOTE alert |
Company Profile |
SEC
News |
Chart |
Request a new note
C
A
S
I |
GPK
-
NYSE
Graphic Packaging Hldg
CONSUMER NON-DURABLES - Packaging and Containers
|
$22.23
|
-0.20
-0.89% |
$22.56
|
2,225,568
77.49% of 50 DAV
50 DAV is 2,872,100
|
$24.07
-7.64%
|
10/25/2022
|
$22.75
|
PP = $24.17
|
|
MB = $25.38
|
Most Recent Note - 1/17/2023 5:59:51 PM
Y - Consolidating near its 50 DMA line ($22.31) after recently finding support at its 200 DMA line ($21.71). More damaging losses may raise concerns. Faces some resistance due to overhead supply up to the $24 level. Fundamentals remain strong.
>>> FEATURED STOCK ARTICLE : Found Support at 200-Day Moving Average and Still Faces Resistance - 1/10/2023 |
View all notes |
Set NEW NOTE alert |
Company Profile |
SEC
News |
Chart |
Request a new note
C
A
S
I |
GFF
-
NYSE
Griffon Corporation
MATERIALS and CONSTRUCTION - General Building Materials
|
$39.87
|
+0.30
0.76% |
$39.99
|
577,889
122.18% of 50 DAV
50 DAV is 473,000
|
$39.82
0.13%
|
11/10/2022
|
$34.13
|
PP = $35.02
|
|
MB = $36.77
|
Most Recent Note - 1/17/2023 12:39:58 PM
G - Perched at its 52-week high after recent volume-driven gains. Its 50 DMA line ($35.30) defines near-term support above recent lows in the $33.82 area. Reported Sep '22 quarterly earnings +230% on +24% sales revenues versus the year ago period.
>>> FEATURED STOCK ARTICLE : Rose Above Max Buy Level With 4th Consecutive Gain - 1/4/2023 |
View all notes |
Set NEW NOTE alert |
Company Profile |
SEC
News |
Chart |
Request a new note
C
A
S
I |
CPRX
-
NASDAQ
Catalyst Pharma Inc
Medical-Biomed/Biotech
|
$20.14
|
-0.91
-4.32% |
$21.53
|
1,818,257
72.64% of 50 DAV
50 DAV is 2,503,000
|
$22.11
-8.91%
|
11/22/2022
|
$17.38
|
PP = $16.66
|
|
MB = $17.49
|
Most Recent Note - 1/17/2023 5:56:55 PM
G - Pulled back from its 52-week high with today's loss following 4 consecutive gains. Its 50 DMA line ($17.26) defines near-term support to watch on pullbacks.
>>> FEATURED STOCK ARTICLE : Making Gradual Progress Hitting Another New High - 1/11/2023 |
View all notes |
Set NEW NOTE alert |
Company Profile |
SEC
News |
Chart |
Request a new note
C
A
S
I |
TITN
-
NASDAQ
Titan Machinery Inc
SPECIALTY RETAIL
|
$42.58
|
-0.32
-0.75% |
$43.49
|
158,043
68.42% of 50 DAV
50 DAV is 231,000
|
$44.35
-3.99%
|
1/13/2023
|
$40.10
|
PP = $44.45
|
|
MB = $46.67
|
Most Recent Note - 1/13/2023 5:14:11 PM
Y - Color code is changed to yellow with new pivot point cited based on its 12/01/22 high plus 10 cents. Found support when recently consolidating near the prior high in the $38 area which defines important support to watch along with its 50 DMA line ($38.17). See the latest FSU analysis for more details and a new annotated graph.
>>> FEATURED STOCK ARTICLE : Forming New Base for Past 7 Weeks - 1/13/2023 |
View all notes |
Set NEW NOTE alert |
Company Profile |
SEC
News |
Chart |
Request a new note
C
A
S
I |
Symbol/Exchange
Company Name
Industry Group |
PRICE |
CHANGE
(%Change) |
Day High |
Volume
(% DAV)
(% 50 day avg vol) |
52 Wk Hi
% From Hi |
Featured
Date |
Price
Featured |
Pivot Featured |
|
Max Buy |
MYE
-
NYSE
Myers Industries Inc
Containers/Packaging
|
$24.45
|
-0.30
-1.21% |
$25.11
|
175,471
105.07% of 50 DAV
50 DAV is 167,000
|
$25.55
-4.31%
|
12/8/2022
|
$23.94
|
PP = $25.65
|
|
MB = $26.93
|
Most Recent Note - 1/13/2023 5:16:18 PM
Y - Posted a 6th consecutive gain today with below average volume after testing its 50 DMA line ($22.57) last week. Faces little resistance due to overhead supply up to the $25.50 level.
>>> FEATURED STOCK ARTICLE : Pullback Testing 50-Day Moving Average Line - 1/5/2023 |
View all notes |
Set NEW NOTE alert |
Company Profile |
SEC
News |
Chart |
Request a new note
C
A
S
I |
BOX
-
NYSE
Box Inc Cl A
Computer Sftwr-Database
|
$30.93
|
+0.43
1.41% |
$30.95
|
1,576,082
120.13% of 50 DAV
50 DAV is 1,312,000
|
$33.04
-6.39%
|
12/12/2022
|
$29.83
|
PP = $29.57
|
|
MB = $31.05
|
Most Recent Note - 1/13/2023 5:18:08 PM
Y - Rebounded further above the 50 DMA line ($29.25) with 3 consecutive gains helping its outlook improve. Still faces some resistance due to overhead supply up to the $32 level. Quarterly and annual earnings increases have been strong and steady.
>>> FEATURED STOCK ARTICLE : Pulled Back After Perched Near All-Time High - 1/6/2023 |
View all notes |
Set NEW NOTE alert |
Company Profile |
SEC
News |
Chart |
Request a new note
C
A
S
I |
STRL
-
NASDAQ
Sterling Infrastructure
MATERIALS and; CONSTRUCTION - Heavy Construction
|
$32.35
|
-1.52
-4.49% |
$34.32
|
321,959
151.87% of 50 DAV
50 DAV is 212,000
|
$34.86
-7.20%
|
12/14/2022
|
$32.41
|
PP = $33.72
|
|
MB = $35.41
|
Most Recent Note - 1/17/2023 5:58:57 PM
Y - There was a "negative reversal" today for a loss with higher volume after early gains nearly challenging its prior high. Its 50 DMA line ($32.15) defines important support after its recent failed breakout attempt. Highlighted in yellow with pivot point cited based on its 11/08/22 high plus 10 cents in the 12/14/22 mid-day report. Confirming volume-driven gains for a new high would be a reassuring sign of fresh institutional buying demand.
>>> FEATURED STOCK ARTICLE : Finding Support Near 50-Day Moving Average After Failed Breakout Attempt - 1/9/2023 |
View all notes |
Set NEW NOTE alert |
Company Profile |
SEC
News |
Chart |
Request a new note
C
A
S
I |
|
|
|
THESE ARE NOT BUY RECOMMENDATIONS!
Comments contained in the body of this report are technical
opinions only. The material herein has been obtained
from sources believed to be reliable and accurate, however,
its accuracy and completeness cannot be guaranteed.
This site is not an investment advisor, hence it does
not endorse or recommend any securities or other investments.
Any recommendation contained in this report may not
be suitable for all investors and it is not to be deemed
an offer or solicitation on our part with respect to
the purchase or sale of any securities. All trademarks,
service marks and trade names appearing in this report
are the property of their respective owners, and are
likewise used for identification purposes only.
This report is a service available
only to active Paid Premium Members.
You may opt-out of receiving report notifications
at any time. Questions or comments may be submitted
by writing to Premium Membership Services 665 S.E. 10 Street, Suite 201 Deerfield Beach, FL 33441-5634 or by calling 1-800-965-8307
or 954-785-1121.
|
|
|