You are not logged in.
This means you
CAN ONLY VIEW reports that were published prior to Monday, March 24, 2025.
You
MUST UPGRADE YOUR MEMBERSHIP if you want to see any current reports.
AFTER MARKET UPDATE - THURSDAY, JANUARY 19TH, 2023
Previous After Market Report Next After Market Report >>>
|
|
|
|
DOW |
-252.40 |
33,044.56 |
-0.76% |
|
Volume |
853,730,028 |
-5% |
|
Volume |
4,642,791,500 |
-11% |
|
NASDAQ |
-104.74 |
10,852.27 |
-0.96% |
|
Advancers |
1,225 |
41% |
|
Advancers |
1,730 |
38% |
|
S&P 500 |
-30.01 |
3,898.85 |
-0.76% |
|
Decliners |
1,729 |
59% |
|
Decliners |
2,806 |
62% |
|
Russell 2000 |
-18.02 |
1,836.35 |
-0.97% |
|
52 Wk Highs |
40 |
|
|
52 Wk Highs |
72 |
|
|
S&P 600 |
-10.40 |
1,204.70 |
-0.86% |
|
52 Wk Lows |
18 |
|
|
52 Wk Lows |
35 |
|
|
 |
Major Indices Fell as Leadership Abruptly Thinned
Kenneth J. Gruneisen - Passed the CAN SLIM® Master's Exam
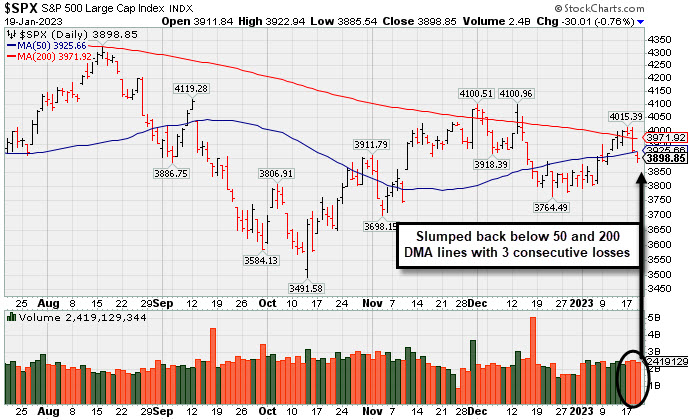
The Dow lost 252 points, while the tech-heavy Nasdaq Composite shed 1%, and the S&P 500 fell 0.8%. Volume totals were lighter than the prior session on the NYSE and on the Nasdaq exchange, a hint that institutional selling pressure might be easing. However, breadth was negative as decliners led advancers by a 3-2 margin on the NYSE and on the Nasdaq exchange. Leadership also thinned abruptly as there were only 3 high-ranked companies from the Leaders List that hit new 52-week highs and were listed on the BreakOuts Page versus the total of 28 on the prior session. New 52-week highs totals contracted yet still outnumbered the expanding list of new 52-week lows on both the NYSE and the Nasdaq exchange. The major indices are in an uptrend that has come under pressure (M criteria). Disciplined investors still have a green light for making new buys only in stocks matching all key criteria of the fact-based investment system.
PICTURED: The S&P 500 Index violated its 50-day moving average line with Wednesday's big loss.
U.S. equities declined on Thursday as market participants continue to fear the Federal Reserve (Fed) may overtighten, leading to a recession. Jobless claims ending January 14 fell to their lowest level since September, suggesting the labor market remains resilient despite recent big-tech layoffs. The Fed is looking to the labor market for signs of cooling and may need the labor market to break to comfortably hold rates where they are.
In corporate news, Procter & Gamble (PG -2.73%) fell as it reported lower fourth-quarter profits and a decline in sales volume after the company increased its prices by 10%. The company estimates a 3% - 4% growth in consumer products versus the previous 5% - 6% growth seen a year ago. Directly following the close, Netflix’s (NFLX -3.23%) announced that they added 7.7 million subscribers in the fourth quarter compared to a forecast of 4.5 million. On the data front, January’s reading of the Philadelphia Fed Business Outlook came in slightly better-than-estimated at -8.9, up from the prior month’s -13.8. The index has been in the negative for the last five months as conditions continue to be challenging for manufacturers. Elsewhere, housing starts and building permits both declined in December by -1.4% and -1.6% respectively.
Treasuries slid, with the yield on the benchmark 10-year note up two basis points (0.02%) to 3.39%, while the 30-year bond yield gained three basis points (0.03%) to 3.56%. The yield on the two-year note increased four basis points (0.04%) to 4.11%. In commodities, West Texas Intermediate Crude Oil (WTI) increased 1.3% to $80.47/barrel amid an unexpected growth in inventories. |
 Kenneth J. Gruneisen started out as a licensed stockbroker in August 1987, a couple of months prior to the historic stock market crash that took the Dow Jones Industrial Average down -22.6% in a single day. He has published daily fact-based fundamental and technical analysis on high-ranked stocks online for two decades. Through FACTBASEDINVESTING.COM, Kenneth provides educational articles, news, market commentary, and other information regarding proven investment systems that work in good times and bad.
Comments contained in the body of this report are technical opinions only and are not necessarily those of Gruneisen Growth Corp. The material herein has been obtained from sources believed to be reliable and accurate, however, its accuracy and completeness cannot be guaranteed. Our firm, employees, and customers may effect transactions, including transactions contrary to any recommendation herein, or have positions in the securities mentioned herein or options with respect thereto. Any recommendation contained in this report may not be suitable for all investors and it is not to be deemed an offer or solicitation on our part with respect to the purchase or sale of any securities. |
|
 |
Retail, Financial, and Tech Indexes Lost Ground
Kenneth J. Gruneisen - Passed the CAN SLIM® Master's Exam
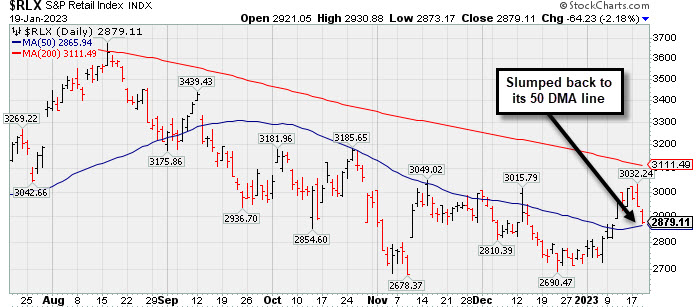
The Retail Index ($RLX -2.18%) created a drag on the major averages and financials also were weak as the Broker/Dealer Index ($XBD -1.38%) and Bank Index ($BKX -0.75%) both lost ground. The Semiconductor Index ($SOX -2.83%) led the tech sector lower while the Networking Index ($NWX -1.60%) and Biotech Index ($BTK -0.52%) suffered smaller losses. Commodity-linked groups had a positive bias as the Gold & Silver Index ($XAU +1.85%) and Integrated Oil Index ($XOI +1.53%) both outpaced the Oil Services Index ($OSX +0.33%).
PICTURED: The Retail Index ($RLX -2.18%) pulled back to its 50-day moving average (DMA) line. It recently stalled below its 200 DMA line.
| Oil Services |
$OSX |
89.74 |
+0.29 |
+0.33% |
+7.01% |
| Integrated Oil |
$XOI |
1,852.08 |
+27.88 |
+1.53% |
+3.63% |
| Semiconductor |
$SOX |
2,710.44 |
-79.03 |
-2.83% |
+7.04% |
| Networking |
$NWX |
796.45 |
-12.94 |
-1.60% |
+1.68% |
| Broker/Dealer |
$XBD |
470.29 |
-6.59 |
-1.38% |
+4.71% |
| Retail |
$RLX |
2,879.11 |
-64.23 |
-2.18% |
+4.54% |
| Gold & Silver |
$XAU |
133.59 |
+2.43 |
+1.85% |
+10.53% |
| Bank |
$BKX |
103.83 |
-0.79 |
-0.75% |
+2.96% |
| Biotech |
$BTK |
5,445.19 |
-28.45 |
-0.52% |
+3.11% |
|
|
|
 |
Showed Resilience Following Negative Reversal at 52-Week High
Kenneth J. Gruneisen - Passed the CAN SLIM® Master's Exam
Griffon Corporation (GFF -$0.21 or -0.54% to $38.36) finished near the session high today after early weakness. On the prior session there was a "negative reversal" at its 52-week high. After recent volume-driven gains its 50-day moving average (DMA) line ($35.62) defines important near-term support to watch above recent lows in the $33.82 area.
Fundamentals remain strong after it recently reported Sep '22 quarterly earnings +230% on +24% sales revenues versus the year ago period. It has a 99 Earnings Per Share Rating. Annual earnings (A criteria) growth has been strong and steady.
GFF was highlighted in yellow with new pivot point cited based on its 9/09/22 high plus 10 cents in the 11/11/22 mid-day report (read here). It was last shown in greater detail on 1/04/22 with an annotated graph under the headline, "Rose Above Max Buy Level With 4th Consecutive Gain".
The company has only 57.1 million shares outstanding (S criteria) which can contribute to greater volatility in the event of institutional buying or selling. The number of top-dated funds owning its shares rose from 331 in Mar '22 to 372 in Dec '22. Its current Up/Down Volume Ratio of 2.5 is an unbiased indication its shares have been under accumulation over the past 50 days. It has an A Timeliness rating and an A Sponsorship Rating.
|
|
|
Color Codes Explained :
Y - Better candidates highlighted by our
staff of experts.
G - Previously featured
in past reports as yellow but may no longer be buyable under the
guidelines.
***Last / Change / Volume data in this table is the closing quote data***
Symbol/Exchange
Company Name
Industry Group |
PRICE |
CHANGE
(%Change) |
Day High |
Volume
(% DAV)
(% 50 day avg vol) |
52 Wk Hi
% From Hi |
Featured
Date |
Price
Featured |
Pivot Featured |
|
Max Buy |
 CMC
-
NYSE
CMC
-
NYSE
Commercial Metals Co
METALS and MINING - Steel and Iron
|
$51.95
|
-0.78
-1.48% |
$52.71
|
1,184,058
117.82% of 50 DAV
50 DAV is 1,005,000
|
$56.88
-8.67%
|
10/14/2022
|
$41.61
|
PP = $44.45
|
|
MB = $46.67
|
Most Recent Note - 1/18/2023 5:15:40 PM
G - Suffered a larger loss today with higher volume after a "negative reversal" on the prior session at its 52-week high. Its 50 DMA line ($49.05) defines important near-term support to watch on pullbacks. Fundamentals remain strong. See the latest FSU analysis for more details and a new annotated graph.
>>> FEATURED STOCK ARTICLE : Pulling Back After Rallying From 50-Day Moving Average Line - 1/18/2023 |
View all notes |
Set NEW NOTE alert |
Company Profile |
SEC
News |
Chart |
Request a new note
C
A
S
I |
GPK
-
NYSE
Graphic Packaging Hldg
CONSUMER NON-DURABLES - Packaging and Containers
|
$22.15
|
-0.14
-0.63% |
$22.28
|
3,206,025
110.71% of 50 DAV
50 DAV is 2,896,000
|
$24.07
-7.98%
|
10/25/2022
|
$22.75
|
PP = $24.17
|
|
MB = $25.38
|
Most Recent Note - 1/17/2023 5:59:51 PM
Y - Consolidating near its 50 DMA line ($22.31) after recently finding support at its 200 DMA line ($21.71). More damaging losses may raise concerns. Faces some resistance due to overhead supply up to the $24 level. Fundamentals remain strong.
>>> FEATURED STOCK ARTICLE : Found Support at 200-Day Moving Average and Still Faces Resistance - 1/10/2023 |
View all notes |
Set NEW NOTE alert |
Company Profile |
SEC
News |
Chart |
Request a new note
C
A
S
I |
GFF
-
NYSE
Griffon Corporation
MATERIALS and CONSTRUCTION - General Building Materials
|
$38.36
|
-0.21
-0.54% |
$38.51
|
532,427
110.92% of 50 DAV
50 DAV is 480,000
|
$40.74
-5.84%
|
11/10/2022
|
$34.13
|
PP = $35.02
|
|
MB = $36.77
|
 Most Recent Note - 1/19/2023 6:15:46 PM
G - Showed resilience today and closed near the session high following a "negative reversal" at its 52-week high on the prior session. Its 50 DMA line ($35.62) defines near-term support above recent lows in the $33.82 area. Reported Sep '22 quarterly earnings +230% on +24% sales revenues versus the year ago period.
>>> FEATURED STOCK ARTICLE : Showed Resilience Following Negative Reversal at 52-Week High - 1/19/2023 |
View all notes |
Set NEW NOTE alert |
Company Profile |
SEC
News |
Chart |
Request a new note
C
A
S
I |
CPRX
-
NASDAQ
Catalyst Pharma Inc
Medical-Biomed/Biotech
|
$20.27
|
-0.16
-0.78% |
$20.90
|
1,329,939
52.80% of 50 DAV
50 DAV is 2,519,000
|
$22.11
-8.32%
|
11/22/2022
|
$17.38
|
PP = $16.66
|
|
MB = $17.49
|
Most Recent Note - 1/17/2023 5:56:55 PM
G - Pulled back from its 52-week high with today's loss following 4 consecutive gains. Its 50 DMA line ($17.26) defines near-term support to watch on pullbacks.
>>> FEATURED STOCK ARTICLE : Making Gradual Progress Hitting Another New High - 1/11/2023 |
View all notes |
Set NEW NOTE alert |
Company Profile |
SEC
News |
Chart |
Request a new note
C
A
S
I |
TITN
-
NASDAQ
Titan Machinery Inc
SPECIALTY RETAIL
|
$38.98
|
-1.83
-4.48% |
$40.70
|
213,865
91.01% of 50 DAV
50 DAV is 235,000
|
$44.35
-12.11%
|
1/13/2023
|
$40.10
|
PP = $44.45
|
|
MB = $46.67
|
Most Recent Note - 1/18/2023 5:18:53 PM
Y - Pulled back today with higher (near average) volume. The prior high in the $38 area defines important support to watch along with its 50 DMA line ($38.48)..A new pivot point was recently cited based on its 12/01/22 high plus 10 cents.
>>> FEATURED STOCK ARTICLE : Forming New Base for Past 7 Weeks - 1/13/2023 |
View all notes |
Set NEW NOTE alert |
Company Profile |
SEC
News |
Chart |
Request a new note
C
A
S
I |
Symbol/Exchange
Company Name
Industry Group |
PRICE |
CHANGE
(%Change) |
Day High |
Volume
(% DAV)
(% 50 day avg vol) |
52 Wk Hi
% From Hi |
Featured
Date |
Price
Featured |
Pivot Featured |
|
Max Buy |
MYE
-
NYSE
Myers Industries Inc
Containers/Packaging
|
$23.68
|
+0.14
0.59% |
$23.82
|
78,824
47.20% of 50 DAV
50 DAV is 167,000
|
$25.55
-7.32%
|
12/8/2022
|
$23.94
|
PP = $25.65
|
|
MB = $26.93
|
Most Recent Note - 1/19/2023 6:17:53 PM
Y - Managed a "positive reversal" today following a "negative reversal" on 1/17/23. Its 50 DMA line ($22.76) defines near-term support to watch. Faces little resistance due to overhead supply up to the $25.50 level.
>>> FEATURED STOCK ARTICLE : Pullback Testing 50-Day Moving Average Line - 1/5/2023 |
View all notes |
Set NEW NOTE alert |
Company Profile |
SEC
News |
Chart |
Request a new note
C
A
S
I |
BOX
-
NYSE
Box Inc Cl A
Computer Sftwr-Database
|
$30.54
|
-0.08
-0.26% |
$31.00
|
804,132
60.19% of 50 DAV
50 DAV is 1,336,000
|
$33.04
-7.57%
|
12/12/2022
|
$29.83
|
PP = $29.57
|
|
MB = $31.05
|
Most Recent Note - 1/18/2023 5:21:10 PM
Y - There was a "negative reversal today after early gains and it closed near the session low. Its 50 DMA line ($29.37) defines important near-term support to watch. Still faces some resistance due to overhead supply up to the $32 level. Quarterly and annual earnings increases have been strong and steady.
>>> FEATURED STOCK ARTICLE : Pulled Back After Perched Near All-Time High - 1/6/2023 |
View all notes |
Set NEW NOTE alert |
Company Profile |
SEC
News |
Chart |
Request a new note
C
A
S
I |
STRL
-
NASDAQ
Sterling Infrastructure
MATERIALS and; CONSTRUCTION - Heavy Construction
|
$31.45
|
-0.40
-1.26% |
$31.69
|
227,663
107.90% of 50 DAV
50 DAV is 211,000
|
$34.86
-9.78%
|
12/14/2022
|
$32.41
|
PP = $33.72
|
|
MB = $35.41
|
Most Recent Note - 1/17/2023 5:58:57 PM
Y - There was a "negative reversal" today for a loss with higher volume after early gains nearly challenging its prior high. Its 50 DMA line ($32.15) defines important support after its recent failed breakout attempt. Highlighted in yellow with pivot point cited based on its 11/08/22 high plus 10 cents in the 12/14/22 mid-day report. Confirming volume-driven gains for a new high would be a reassuring sign of fresh institutional buying demand.
>>> FEATURED STOCK ARTICLE : Finding Support Near 50-Day Moving Average After Failed Breakout Attempt - 1/9/2023 |
View all notes |
Set NEW NOTE alert |
Company Profile |
SEC
News |
Chart |
Request a new note
C
A
S
I |
|
|
|
THESE ARE NOT BUY RECOMMENDATIONS!
Comments contained in the body of this report are technical
opinions only. The material herein has been obtained
from sources believed to be reliable and accurate, however,
its accuracy and completeness cannot be guaranteed.
This site is not an investment advisor, hence it does
not endorse or recommend any securities or other investments.
Any recommendation contained in this report may not
be suitable for all investors and it is not to be deemed
an offer or solicitation on our part with respect to
the purchase or sale of any securities. All trademarks,
service marks and trade names appearing in this report
are the property of their respective owners, and are
likewise used for identification purposes only.
This report is a service available
only to active Paid Premium Members.
You may opt-out of receiving report notifications
at any time. Questions or comments may be submitted
by writing to Premium Membership Services 665 S.E. 10 Street, Suite 201 Deerfield Beach, FL 33441-5634 or by calling 1-800-965-8307
or 954-785-1121.
|
|
|