You are not logged in.
This means you
CAN ONLY VIEW reports that were published prior to Monday, March 24, 2025.
You
MUST UPGRADE YOUR MEMBERSHIP if you want to see any current reports.
AFTER MARKET UPDATE - WEDNESDAY, JANUARY 4TH, 2023
Previous After Market Report Next After Market Report >>>
|
|
|
|
DOW |
+133.40 |
33,269.77 |
+0.40% |
|
Volume |
980,440,215 |
+8% |
|
Volume |
5,096,523,600 |
+8% |
|
NASDAQ |
+71.78 |
10,458.76 |
+0.69% |
|
Advancers |
2,429 |
80% |
|
Advancers |
3,291 |
72% |
|
S&P 500 |
+28.83 |
3,852.97 |
+0.75% |
|
Decliners |
597 |
20% |
|
Decliners |
1,304 |
28% |
|
Russell 2000 |
+11.30 |
1,772.54 |
+0.64% |
|
52 Wk Highs |
65 |
|
|
52 Wk Highs |
102 |
|
|
S&P 600 |
+13.90 |
1,169.43 |
+1.20% |
|
52 Wk Lows |
19 |
|
|
52 Wk Lows |
57 |
|
|
The market is in a correction (M criteria). Thin leadership was a recent warning sign as weakness in the major averages was noted. Disciplined investors know to avoid new buying, reduce exposure and raise cash until a new confirmed rally with a solid follow-through day is noted.
|
 |
Breadth Positive as Major Indices Rose
Kenneth J. Gruneisen - Passed the CAN SLIM® Master's Exam
The Dow added 133 points, while the Nasdaq Composite increased 0.7%. The S&P 500 gained 0.8%. Volume totals were higher than the prior session on the NYSE and on the Nasdaq exchange. Advancers led decliners by a 4-1 margin on the NYSE and by almost a 3-1 margin on the Nasdaq exchange. There were 9 high-ranked companies from the Leaders List that hit new 52-week highs and were listed on the BreakOuts Page versus the total of 10 on the prior session. New 52-week highs outnumbered new 52-week lows on the NYSE and on the Nasdaq exchange. The market is in a correction (M criteria). Disciplined investors know to avoid new buying, reduce exposure and raise cash until a new confirmed rally with a solid follow-through day is noted.
Chart courtesy of www.stockcharts.com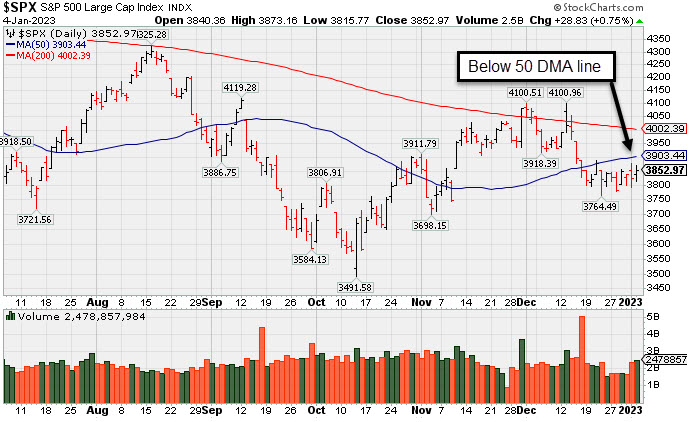 PICTURED: The S&P 500 Index has recently been sputtering below its 50 DMA line toward its October low.
U.S. equities slipped from their earlier highs but still finished in positive territory Wednesday following the release of the Federal Open Market Committee’s (FOMC) December meeting minutes. The minutes revealed a hawkish sentiment from central bank officials and showed plans for the Federal Reserve (Fed) to keep the higher rates until there is sufficient data proving inflation has eased. Meanwhile, Minneapolis Fed President Neel Kashkari announced he sees at least another percentage point increase to roughly 5.4% before the central bank backs off, topping fellow policymakers’ consensus of 5.1%. All eleven sectors in the S&P 500 finished in positive territory, with Real Estate pacing gains.
On the data front, Institute for Supply Management’s (ISM) manufacturing PMI slipped further into contractionary territory by coming in weaker-than-expected at 48.4 for December. Meanwhile, the Job Openings and Labor Turnover Survey (JOLTS) Job Openings data reported a slight decrease from October’s 10.51 million revised print to 10.46 million in November, beating estimates of 10.05 million.
Treasuries strengthened, with the yield on the benchmark 10-year note down 9 basis points (0.09%) to 3.68%, while the 30-year bond yield shed eight basis points (0.08%) to 3.79%. The yield on the more Fed-sensitive two-year note dipped two basis points (0.02%) to 4.36%. In commodities, West Texas Intermediate (WTI) crude plunged 4.9% to $73.17/barrel amid heightened demand concerns due to a darkening economic outlook and weak data from China. The U.S. Dollar Index paired earlier losses but decreased 0.3% as the Fed’s minutes may suggest more hikes to come.
|
 Kenneth J. Gruneisen started out as a licensed stockbroker in August 1987, a couple of months prior to the historic stock market crash that took the Dow Jones Industrial Average down -22.6% in a single day. He has published daily fact-based fundamental and technical analysis on high-ranked stocks online for two decades. Through FACTBASEDINVESTING.COM, Kenneth provides educational articles, news, market commentary, and other information regarding proven investment systems that work in good times and bad.
Comments contained in the body of this report are technical opinions only and are not necessarily those of Gruneisen Growth Corp. The material herein has been obtained from sources believed to be reliable and accurate, however, its accuracy and completeness cannot be guaranteed. Our firm, employees, and customers may effect transactions, including transactions contrary to any recommendation herein, or have positions in the securities mentioned herein or options with respect thereto. Any recommendation contained in this report may not be suitable for all investors and it is not to be deemed an offer or solicitation on our part with respect to the purchase or sale of any securities. |
|
 |
Gold & Silver, Tech, and Financial Indexes Rose
Kenneth J. Gruneisen - Passed the CAN SLIM® Master's Exam
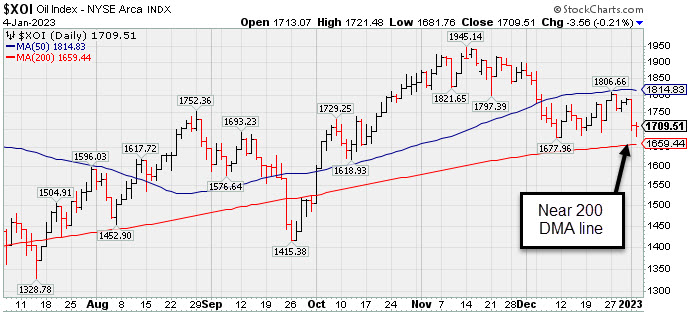
The Bank Index ($BKX +2.31%) and Broker/Dealer Index ($XBD +0.65%) posted gains and the Retail Index ($RLX +0.24%) edged higher. The Gold & Silver Index ($XAU +4.43%) was a standout gainer. The Oil Services Index ($OSX +1.02%) rose while the Integrated Oil Index ($XOI -0.21%) ended slightly in the red. The Semiconductor Index ($SOX +2.74%) and Biotech Index ($BTK +1.51%) posted solid gains while the Networking Index ($NWX -0.17%) ended slightly in the red
PICTURED: The Integrated Oil Index ($XOI -0.21%) recently has slumped near its 200-day moving average (DMA) line.
| Oil Services |
$OSX |
81.03 |
+0.82 |
+1.02% |
-3.38% |
| Integrated Oil |
$XOI |
1,709.51 |
-3.56 |
-0.21% |
-4.35% |
| Semiconductor |
$SOX |
2,569.46 |
+68.47 |
+2.74% |
+1.47% |
| Networking |
$NWX |
784.41 |
-1.35 |
-0.17% |
+0.14% |
| Broker/Dealer |
$XBD |
452.83 |
+2.91 |
+0.65% |
+0.82% |
| Retail |
$RLX |
2,784.41 |
+6.77 |
+0.24% |
+1.10% |
| Gold & Silver |
$XAU |
129.69 |
+5.50 |
+4.43% |
+7.31% |
| Bank |
$BKX |
103.81 |
+2.34 |
+2.31% |
+2.93% |
| Biotech |
$BTK |
5,332.64 |
+79.07 |
+1.51% |
+0.98% |
|
|
|
 |
Rose Above Max Buy Level With 4th Consecutive Gain
Kenneth J. Gruneisen - Passed the CAN SLIM® Master's Exam
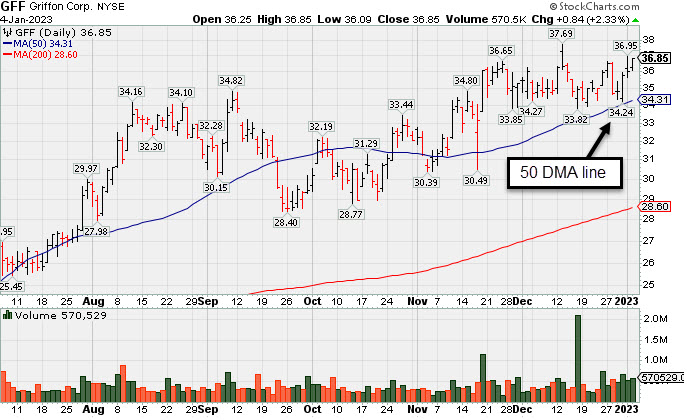
Griffon Corporation (GFF +$0.84 or +2.33% to $36.85)`posted a 4th consecutive gain today rising above its "max buy" level. It recently found support when consolidating near prior highs in the $34 area and above its 50-day moving average (DMA) line ($34.34).
Fundamentals remain strong after it recently reported Sep '22 quarterly earnings +230% on +24% sales revenues versus the year ago period. It has a 99 Earnings Per Share Rating. Annual earnings (A criteria) growth has been strong and steady.
GFF was highlighted in yellow with new pivot point cited based on its 9/09/22 high plus 10 cents in the 11/11/22 mid-day report (read here). It was last shown in greater detail on 12/07/22 with an annotated graph under the headline, "No Meaningful Progress After Breakout 3 Weeks Ago".
The company has only 57.1 million shares outstanding (S criteria) which can contribute to greater volatility in the event of institutional buying or selling. The number of top-dated funds owning its shares rose from 331 in Mar '22 to 367 in Dec '22. Its current Up/Down Volume Ratio of 2.1 is an unbiased indication its shares have been under accumulation over the past 50 days. It has an A Timeliness rating and an A Sponsorship Rating.
|
|
|
Color Codes Explained :
Y - Better candidates highlighted by our
staff of experts.
G - Previously featured
in past reports as yellow but may no longer be buyable under the
guidelines.
***Last / Change / Volume data in this table is the closing quote data***
Symbol/Exchange
Company Name
Industry Group |
PRICE |
CHANGE
(%Change) |
Day High |
Volume
(% DAV)
(% 50 day avg vol) |
52 Wk Hi
% From Hi |
Featured
Date |
Price
Featured |
Pivot Featured |
|
Max Buy |
 CMC
-
NYSE
CMC
-
NYSE
Commercial Metals Co
METALS and MINING - Steel and Iron
|
$49.00
|
+1.17
2.45% |
$49.28
|
1,041,320
105.18% of 50 DAV
50 DAV is 990,000
|
$50.83
-3.60%
|
10/14/2022
|
$41.61
|
PP = $44.45
|
|
MB = $46.67
|
Most Recent Note - 1/3/2023 5:13:17 PM
G - Volume was +23% above average behind today's loss while consolidating just above its 50 DMA line ($47.38) and prior highs in the $46 area defining important near-term support to watch. Fundamentals remain strong.
>>> FEATURED STOCK ARTICLE : Consolidating Above 50-Day Moving Average Line and Prior High - 1/3/2023 |
View all notes |
Set NEW NOTE alert |
Company Profile |
SEC
News |
Chart |
Request a new note
C
A
S
I |
GPK
-
NYSE
Graphic Packaging Hldg
CONSUMER NON-DURABLES - Packaging and Containers
|
$21.93
|
+0.20
0.92% |
$22.16
|
3,772,963
120.62% of 50 DAV
50 DAV is 3,128,000
|
$24.07
-8.89%
|
10/25/2022
|
$22.75
|
PP = $24.17
|
|
MB = $25.38
|
Most Recent Note - 1/3/2023 5:18:14 PM
G - Slumped near its 200 DMA line ($21.61) with today's loss on higher (near average) volume. Recently met resistance near its 50 DMA line ($22.36). Faces resistance due to overhead supply up to the $24 level. Fundamentals remain strong.
>>> FEATURED STOCK ARTICLE : Violated 50-Day Moving Average After Recently Failing to Break Out - 12/15/2022 |
View all notes |
Set NEW NOTE alert |
Company Profile |
SEC
News |
Chart |
Request a new note
C
A
S
I |
GFF
-
NYSE
Griffon Corporation
MATERIALS and CONSTRUCTION - General Building Materials
|
$36.85
|
+0.84
2.33% |
$36.85
|
604,729
140.96% of 50 DAV
50 DAV is 429,000
|
$37.69
-2.23%
|
11/10/2022
|
$34.13
|
PP = $35.02
|
|
MB = $36.77
|
 Most Recent Note - 1/4/2023 9:30:26 PM
G - Color code is changed to green after today's 4th consecutive gain and close above "max buy" level. Found support near prior highs in the $34 area and above its 50 DMA line ($34.35). Reported Sep '22 quarterly earnings +230% on +24% sales revenues versus the year ago period. See the latest FSU analysis for more details and a new annotated graph.
>>> FEATURED STOCK ARTICLE : Rose Above Max Buy Level With 4th Consecutive Gain - 1/4/2023 |
View all notes |
Set NEW NOTE alert |
Company Profile |
SEC
News |
Chart |
Request a new note
C
A
S
I |
CPRX
-
NASDAQ
Catalyst Pharma Inc
Medical-Biomed/Biotech
|
$18.55
|
+0.49
2.71% |
$18.75
|
1,712,331
71.71% of 50 DAV
50 DAV is 2,388,000
|
$19.78
-6.22%
|
11/22/2022
|
$17.38
|
PP = $16.66
|
|
MB = $17.49
|
Most Recent Note - 1/4/2023 2:55:03 PM
G - Posting a quiet gain today. Found prompt support near the prior high and well above its 50 DMA line ($16.32).
>>> FEATURED STOCK ARTICLE : Powerful Rally to New High for Catalyst - 12/20/2022 |
View all notes |
Set NEW NOTE alert |
Company Profile |
SEC
News |
Chart |
Request a new note
C
A
S
I |
TITN
-
NASDAQ
Titan Machinery Inc
SPECIALTY RETAIL
|
$39.67
|
+0.07
0.18% |
$40.19
|
190,830
87.94% of 50 DAV
50 DAV is 217,000
|
$44.35
-10.55%
|
11/30/2022
|
$40.10
|
PP = $38.68
|
|
MB = $40.61
|
Most Recent Note - 1/3/2023 12:46:18 PM
Y - Found support when recently consolidating near the prior high in the $38 area which defines initial support to watch above its 50 DMA line ($36.89). Fundamentals remain strong after reporting Oct '22 quarterly earnings +91% on +47% sales revenues.
>>> FEATURED STOCK ARTICLE : Found Support Near Prior High Following Breakout - 12/30/2022 |
View all notes |
Set NEW NOTE alert |
Company Profile |
SEC
News |
Chart |
Request a new note
C
A
S
I |
Symbol/Exchange
Company Name
Industry Group |
PRICE |
CHANGE
(%Change) |
Day High |
Volume
(% DAV)
(% 50 day avg vol) |
52 Wk Hi
% From Hi |
Featured
Date |
Price
Featured |
Pivot Featured |
|
Max Buy |
MYE
-
NYSE
Myers Industries Inc
Containers/Packaging
|
$22.74
|
+0.29
1.29% |
$23.08
|
124,926
73.92% of 50 DAV
50 DAV is 169,000
|
$25.55
-11.00%
|
12/8/2022
|
$23.94
|
PP = $25.65
|
|
MB = $26.93
|
Most Recent Note - 1/3/2023 5:19:45 PM
Y - Volume totals have been cooling while consolidating above its 50 DMA line ($21.85). Still faces resistance due to overhead supply up to the $25.50 level. Disciplined investors will note that it has failed thus far to produce the gains above the pivot point backed by at least +40% above average volume necessary to trigger a technical buy signal.
>>> FEATURED STOCK ARTICLE : Myers Industries on Track for 9th Straight Weekly Gain - 12/8/2022 |
View all notes |
Set NEW NOTE alert |
Company Profile |
SEC
News |
Chart |
Request a new note
C
A
S
I |
BOX
-
NYSE
Box Inc Cl A
Computer Sftwr-Database
|
$31.58
|
+0.27
0.86% |
$31.60
|
1,714,224
149.84% of 50 DAV
50 DAV is 1,144,000
|
$33.04
-4.42%
|
12/12/2022
|
$29.83
|
PP = $29.57
|
|
MB = $31.05
|
Most Recent Note - 1/3/2023 12:21:44 PM
G - Erased much of the session's early gain, still consolidating in a tight range near its "max buy" level. Faces little very resistance due to overhead supply up to the $33 level. Quarterly and annual earnings increases have been strong and steady.
>>> FEATURED STOCK ARTICLE : Volume Heavy Behind Breakout for Box Inc - 12/12/2022 |
View all notes |
Set NEW NOTE alert |
Company Profile |
SEC
News |
Chart |
Request a new note
C
A
S
I |
STRL
-
NASDAQ
Sterling Infrastructure
MATERIALS and; CONSTRUCTION - Heavy Construction
|
$33.36
|
-0.09
-0.27% |
$34.62
|
279,127
134.84% of 50 DAV
50 DAV is 207,000
|
$34.86
-4.30%
|
12/14/2022
|
$32.41
|
PP = $33.72
|
|
MB = $35.41
|
Most Recent Note - 1/3/2023 5:21:34 PM
Y - Finished the session in the bottom third of its intra-day range after hitting a new 52-week high with a gain backed by +241% above average volume. Highlighted in yellow with pivot point cited based on its 11/08/22 high plus 10 cents in the 12/14/22 mid-day report. Faces no resistance due to overhead supply. Prior mid-day reports noted - "Subsequent gains above the pivot point backed by at least +40% above average volume are needed to trigger a proper technical buy signal." New buying efforts are discouraged in all stocks while the market is in a correction. Disciplined investors will watch for a new confirmed uptrend with follow-through day to be noted.
>>> FEATURED STOCK ARTICLE : Sterling Infrastructure Forming Orderly Base Pattern - 12/14/2022 |
View all notes |
Set NEW NOTE alert |
Company Profile |
SEC
News |
Chart |
Request a new note
C
A
S
I |
|
|
|
THESE ARE NOT BUY RECOMMENDATIONS!
Comments contained in the body of this report are technical
opinions only. The material herein has been obtained
from sources believed to be reliable and accurate, however,
its accuracy and completeness cannot be guaranteed.
This site is not an investment advisor, hence it does
not endorse or recommend any securities or other investments.
Any recommendation contained in this report may not
be suitable for all investors and it is not to be deemed
an offer or solicitation on our part with respect to
the purchase or sale of any securities. All trademarks,
service marks and trade names appearing in this report
are the property of their respective owners, and are
likewise used for identification purposes only.
This report is a service available
only to active Paid Premium Members.
You may opt-out of receiving report notifications
at any time. Questions or comments may be submitted
by writing to Premium Membership Services 665 S.E. 10 Street, Suite 201 Deerfield Beach, FL 33441-5634 or by calling 1-800-965-8307
or 954-785-1121.
|
|
|