You are not logged in.
This means you
CAN ONLY VIEW reports that were published prior to Tuesday, March 25, 2025.
You
MUST UPGRADE YOUR MEMBERSHIP if you want to see any current reports.
AFTER MARKET UPDATE - FRIDAY, JANUARY 6TH, 2023
Previous After Market Report Next After Market Report >>>
|
|
|
|
DOW |
+700.53 |
33,630.61 |
+2.13% |
|
Volume |
824,029,698 |
-6% |
|
Volume |
5,165,842,800 |
+9% |
|
NASDAQ |
+264.05 |
10,569.29 |
+2.56% |
|
Advancers |
2,622 |
86% |
|
Advancers |
3,351 |
72% |
|
S&P 500 |
+86.98 |
3,895.08 |
+2.28% |
|
Decliners |
424 |
14% |
|
Decliners |
1,293 |
28% |
|
Russell 2000 |
+39.61 |
1,792.80 |
+2.26% |
|
52 Wk Highs |
79 |
|
|
52 Wk Highs |
131 |
|
|
S&P 600 |
+26.71 |
1,185.83 |
+2.30% |
|
52 Wk Lows |
25 |
|
|
52 Wk Lows |
101 |
|
|
The market is in a correction (M criteria). Disciplined investors know to avoid new buying, reduce exposure and raise cash until a new confirmed rally with a solid follow-through day is noted.
|
 |
Breadth Positive and Leadership Improved as Major Indices Rose
Kenneth J. Gruneisen - Passed the CAN SLIM® Master's Exam
The Dow added 700 points, while the Nasdaq Composite gained 2.6%. The S&P 500 increased 2.3% Volume totals were mixed, lighter than the prior session on the NYSE and higher on the Nasdaq exchange. Advancers led decliners by a 6-1 margin on the NYSE and nearly 3-1 on the Nasdaq exchange. Leadership improved as there were 25 high-ranked companies from the Leaders List that hit new 52-week highs and were listed on the BreakOuts Page versus the total of 10 on the prior session. New 52-week highs outnumbered new 52-week lows on the NYSE and on the Nasdaq exchange. The market is in a correction (M criteria). Disciplined investors know to avoid new buying, reduce exposure and raise cash until a new confirmed rally with a solid follow-through day is noted.
Chart courtesy of www.stockcharts.com PICTURED: The Nasdaq Composite Index posted a gain with higher volume after sputtering near its October low. The gain may best be considered Day 1 of a new rally attempt, not a valid follow-through day.
U.S. equities surged Friday after December’s job data reported a slightly weakening labor market. December’s nonfarm payrolls decreased slightly from November’s revised 256,000 print to 223,000 while wages grew slower-than-anticipated, increasing 0.3% in December versus the 0.4% estimated. Stocks continued to gain momentum throughout the day after December’s Institute for Supply Management (ISM) Services Index contracted more than expected showing signs that the Federal Reserve’s (Fed) rate hike policy may be working to ease inflation. All S&P 500 sectors finished in positive territory, with Materials pacing gains.
In the central bank space, Fed Governor Lisa Cook acknowledged signs of inflation cooling. However, she cited inflation remains way too high and needs to fall more to reach an acceptable level as the central bank remains concerned with the resilient labor market. Following suit, Richmond Fed President Thomas Barkin agreed that Fed officials need to keep working to bring inflation down but to do so “deliberately”.
Treasuries strengthened with the yield on the benchmark 10-year note down 15 basis points (0.15%) to 3.56%, while the 30-year bond yield dipped nine basis points (0.09%) to 3.69%. The yield on the two-year note, which is more sensitive to changes in Fed policy, declined 19 basis points (0.19%) to 4.26%. In commodities, West Texas Intermediate (WTI) crude was unchanged at $73.67/barrel as investors assess the volatility in the market from warmer weather, China’s reopening, and Saudi’s oil exports to Asia. In the metals complex, Gold increased 1.7% to its highest level since June amid a less-hawkish Fed.
|
 Kenneth J. Gruneisen started out as a licensed stockbroker in August 1987, a couple of months prior to the historic stock market crash that took the Dow Jones Industrial Average down -22.6% in a single day. He has published daily fact-based fundamental and technical analysis on high-ranked stocks online for two decades. Through FACTBASEDINVESTING.COM, Kenneth provides educational articles, news, market commentary, and other information regarding proven investment systems that work in good times and bad.
Comments contained in the body of this report are technical opinions only and are not necessarily those of Gruneisen Growth Corp. The material herein has been obtained from sources believed to be reliable and accurate, however, its accuracy and completeness cannot be guaranteed. Our firm, employees, and customers may effect transactions, including transactions contrary to any recommendation herein, or have positions in the securities mentioned herein or options with respect thereto. Any recommendation contained in this report may not be suitable for all investors and it is not to be deemed an offer or solicitation on our part with respect to the purchase or sale of any securities. |
|
 |
Retail, Financial, Tech, and Commodity-Linked Groups Rose
Kenneth J. Gruneisen - Passed the CAN SLIM® Master's Exam
The Retail Index ($RLX +2.33%), Broker/Dealer Index ($XBD +2.47%), and Bank Index ($BKX +2.54%) each posted a solid gain and had a positive influence on the major averages. The Semiconductor Index ($SOX +4.67%), Networking Index ($NWX +2.97%), and Biotech Index ($BTK +1.34%) posted gains. Commodity-linked groups also had a positive bias as the Gold & Silver Index ($XAU +2.44%), Oil Services Index ($OSX +3.19%), and Integrated Oil Index ($XOI +1.90%) posted unanimous gains.
PICTURED: The Bank Index ($BKX +2.54%) rebounded above its 50-day moving average (DMA) line toward its 200 DMA line.
| Oil Services |
$OSX |
85.14 |
+2.63 |
+3.19% |
+1.53% |
| Integrated Oil |
$XOI |
1,780.28 |
+33.13 |
+1.90% |
-0.39% |
| Semiconductor |
$SOX |
2,636.10 |
+117.58 |
+4.67% |
+4.11% |
| Networking |
$NWX |
798.88 |
+23.03 |
+2.97% |
+1.99% |
| Broker/Dealer |
$XBD |
462.76 |
+11.15 |
+2.47% |
+3.04% |
| Retail |
$RLX |
2,815.84 |
+64.20 |
+2.33% |
+2.25% |
| Gold & Silver |
$XAU |
132.04 |
+3.15 |
+2.44% |
+9.25% |
| Bank |
$BKX |
105.27 |
+2.61 |
+2.54% |
+4.38% |
| Biotech |
$BTK |
5,394.03 |
+71.24 |
+1.34% |
+2.14% |
|
|
|
 |
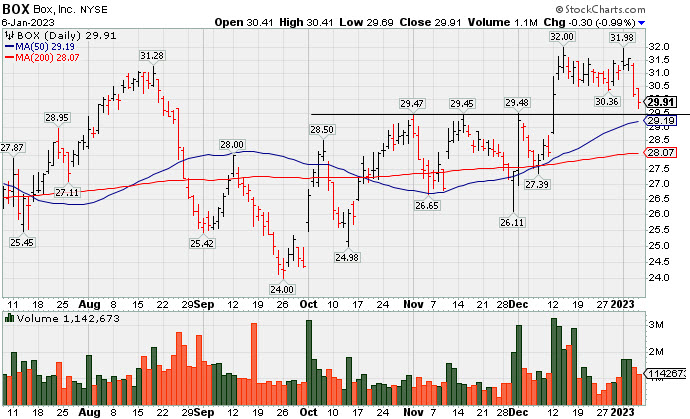
Pulled Back After Perched Near All-Time High
Kenneth J. Gruneisen - Passed the CAN SLIM® Master's Exam
Box Inc Cl A (BOX -$0.30 or -0.99% to $29.91) pulled back for a 2nd consecutive session. It hovered in a tight range and made little headway since highlighted in yellow with pivot point cited based on its 11/01/22 high plus 10 cents in the 12/12/22 mid-day report (read here). BOX was shown in greater detail that evening with an annotated graph under the headline, "Volume Heavy Behind Breakout for Box Inc". Members were reminded - <i>"Keep in mind it still faces some additional resistance due to overhead supply up to the $33 level."</i> In the interim, broader weakness in the market (M criteria) has also raised concerns.
BOX reported Sep '22 quarterly earnings +41% on +12% sales revenues over the year ago period, above the +25% minimum earnings guideline (C criteria) for the 3rd consecutive quarterly comparison. Quarterly and annual earnings increases have been strong and steady. It has a 97 Earnings Per Share Rating.
There are 142.9 million shares outstanding. The number of top-rated funds owning its shares rose from 468 in Dec '21 to 570 in Dec '22, a reassuring sign concerning the I criteria. Its current Up/Down Volume Ratio of 1.5 is an unbiased indication its shares have been under accumulation over the past 50 days.
|
|
|
Color Codes Explained :
Y - Better candidates highlighted by our
staff of experts.
G - Previously featured
in past reports as yellow but may no longer be buyable under the
guidelines.
***Last / Change / Volume data in this table is the closing quote data***
Symbol/Exchange
Company Name
Industry Group |
PRICE |
CHANGE
(%Change) |
Day High |
Volume
(% DAV)
(% 50 day avg vol) |
52 Wk Hi
% From Hi |
Featured
Date |
Price
Featured |
Pivot Featured |
|
Max Buy |
 CMC
-
NYSE
CMC
-
NYSE
Commercial Metals Co
METALS and MINING - Steel and Iron
|
$50.61
|
+1.45
2.95% |
$51.70
|
1,032,735
107.80% of 50 DAV
50 DAV is 958,000
|
$50.83
-0.43%
|
10/14/2022
|
$41.61
|
PP = $44.45
|
|
MB = $46.67
|
 Most Recent Note - 1/6/2023 11:15:12 AM
G - Hitting a new 52-week high with today's 3rd consecutive gain. Its 50 DMA line ($47.72) and prior low in the $46.50 area define important near-term support to watch on pullbacks. Fundamentals remain strong.
>>> FEATURED STOCK ARTICLE : Consolidating Above 50-Day Moving Average Line and Prior High - 1/3/2023 |
View all notes |
Set NEW NOTE alert |
Company Profile |
SEC
News |
Chart |
Request a new note
C
A
S
I |
GPK
-
NYSE
Graphic Packaging Hldg
CONSUMER NON-DURABLES - Packaging and Containers
|
$22.82
|
+0.73
3.30% |
$22.89
|
2,267,845
72.73% of 50 DAV
50 DAV is 3,118,000
|
$24.07
-5.19%
|
10/25/2022
|
$22.75
|
PP = $24.17
|
|
MB = $25.38
|
Most Recent Note - 1/6/2023 3:55:23 PM
Y - Color code is changed to yellow after gapping up today and rebounding above the 50 DMA line ($22.39) helping its outlook improve. Faces some resistance due to overhead supply up to the $24 level. Fundamentals remain strong.
>>> FEATURED STOCK ARTICLE : Violated 50-Day Moving Average After Recently Failing to Break Out - 12/15/2022 |
View all notes |
Set NEW NOTE alert |
Company Profile |
SEC
News |
Chart |
Request a new note
C
A
S
I |
GFF
-
NYSE
Griffon Corporation
MATERIALS and CONSTRUCTION - General Building Materials
|
$36.09
|
+1.07
3.06% |
$36.55
|
432,040
99.32% of 50 DAV
50 DAV is 435,000
|
$37.69
-4.25%
|
11/10/2022
|
$34.13
|
PP = $35.02
|
|
MB = $36.77
|
Most Recent Note - 1/6/2023 3:53:54 PM
Y - Quietly consolidating just below its "max buy" level. Its 50 DMA line ($34.50) defines near-term support above recent lows in the $33.82 area. Reported Sep '22 quarterly earnings +230% on +24% sales revenues versus the year ago period.
>>> FEATURED STOCK ARTICLE : Rose Above Max Buy Level With 4th Consecutive Gain - 1/4/2023 |
View all notes |
Set NEW NOTE alert |
Company Profile |
SEC
News |
Chart |
Request a new note
C
A
S
I |
CPRX
-
NASDAQ
Catalyst Pharma Inc
Medical-Biomed/Biotech
|
$19.60
|
+0.77
4.09% |
$20.51
|
3,049,057
128.27% of 50 DAV
50 DAV is 2,377,000
|
$19.78
-0.91%
|
11/22/2022
|
$17.38
|
PP = $16.66
|
|
MB = $17.49
|
Most Recent Note - 1/6/2023 11:16:53 AM
G - Hitting a new 52-week high with today's 3rd consecutive gain. Its 50 DMA line ($16.52) defines near-term support to watch on pullbacks..
>>> FEATURED STOCK ARTICLE : Powerful Rally to New High for Catalyst - 12/20/2022 |
View all notes |
Set NEW NOTE alert |
Company Profile |
SEC
News |
Chart |
Request a new note
C
A
S
I |
TITN
-
NASDAQ
Titan Machinery Inc
SPECIALTY RETAIL
|
$41.34
|
+1.22
3.04% |
$41.61
|
336,844
152.42% of 50 DAV
50 DAV is 221,000
|
$44.35
-6.79%
|
11/30/2022
|
$40.10
|
PP = $38.68
|
|
MB = $40.61
|
Most Recent Note - 1/6/2023 3:57:27 PM
Y - Posting a 3rd consecutive gain today with higher volume. Found support when recently consolidating near the prior high in the $38 area which defines initial support to watch above its 50 DMA line ($37.35). Fundamentals remain strong after reporting Oct '22 quarterly earnings +91% on +47% sales revenues.
>>> FEATURED STOCK ARTICLE : Found Support Near Prior High Following Breakout - 12/30/2022 |
View all notes |
Set NEW NOTE alert |
Company Profile |
SEC
News |
Chart |
Request a new note
C
A
S
I |
Symbol/Exchange
Company Name
Industry Group |
PRICE |
CHANGE
(%Change) |
Day High |
Volume
(% DAV)
(% 50 day avg vol) |
52 Wk Hi
% From Hi |
Featured
Date |
Price
Featured |
Pivot Featured |
|
Max Buy |
MYE
-
NYSE
Myers Industries Inc
Containers/Packaging
|
$22.72
|
+0.67
3.04% |
$22.87
|
173,805
101.64% of 50 DAV
50 DAV is 171,000
|
$25.55
-11.08%
|
12/8/2022
|
$23.94
|
PP = $25.65
|
|
MB = $26.93
|
Most Recent Note - 1/6/2023 3:56:34 PM
Y - Posting a gain today with below average volume after testing its 50 DMA line ($22.13) on the prior session. More damaging losses would trigger a technical sell signal. Still faces resistance due to overhead supply up to the $25.50 level. See the latest FSU analysis for more details and an annotated graph.
>>> FEATURED STOCK ARTICLE : Pullback Testing 50-Day Moving Average Line - 1/5/2023 |
View all notes |
Set NEW NOTE alert |
Company Profile |
SEC
News |
Chart |
Request a new note
C
A
S
I |
BOX
-
NYSE
Box Inc Cl A
Computer Sftwr-Database
|
$29.91
|
-0.30
-0.99% |
$30.41
|
1,142,674
97.25% of 50 DAV
50 DAV is 1,175,000
|
$33.04
-9.47%
|
12/12/2022
|
$29.83
|
PP = $29.57
|
|
MB = $31.05
|
Most Recent Note - 1/5/2023 5:38:27 PM
Y - Slumped for a bigger loss today after trading in a tight range for the past 3 weeks and its color code is changed to yellow while pulling back below its "max buy" level. Faces some resistance due to overhead supply up to the $33 level. Quarterly and annual earnings increases have been strong and steady.
>>> FEATURED STOCK ARTICLE : Pulled Back After Perched Near All-Time High - 1/6/2023 |
View all notes |
Set NEW NOTE alert |
Company Profile |
SEC
News |
Chart |
Request a new note
C
A
S
I |
STRL
-
NASDAQ
Sterling Infrastructure
MATERIALS and; CONSTRUCTION - Heavy Construction
|
$31.98
|
+0.37
1.17% |
$32.21
|
194,838
91.90% of 50 DAV
50 DAV is 212,000
|
$34.86
-8.26%
|
12/14/2022
|
$32.41
|
PP = $33.72
|
|
MB = $35.41
|
Most Recent Note - 1/5/2023 5:35:19 PM
Y - Abruptly retreating from its 52-week high with 2 consecutive losses back by above average volume. Highlighted in yellow with pivot point cited based on its 11/08/22 high plus 10 cents in the 12/14/22 mid-day report. Faces no resistance due to overhead supply. Prior mid-day reports noted - "Subsequent gains above the pivot point backed by at least +40% above average volume are needed to trigger a proper technical buy signal." New buying efforts are discouraged in all stocks while the market is in a correction. Disciplined investors will watch for a new confirmed uptrend with follow-through day to be noted.
>>> FEATURED STOCK ARTICLE : Sterling Infrastructure Forming Orderly Base Pattern - 12/14/2022 |
View all notes |
Set NEW NOTE alert |
Company Profile |
SEC
News |
Chart |
Request a new note
C
A
S
I |
|
|
|
THESE ARE NOT BUY RECOMMENDATIONS!
Comments contained in the body of this report are technical
opinions only. The material herein has been obtained
from sources believed to be reliable and accurate, however,
its accuracy and completeness cannot be guaranteed.
This site is not an investment advisor, hence it does
not endorse or recommend any securities or other investments.
Any recommendation contained in this report may not
be suitable for all investors and it is not to be deemed
an offer or solicitation on our part with respect to
the purchase or sale of any securities. All trademarks,
service marks and trade names appearing in this report
are the property of their respective owners, and are
likewise used for identification purposes only.
This report is a service available
only to active Paid Premium Members.
You may opt-out of receiving report notifications
at any time. Questions or comments may be submitted
by writing to Premium Membership Services 665 S.E. 10 Street, Suite 201 Deerfield Beach, FL 33441-5634 or by calling 1-800-965-8307
or 954-785-1121.
|
|
|