You are not logged in.
This means you
CAN ONLY VIEW reports that were published prior to Saturday, March 1, 2025.
You
MUST UPGRADE YOUR MEMBERSHIP if you want to see any current reports.
AFTER MARKET UPDATE - THURSDAY, JANUARY 12TH, 2023
Previous After Market Report Next After Market Report >>>
|
|
|
|
DOW |
+216.96 |
34,189.97 |
+0.64% |
|
Volume |
870,913,244 |
+0% |
|
Volume |
5,662,728,800 |
+7% |
|
NASDAQ |
+69.43 |
11,001.10 |
+0.64% |
|
Advancers |
2,305 |
76% |
|
Advancers |
3,264 |
71% |
|
S&P 500 |
+13.56 |
3,983.17 |
+0.34% |
|
Decliners |
708 |
23% |
|
Decliners |
1,312 |
29% |
|
Russell 2000 |
+21.40 |
1,844.05 |
+1.17% |
|
52 Wk Highs |
108 |
|
|
52 Wk Highs |
145 |
|
|
S&P 600 |
+17.36 |
1,231.93 |
+1.43% |
|
52 Wk Lows |
12 |
|
|
52 Wk Lows |
26 |
|
|
The solid gain from the Nasdaq Composite Index on Wednesday was marked by higher volume and an expansion in the new highs list. This was a follow-through day that confirmed a new market uptrend (M criteria).
|
 |
Breadth Positive and Leadership Improved Behind Gains
Kenneth J. Gruneisen - Passed the CAN SLIM® Master's Exam
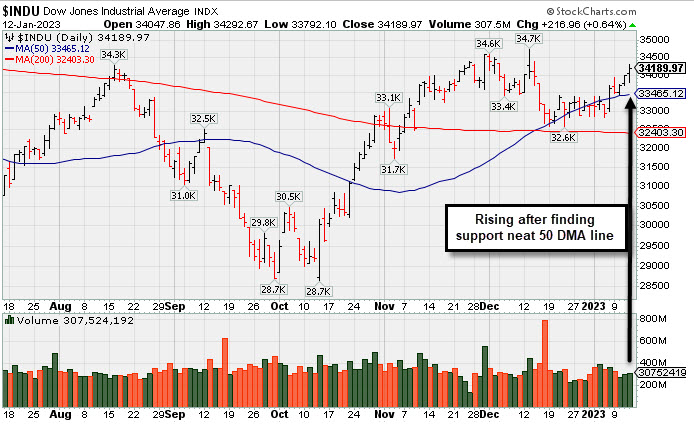
The Dow added 216 points, while the Nasdaq Composite climbed 0.6%. The S&P 500 advanced 0.3%. Volume totals were higher than the prior session on the NYSE and on the Nasdaq exchange. Advancers led decliners by more than a 3-1 margin on the NYSE and 2-1 on the Nasdaq exchange. There were 37 high-ranked companies from the Leaders List that hit new 52-week highs and were listed on the BreakOuts Page versus the total of 22 on the prior session. New 52-week highs totals expanded and outnumbered new 52-week lows on the NYSE and on the Nasdaq exchange. The solid gain marked a follow-through day confirming a new uptrend for the major indices (M criteria).
PICTURED: The Dow Jones Industrial Average has been rising after finding support near its 50-day moving average line.
U.S. equities finished higher Thursday as investors digested December’s Consumer Price Index (CPI) data. The report showed consumer prices eased for the sixth-straight month, signaling the Federal Reserve (Fed) may be able to downshift the pace of rate hikes at their next policy meeting. The CPI fell 0.1% month-over-month, down from November’s 0.1% monthly gain. Core CPI (which excludes the more volatile food and energy prices) accelerated 0.3% month-over-month, a slight increase from the prior month’s 0.2% rise. Meanwhile headline CPI eased to a 6.5% annualized rate from November’s 7.1% print, while core CPI notched a 5.7% annual gain. The report cited a dip in energy prices while shelter, food, and clothing all notched increases.
Elsewhere on the data front, initial jobless claims for the week ended January 7 came in at 205,000, below estimates of a 215,000 print. The figure indicates the labor market remains tights, which could push the Federal Reserve (Fed) to keep interest rates higher for longer.
Treasuries strengthened after the report, with the yield on the benchmark 10-year note shedding 11 basis points (0.11%) to 3.42%, while the 30-year bond yield declined 10 basis points (0.10%) to 3.55%. The yield on the two-year note, which is more sensitive to changes in Fed policy, fell nine basis points (0.09%) to 4.12%. In commodities, West Texas Intermediate (WTI) crude climbed 1% to $78.20/barrel amid optimism over China’s demand outlook. The U.S. Dollar Index slipped 0.9%, adding further support to commodity prices. |
 Kenneth J. Gruneisen started out as a licensed stockbroker in August 1987, a couple of months prior to the historic stock market crash that took the Dow Jones Industrial Average down -22.6% in a single day. He has published daily fact-based fundamental and technical analysis on high-ranked stocks online for two decades. Through FACTBASEDINVESTING.COM, Kenneth provides educational articles, news, market commentary, and other information regarding proven investment systems that work in good times and bad.
Comments contained in the body of this report are technical opinions only and are not necessarily those of Gruneisen Growth Corp. The material herein has been obtained from sources believed to be reliable and accurate, however, its accuracy and completeness cannot be guaranteed. Our firm, employees, and customers may effect transactions, including transactions contrary to any recommendation herein, or have positions in the securities mentioned herein or options with respect thereto. Any recommendation contained in this report may not be suitable for all investors and it is not to be deemed an offer or solicitation on our part with respect to the purchase or sale of any securities. |
|
 |
Financial, Tech, and Commodity-Linked Groups Rose
Kenneth J. Gruneisen - Passed the CAN SLIM® Master's Exam
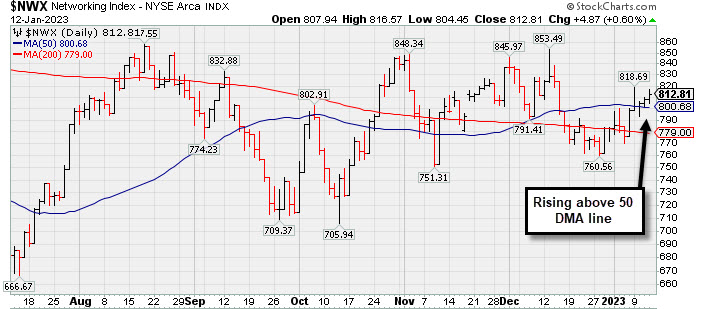
The Broker/Dealer Index ($XBD +1.14%) and Bank Index ($BKX +0.54%) both posted gains while the Retail Index ($RLX -0.04%) finished flat. The Semiconductor Index ($SOX +1.24%) outpaced the Biotech Index ($BTK +0.68%) and the Networking Index ($NWX +0.60%). The Oil Services Index ($OSX +2.48%), Integrated Oil Index ($XOI +2.10%), and Gold & Silver Index ($XAU +1.52%) posted unanimous gains.
PICTURED: The Networking Index ($NWX +0.60%) rose above its 50-day moving average (DMA) line with recent gains.
| Oil Services |
$OSX |
90.66 |
+2.20 |
+2.48% |
+8.11% |
| Integrated Oil |
$XOI |
1,836.05 |
+37.82 |
+2.10% |
+2.73% |
| Semiconductor |
$SOX |
2,789.65 |
+34.29 |
+1.24% |
+10.17% |
| Networking |
$NWX |
812.81 |
+4.87 |
+0.60% |
+3.77% |
| Broker/Dealer |
$XBD |
477.57 |
+5.39 |
+1.14% |
+6.33% |
| Retail |
$RLX |
2,964.21 |
-1.30 |
-0.04% |
+7.63% |
| Gold & Silver |
$XAU |
135.10 |
+2.02 |
+1.52% |
+11.78% |
| Bank |
$BKX |
106.89 |
+0.58 |
+0.54% |
+5.99% |
| Biotech |
$BTK |
5,506.95 |
+37.03 |
+0.68% |
+4.28% |
|
|
|
 |
Featured Stocks
Kenneth J. Gruneisen - Passed the CAN SLIM® Master's Exam
|
|
|
Color Codes Explained :
Y - Better candidates highlighted by our
staff of experts.
G - Previously featured
in past reports as yellow but may no longer be buyable under the
guidelines.
***Last / Change / Volume data in this table is the closing quote data***
Symbol/Exchange
Company Name
Industry Group |
PRICE |
CHANGE
(%Change) |
Day High |
Volume
(% DAV)
(% 50 day avg vol) |
52 Wk Hi
% From Hi |
Featured
Date |
Price
Featured |
Pivot Featured |
|
Max Buy |
 CMC
-
NYSE
CMC
-
NYSE
Commercial Metals Co
METALS and MINING - Steel and Iron
|
$55.88
|
-0.29
-0.52% |
$56.60
|
1,301,044
132.76% of 50 DAV
50 DAV is 980,000
|
$56.20
-0.57%
|
10/14/2022
|
$41.61
|
PP = $44.45
|
|
MB = $46.67
|
Most Recent Note - 1/11/2023 7:38:36 PM
G - Hit yet another new 52-week high with today's big gain. Its 50 DMA line ($48.22) and prior low in the $46.50 area define important near-term support to watch on pullbacks. Fundamentals remain strong.
>>> FEATURED STOCK ARTICLE : Consolidating Above 50-Day Moving Average Line and Prior High - 1/3/2023 |
View all notes |
Set NEW NOTE alert |
Company Profile |
SEC
News |
Chart |
Request a new note
C
A
S
I |
GPK
-
NYSE
Graphic Packaging Hldg
CONSUMER NON-DURABLES - Packaging and Containers
|
$22.55
|
+0.50
2.27% |
$22.57
|
2,238,743
77.87% of 50 DAV
50 DAV is 2,875,100
|
$24.07
-6.31%
|
10/25/2022
|
$22.75
|
PP = $24.17
|
|
MB = $25.38
|
Most Recent Note - 1/10/2023 4:56:18 PM
Y - Consolidating near its 50 DMA line ($22.35) after recently finding support at its 200 DMA line ($21.67). More damaging losses may raise concerns. Faces some resistance due to overhead supply up to the $24 level. Fundamentals remain strong. See the latest FSU analysis for more details and a new annotated graph.
>>> FEATURED STOCK ARTICLE : Found Support at 200-Day Moving Average and Still Faces Resistance - 1/10/2023 |
View all notes |
Set NEW NOTE alert |
Company Profile |
SEC
News |
Chart |
Request a new note
C
A
S
I |
GFF
-
NYSE
Griffon Corporation
MATERIALS and CONSTRUCTION - General Building Materials
|
$38.30
|
-0.50
-1.29% |
$39.00
|
438,600
95.14% of 50 DAV
50 DAV is 461,000
|
$39.77
-3.70%
|
11/10/2022
|
$34.13
|
PP = $35.02
|
|
MB = $36.77
|
Most Recent Note - 1/9/2023 1:25:35 PM
G - Hitting a new high and rising above its "max buy" level with today's big volume-driven gain and its color code is changed to green. Its 50 DMA line ($34.61) defines near-term support above recent lows in the $33.82 area. Reported Sep '22 quarterly earnings +230% on +24% sales revenues versus the year ago period.
>>> FEATURED STOCK ARTICLE : Rose Above Max Buy Level With 4th Consecutive Gain - 1/4/2023 |
View all notes |
Set NEW NOTE alert |
Company Profile |
SEC
News |
Chart |
Request a new note
C
A
S
I |
CPRX
-
NASDAQ
Catalyst Pharma Inc
Medical-Biomed/Biotech
|
$20.97
|
+1.16
5.86% |
$21.15
|
2,713,494
111.16% of 50 DAV
50 DAV is 2,441,000
|
$20.60
1.80%
|
11/22/2022
|
$17.38
|
PP = $16.66
|
|
MB = $17.49
|
 Most Recent Note - 1/12/2023 8:30:29 PM
G - Hit another new 52-week high with today's 3rd consecutive gain. Its 50 DMA line ($16.98) defines near-term support to watch on pullbacks. See the latest FSU analysis for more details and an annotated graph.
>>> FEATURED STOCK ARTICLE : Making Gradual Progress Hitting Another New High - 1/11/2023 |
View all notes |
Set NEW NOTE alert |
Company Profile |
SEC
News |
Chart |
Request a new note
C
A
S
I |
TITN
-
NASDAQ
Titan Machinery Inc
SPECIALTY RETAIL
|
$42.20
|
+0.45
1.08% |
$43.00
|
184,879
80.38% of 50 DAV
50 DAV is 230,000
|
$44.35
-4.85%
|
11/30/2022
|
$40.10
|
PP = $38.68
|
|
MB = $40.61
|
Most Recent Note - 1/10/2023 1:35:28 PM
G - Color code is changed to green while rising back above its "max buy" level. Found support when recently consolidating near the prior high in the $38 area which defines initial support to watch above its 50 DMA line ($37.70). Fundamentals remain strong.
>>> FEATURED STOCK ARTICLE : Found Support Near Prior High Following Breakout - 12/30/2022 |
View all notes |
Set NEW NOTE alert |
Company Profile |
SEC
News |
Chart |
Request a new note
C
A
S
I |
Symbol/Exchange
Company Name
Industry Group |
PRICE |
CHANGE
(%Change) |
Day High |
Volume
(% DAV)
(% 50 day avg vol) |
52 Wk Hi
% From Hi |
Featured
Date |
Price
Featured |
Pivot Featured |
|
Max Buy |
MYE
-
NYSE
Myers Industries Inc
Containers/Packaging
|
$24.33
|
+0.44
1.84% |
$24.35
|
100,342
59.37% of 50 DAV
50 DAV is 169,000
|
$25.55
-4.77%
|
12/8/2022
|
$23.94
|
PP = $25.65
|
|
MB = $26.93
|
Most Recent Note - 1/9/2023 7:40:02 PM
Y - Posted a 2nd consecutive gain today with below average volume after testing its 50 DMA line ($22.24) last week. More damaging losses would trigger a technical sell signal. Still faces resistance due to overhead supply up to the $25.50 level.
>>> FEATURED STOCK ARTICLE : Pullback Testing 50-Day Moving Average Line - 1/5/2023 |
View all notes |
Set NEW NOTE alert |
Company Profile |
SEC
News |
Chart |
Request a new note
C
A
S
I |
BOX
-
NYSE
Box Inc Cl A
Computer Sftwr-Database
|
$29.67
|
+0.96
3.34% |
$29.83
|
1,780,342
139.01% of 50 DAV
50 DAV is 1,280,700
|
$32.00
-7.28%
|
12/12/2022
|
$29.83
|
PP = $29.57
|
|
MB = $31.05
|
Most Recent Note - 1/12/2023 8:29:14 PM
Y - Color code is changed to yellow after rebounding above the 50 DMA line ($29.21) helping its outlook improve. Still faces resistance due to overhead supply up to the $32 level. Quarterly and annual earnings increases have been strong and steady.
>>> FEATURED STOCK ARTICLE : Pulled Back After Perched Near All-Time High - 1/6/2023 |
View all notes |
Set NEW NOTE alert |
Company Profile |
SEC
News |
Chart |
Request a new note
C
A
S
I |
STRL
-
NASDAQ
Sterling Infrastructure
MATERIALS and; CONSTRUCTION - Heavy Construction
|
$33.17
|
+0.35
1.07% |
$33.39
|
221,824
102.22% of 50 DAV
50 DAV is 217,000
|
$34.86
-4.85%
|
12/14/2022
|
$32.41
|
PP = $33.72
|
|
MB = $35.41
|
Most Recent Note - 1/9/2023 7:37:29 PM
Y - Testing support at its 50 DMA line ($31.66) after its recent failed breakout attempt. Highlighted in yellow with pivot point cited based on its 11/08/22 high plus 10 cents in the 12/14/22 mid-day report. See the latest FSU analysis for more details and a new annotated graph. New buying efforts are discouraged in all stocks while the market is in a correction. Disciplined investors will watch for a new confirmed uptrend with follow-through day to be noted.
>>> FEATURED STOCK ARTICLE : Finding Support Near 50-Day Moving Average After Failed Breakout Attempt - 1/9/2023 |
View all notes |
Set NEW NOTE alert |
Company Profile |
SEC
News |
Chart |
Request a new note
C
A
S
I |
|
|
|
THESE ARE NOT BUY RECOMMENDATIONS!
Comments contained in the body of this report are technical
opinions only. The material herein has been obtained
from sources believed to be reliable and accurate, however,
its accuracy and completeness cannot be guaranteed.
This site is not an investment advisor, hence it does
not endorse or recommend any securities or other investments.
Any recommendation contained in this report may not
be suitable for all investors and it is not to be deemed
an offer or solicitation on our part with respect to
the purchase or sale of any securities. All trademarks,
service marks and trade names appearing in this report
are the property of their respective owners, and are
likewise used for identification purposes only.
This report is a service available
only to active Paid Premium Members.
You may opt-out of receiving report notifications
at any time. Questions or comments may be submitted
by writing to Premium Membership Services 665 S.E. 10 Street, Suite 201 Deerfield Beach, FL 33441-5634 or by calling 1-800-965-8307
or 954-785-1121.
|
|
|