You are not logged in.
This means you
CAN ONLY VIEW reports that were published prior to Thursday, March 20, 2025.
You
MUST UPGRADE YOUR MEMBERSHIP if you want to see any current reports.
AFTER MARKET UPDATE - WEDNESDAY, DECEMBER 13TH, 2023
Previous After Market Report Next After Market Report >>>
|
|
|
|
DOW |
+512.30 |
37,090.24 |
+1.40% |
|
Volume |
1,302,622,694 |
+49% |
|
Volume |
6,812,598,400 |
+37% |
|
NASDAQ |
+200.57 |
14,733.96 |
+1.38% |
|
Advancers |
2,491 |
89% |
|
Advancers |
3,303 |
76% |
|
S&P 500 |
+63.39 |
4,707.09 |
+1.37% |
|
Decliners |
305 |
11% |
|
Decliners |
1,038 |
24% |
|
Russell 2000 |
+66.24 |
1,947.51 |
+3.52% |
|
52 Wk Highs |
249 |
|
|
52 Wk Highs |
350 |
|
|
S&P 600 |
+41.01 |
1,265.38 |
+3.35% |
|
52 Wk Lows |
23 |
|
|
52 Wk Lows |
173 |
|
|
 |
Major Indices Rallied as Treasury Yields Sank Abruptly
Kenneth J. Gruneisen - Passed the CAN SLIM® Master's Exam
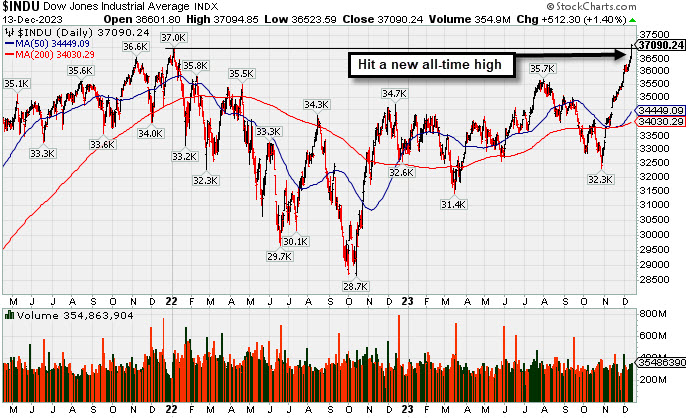
The S&P 500 closed above 4,700 at its highest level since January 2022 as the Nasdaq Composite Index also rose and the Dow Industrials hit a new record high. Volume was reported higher than the prior session totals on the NYSE and on the Nasdaq exchange, action indicative of an increase in institutional buying demand. Breadth was clearly positive as advancers led decliners by an 8-1 margin on the NYSE and by about a 3-1 margin on the Nasdaq exchange. There were 159 high-ranked companies from the Leaders List that hit new 52-week highs and were listed on the BreakOuts Page, versus the total of 109 on the prior session. New 52-week highs totals expanded and outnumbered new 52-week lows on the NYSE and on the Nasdaq exchange. The major indices are in a confirmed uptrend (M criteria). New buying efforts should be only made in stocks fitting all key criteria of the fact-based investment system.
PICTURED: The Dow Jones Industrial Average (+1.4%) surged more than 500 point to finish at a new all-time high. Disinflation was seen in the November Producer Price Index. Buying demand picked up immediately after news that the FOMC voted unanimously to leave the target range for the fed funds rate unchanged at 5.25-5.50%. The updated Summary of Economic Projections featured an improved growth outlook for 2023, a lowered inflation outlook for 2023 and 2024, and a median estimate of three rate cuts in 2024 versus a previous estimate of two rate cuts. Fed Chair Powell acknowledged in his press conference that the FOMC discussed when it will become appropriate to begin dialing back its policy restraint.
All 11 S&P 500 sectors posted gains ranging from 0.7% (communication services) to 3.7% (utilities). Meanwhile, the 2-yr note yield plunged 28 basis points to 4.46% and the 10-yr note yield sank 18 basis points to 4.02%.
|
 Kenneth J. Gruneisen started out as a licensed stockbroker in August 1987, a couple of months prior to the historic stock market crash that took the Dow Jones Industrial Average down -22.6% in a single day. He has published daily fact-based fundamental and technical analysis on high-ranked stocks online for two decades. Through FACTBASEDINVESTING.COM, Kenneth provides educational articles, news, market commentary, and other information regarding proven investment systems that work in good times and bad.
Comments contained in the body of this report are technical opinions only and are not necessarily those of Gruneisen Growth Corp. The material herein has been obtained from sources believed to be reliable and accurate, however, its accuracy and completeness cannot be guaranteed. Our firm, employees, and customers may effect transactions, including transactions contrary to any recommendation herein, or have positions in the securities mentioned herein or options with respect thereto. Any recommendation contained in this report may not be suitable for all investors and it is not to be deemed an offer or solicitation on our part with respect to the purchase or sale of any securities. |
|
 |
Gold & Silver, Biotech, and Bank Indexes Led Widespread Gains
Kenneth J. Gruneisen - Passed the CAN SLIM® Master's Exam
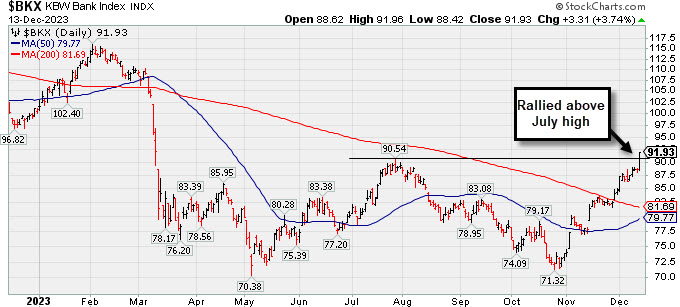
The Bank Index ($BKX +3.74%) posted a big gain outpacing the Broker/Dealer Index ($XBD +1.14%) and the Retail Index ($RLX +1.47%). The tech sector had a positive bias and was led higher by the Biotech Index ($BTK +4.28%) while the Semiconductor Index ($SOX +1.55%) and Networking Index ($NWX +2.65%) also posted gains. Commodity-linked groups also rallied as the Gold & Silver Index ($XAU +6.25%) outpaced the Integrated Oil Index ($XOI +1.72%) and the Oil Services Index ($OSX +2.36%).
PICTURED: The Bank Index ($BKX +3.74%) rallied to a new 2023 high.
| Oil Services |
$OSX |
79.62 |
+1.84 |
+2.36% |
-5.05% |
| Integrated Oil |
$XOI |
1,803.83 |
+30.56 |
+1.72% |
+0.93% |
| Semiconductor |
$SOX |
3,990.95 |
+60.77 |
+1.55% |
+57.61% |
| Networking |
$NWX |
805.63 |
+20.80 |
+2.65% |
+2.85% |
| Broker/Dealer |
$XBD |
528.79 |
+5.97 |
+1.14% |
+17.74% |
| Retail |
$RLX |
3,824.10 |
+55.46 |
+1.47% |
+38.86% |
| Gold & Silver |
$XAU |
121.05 |
+7.12 |
+6.25% |
+0.16% |
| Bank |
$BKX |
91.93 |
+3.31 |
+3.74% |
-8.85% |
| Biotech |
$BTK |
5,264.63 |
+216.10 |
+4.28% |
-0.31% |
|
|
|
 |
Axon Enterprise Hits New High With 6th Straight Gain
Kenneth J. Gruneisen - Passed the CAN SLIM® Master's Exam
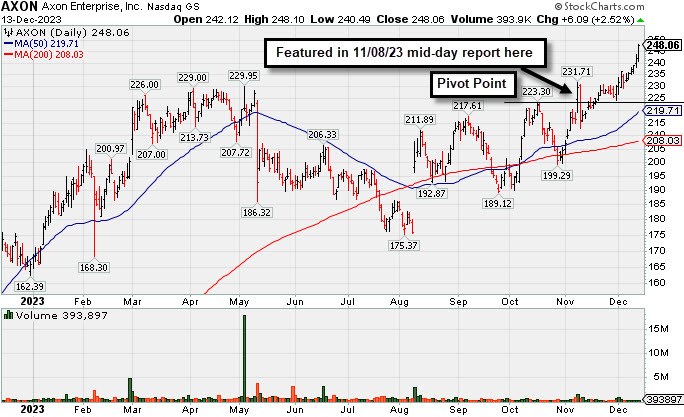
Axon Enterprise Inc (AXON +$6.09 or +2.52% to $248.06) hit a new all-time high with today's 6th consecutive gain backed by below average volume. On pullbacks, the prior highs in the $229-231 area define near-term support to watch above its 50-day moving average (DMA) line ($219.71).
AXON was highlighted in yellow in the 11/08/23 mid-day report (read here) with new pivot point cited based on its 10/17/23 high after a cup-with-handle base. It hit a new all-time high and finished near the session high triggering a technical buy signal. It was shown in detail that evening under the headline, "Breakout for Axon as it Returns to Featured Stocks List".
AXON reported Sep '23 quarterly earnings +70% on +33% sales revenues versus the year-ago period, its 4th strong quarter well above the +25% minimum earnings guideline (C criteria). Annual earnings had a slight downturn in FY '22 after years of strong growth.
The company has a small supply of only 74.8 million shares outstanding (S criteria) which can contribute to greater price volatility in the event of institutional buying or selling. The number of top-rated funds owning its shares rose from 400 in Sep '19 to 1,358 in Sep '23, a reassuring sign concerning the I criteria. AXON has a Timeliness Rating of A and an Accumulation/Distribution Rating of A. |
|
|
Color Codes Explained :
Y - Better candidates highlighted by our
staff of experts.
G - Previously featured
in past reports as yellow but may no longer be buyable under the
guidelines.
***Last / Change / Volume data in this table is the closing quote data***
Symbol/Exchange
Company Name
Industry Group |
PRICE |
CHANGE
(%Change) |
Day High |
Volume
(% DAV)
(% 50 day avg vol) |
52 Wk Hi
% From Hi |
Featured
Date |
Price
Featured |
Pivot Featured |
|
Max Buy |
 ANET
-
NYSE
ANET
-
NYSE
Arista Networks
Computer-Networking
|
$229.55
|
-0.31
-0.13% |
$231.95
|
1,599,320
73.43% of 50 DAV
50 DAV is 2,178,000
|
$231.04
-0.64%
|
10/31/2023
|
$188.84
|
PP = $198.80
|
|
MB = $208.74
|
 Most Recent Note - 12/13/2023 5:49:05 PM
G - Holding its ground perched at its all-time high, extended from any sound base. Its 50 DMA line ($205) defines near-term support above prior highs in the $198 area. Fundamentals remain strong.
>>> FEATURED STOCK ARTICLE : Made Gradual Progress Since Latest Breakout - 12/6/2023 |
View all notes |
Set NEW NOTE alert |
Company Profile |
SEC
News |
Chart |
Request a new note
C
A
S
I |
NVO
-
NYSE
Novo Nordisk ADR
Medical-Ethical Drugs
|
$98.90
|
+2.69
2.80% |
$98.93
|
5,044,275
107.51% of 50 DAV
50 DAV is 4,692,000
|
$105.69
-6.42%
|
11/2/2023
|
$100.97
|
PP = $104.10
|
|
MB = $109.31
|
Most Recent Note - 12/13/2023 5:46:21 PM
Y - Color code is changed to yellow after it rebounded and closed the session just above the 50 DMA line ($98.72) helping its outlook to improve.
>>> FEATURED STOCK ARTICLE : Managed a "Positive Reversal" but Still Below 50-Day Moving Average - 12/11/2023 |
View all notes |
Set NEW NOTE alert |
Company Profile |
SEC
News |
Chart |
Request a new note
C
A
S
I |
QLYS
-
NASDAQ
Qualys
Computer Sftwr-Security
|
$193.58
|
+2.45
1.28% |
$193.89
|
333,047
91.50% of 50 DAV
50 DAV is 364,000
|
$192.19
0.72%
|
11/3/2023
|
$167.50
|
PP = $165.03
|
|
MB = $173.28
|
Most Recent Note - 12/12/2023 6:32:26 PM
G - Volume was light behind today's 5th consecutive gain hitting another new all-time high, extended from any sound base. Its 50 DMA line ($169.22) defines initial support to watch on pullbacks above the prior high ($165). See the latest FSU analysis for more details and a new annotated graph.
>>> FEATURED STOCK ARTICLE : Extended From Base Following Big Breakout - 12/12/2023 |
View all notes |
Set NEW NOTE alert |
Company Profile |
SEC
News |
Chart |
Request a new note
C
A
S
I |
AXON
-
NASDAQ
Axon Enterprise
Security/Sfty
|
$248.06
|
+6.09
2.52% |
$248.10
|
391,152
88.50% of 50 DAV
50 DAV is 442,000
|
$243.61
1.83%
|
11/8/2023
|
$127.84
|
PP = $223.30
|
|
MB = $234.47
|
Most Recent Note - 12/13/2023 5:39:30 PM
G - Hit a new all-time high with today's 6th consecutive gain backed by light volume. On pullbacks, the prior highs in the $229-231 area define near-term support to watch above its 50-day moving average (DMA) line ($219.71). See the latest FSU analysis for more details and a new annotated graph.
>>> FEATURED STOCK ARTICLE : Axon Enterprise Hits New High With 6th Straight Gain - 12/13/2023 |
View all notes |
Set NEW NOTE alert |
Company Profile |
SEC
News |
Chart |
Request a new note
C
A
S
I |
TDG
-
NYSE
TransDigm Group
Aerospace/Defense
|
$1,011.36
|
+10.97
1.10% |
$1,015.72
|
226,781
94.49% of 50 DAV
50 DAV is 240,000
|
$1,013.08
-0.17%
|
12/12/2023
|
$1,000.39
|
PP = $1,013.18
|
|
MB = $1,063.84
|
Most Recent Note - 12/12/2023 6:41:47 PM
Y - Managed a best-ever close with below-average volume behind today's 5th consecutive gain. Color code is changed to yellow with new pivot point cited based on its 11/14/23 high plus 10 cents. Subsequent gains above the pivot point backed by at least +40% above average volume may trigger a new technical buy signal. Fundamentals remain strong. Recent lows in the $950 area define near-term support to watch on pullbacks.
>>> FEATURED STOCK ARTICLE : TransDigm's Big Gap Up Gain Triggered Technical Buy Signal - 11/9/2023 |
View all notes |
Set NEW NOTE alert |
Company Profile |
SEC
News |
Chart |
Request a new note
C
A
S
I |
Symbol/Exchange
Company Name
Industry Group |
PRICE |
CHANGE
(%Change) |
Day High |
Volume
(% DAV)
(% 50 day avg vol) |
52 Wk Hi
% From Hi |
Featured
Date |
Price
Featured |
Pivot Featured |
|
Max Buy |
PANW
-
NASDAQ
Palo Alto Networks
Computer Sftwr-Security
|
$313.86
|
+8.28
2.71% |
$316.19
|
5,157,333
123.41% of 50 DAV
50 DAV is 4,179,000
|
$307.88
1.94%
|
11/13/2023
|
$255.90
|
PP = $266.00
|
|
MB = $279.30
|
Most Recent Note - 12/13/2023 5:47:20 PM
G - Posted a 5th consecutive gain today for another new all-time high. Prior highs in the $265 area define initial support to watch above its 50 DMA line ($261). Fundamentals remain strong.
>>> FEATURED STOCK ARTICLE : Earnings New Due While Perched Near Prior High - 11/13/2023 |
View all notes |
Set NEW NOTE alert |
Company Profile |
SEC
News |
Chart |
Request a new note
C
A
S
I |
URI
-
NYSE
United Rentals
Comml Svcs-Leasing
|
$530.16
|
+20.58
4.04% |
$534.51
|
860,748
113.86% of 50 DAV
50 DAV is 756,000
|
$514.68
3.01%
|
12/1/2023
|
$499.51
|
PP = $488.73
|
|
MB = $513.17
|
Most Recent Note - 12/13/2023 5:44:44 PM
G - Color code is changed to green as it rose above its "max buy" level and hit a new all-time high with today's 6th consecutive gain backed by just +14% above average volume. The recent low ($474.56 on 12/05/23) defines near-term support to watch.
>>> FEATURED STOCK ARTICLE : New Breakout For United Rentals - 12/1/2023 |
View all notes |
Set NEW NOTE alert |
Company Profile |
SEC
News |
Chart |
Request a new note
C
A
S
I |
AMPH
-
NASDAQ
Amphastar Pharm
Medical-Biomed/Biotech
|
$61.85
|
+3.21
5.47% |
$62.15
|
824,958
213.17% of 50 DAV
50 DAV is 387,000
|
$67.66
-8.59%
|
12/4/2023
|
$60.84
|
PP = $58.35
|
|
MB = $61.27
|
Most Recent Note - 12/13/2023 12:39:53 PM
Y - On track today for a 3rd consecutive gain with ever-increasing volume and traded above the pivot point cited based on its 11/21/23 high after a cup-with-handle base. Little resistance remains due to overhead supply. A gain and strong close above the pivot point backed by at least +40% above average volume may trigger a proper new technical buy signal. Fundamentals remain strong.
>>> FEATURED STOCK ARTICLE : Amphastar Pharm on Track for 7th Weekly Gain - 12/4/2023 |
View all notes |
Set NEW NOTE alert |
Company Profile |
SEC
News |
Chart |
Request a new note
C
A
S
I |
TBBK
-
NASDAQ
The Bancorp
Banks-Northeast
|
$40.25
|
+1.06
2.70% |
$40.49
|
429,910
109.39% of 50 DAV
50 DAV is 393,000
|
$41.52
-3.06%
|
12/4/2023
|
$39.88
|
PP = $41.62
|
|
MB = $43.70
|
Most Recent Note - 12/13/2023 5:43:10 PM
Y - Posted a gain today with slightly higher volume and closed above the $40 threshold for the first time since August. Perched within close striking distance of its 52-week high. Pivot point cited was based on its 7/27/23 high plus 10 cents. Subsequent gains above the pivot point backed by at least +40% above average volume may trigger a technical buy signal.
>>> FEATURED STOCK ARTICLE : The Bancorp is Perched Near High with Strong Fundamentals - 12/5/2023 |
View all notes |
Set NEW NOTE alert |
Company Profile |
SEC
News |
Chart |
Request a new note
C
A
S
I |
LULU
-
NASDAQ
lululemon athletica
Retail-Apparel/Shoes/Acc
|
$504.50
|
+0.85
0.17% |
$508.43
|
1,675,317
70.66% of 50 DAV
50 DAV is 2,371,000
|
$507.44
-0.58%
|
12/8/2023
|
$490.61
|
PP = $485.93
|
|
MB = $510.23
|
Most Recent Note - 12/11/2023 10:16:02 PM
Y - Rallying from a 2-year long base, it posted a 3rd consecutive gain today backed by +19% above average volume for another new all-time high. Pivot point cited was based on its Nov '21 high plus 10 cents.
>>> FEATURED STOCK ARTICLE : Lululemon Breaks Out to New All-Time High - 12/8/2023 |
View all notes |
Set NEW NOTE alert |
Company Profile |
SEC
News |
Chart |
Request a new note
C
A
S
I |
Symbol/Exchange
Company Name
Industry Group |
PRICE |
CHANGE
(%Change) |
Day High |
Volume
(% DAV)
(% 50 day avg vol) |
52 Wk Hi
% From Hi |
Featured
Date |
Price
Featured |
Pivot Featured |
|
Max Buy |
|
|
|
THESE ARE NOT BUY RECOMMENDATIONS!
Comments contained in the body of this report are technical
opinions only. The material herein has been obtained
from sources believed to be reliable and accurate, however,
its accuracy and completeness cannot be guaranteed.
This site is not an investment advisor, hence it does
not endorse or recommend any securities or other investments.
Any recommendation contained in this report may not
be suitable for all investors and it is not to be deemed
an offer or solicitation on our part with respect to
the purchase or sale of any securities. All trademarks,
service marks and trade names appearing in this report
are the property of their respective owners, and are
likewise used for identification purposes only.
This report is a service available
only to active Paid Premium Members.
You may opt-out of receiving report notifications
at any time. Questions or comments may be submitted
by writing to Premium Membership Services 665 S.E. 10 Street, Suite 201 Deerfield Beach, FL 33441-5634 or by calling 1-800-965-8307
or 954-785-1121.
|
|
|