You are not logged in.
This means you
CAN ONLY VIEW reports that were published prior to Tuesday, March 25, 2025.
You
MUST UPGRADE YOUR MEMBERSHIP if you want to see any current reports.
AFTER MARKET UPDATE - FRIDAY, DECEMBER 22ND, 2023
Previous After Market Report Next After Market Report >>>
|
|
|
|
DOW |
-18.38 |
37,385.97 |
-0.05% |
|
Volume |
718,175,672 |
-15% |
|
Volume |
4,838,663,000 |
-12% |
|
NASDAQ |
+29.11 |
14,992.97 |
+0.19% |
|
Advancers |
1,833 |
66% |
|
Advancers |
2,784 |
65% |
|
S&P 500 |
+7.88 |
4,754.63 |
+0.17% |
|
Decliners |
946 |
34% |
|
Decliners |
1,502 |
35% |
|
Russell 2000 |
+16.90 |
2,033.96 |
+0.84% |
|
52 Wk Highs |
180 |
|
|
52 Wk Highs |
273 |
|
|
S&P 600 |
+6.50 |
1,319.69 |
+0.49% |
|
52 Wk Lows |
11 |
|
|
52 Wk Lows |
80 |
|
|
 |
S&P 500 and Nasdaq Composite Indexes Rose as Dow Edged Lower
Kenneth J. Gruneisen - Passed the CAN SLIM® Master's Exam
The S&P 500 (+0.2%), Nasdaq Composite (+0.2%), and Dow Jones Industrial Average (-0.1%) all climbed off their session lows, but the Dow couldn't manage a positive finish. Volume was reported lighter than the prior session totals on the NYSE and on the Nasdaq exchange. Breadth was positive as advancers led decliners by about a 2-1 margin on the NYSE and by nearly 2-1 on the Nasdaq exchange. There were 94 high-ranked companies from the Leaders List that hit new 52-week highs and were listed on the BreakOuts Page, versus the total of 35 on the prior session. New 52-week highs totals contracted yet solidly outnumbered new 52-week lows totals on the NYSE and on the Nasdaq exchange. The major indices are in a confirmed uptrend (M criteria). New buying efforts should be only made in stocks fitting all key criteria of the fact-based investment system.
PICTURED: The Dow Jones Industrial Average is perched near its 2023 high following an impressive streak of volume-driven gains. The November Personal Income and Spending report contained a healthy +0.4% increase in real disposable personal income, a +0.3% increase in real spending, with disinflation evident in both the PCE and Core PCE Price Indexes. Durable goods orders were stronger than expected in November, and consumer sentiment increased while inflation expectations decreased in December.
There was a disappointing -12.2% month-over-month decline in new home sales in November. A recent drop in mortgage rates suggests that sales activity will rebound smartly in December.
The material (+0.6%) and industrial (+0.4%) sectors were among the winning standouts. Health care (+0.5%) was another outperformer as M&A activity featured Bristol-Myers (BMY +2.01%) acquiring Karuna Therapeutics (KRTX +47.71%) for $330.00 per share in cash for a total equity value of $14.0 billion. Nike (NKE -11.11%) fell after it reported fiscal Q2 earnings and gave disappointing guidance.
The 2-yr note yield settled unchanged at 4.33%. The 10-yr note yield rose one basis point to 3.90%.
|
 Kenneth J. Gruneisen started out as a licensed stockbroker in August 1987, a couple of months prior to the historic stock market crash that took the Dow Jones Industrial Average down -22.6% in a single day. He has published daily fact-based fundamental and technical analysis on high-ranked stocks online for two decades. Through FACTBASEDINVESTING.COM, Kenneth provides educational articles, news, market commentary, and other information regarding proven investment systems that work in good times and bad.
Comments contained in the body of this report are technical opinions only and are not necessarily those of Gruneisen Growth Corp. The material herein has been obtained from sources believed to be reliable and accurate, however, its accuracy and completeness cannot be guaranteed. Our firm, employees, and customers may effect transactions, including transactions contrary to any recommendation herein, or have positions in the securities mentioned herein or options with respect thereto. Any recommendation contained in this report may not be suitable for all investors and it is not to be deemed an offer or solicitation on our part with respect to the purchase or sale of any securities. |
|
 |
Biotech and Gold & Silver Indexes Led Gainers
Kenneth J. Gruneisen - Passed the CAN SLIM® Master's Exam
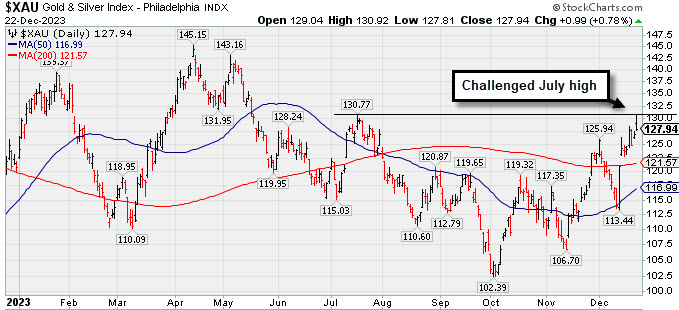
The Broker/Dealer Index ($XBD +0.34%) and Bank Index ($BKX +0.21%) each posted a small gain while the Retail Index ($RLX -0.20%) ended slightly in the red. The tech sector had a positive bias as the Biotech Index ($BTK +2.02%) posted a standout gain while the Networking Index ($NWX +0.51%) and the Semiconductor Index ($SOX +0.35%) both edged higher. The Gold & Silver Index ($XAU +0.78%) outpaced the Integrated Oil Index ($XOI +0.15%) while the Oil Services Index ($OSX -0.12%) ended slightly lower.
PICTURED: The Gold & Silver Index ($XAU +0.78%) challenged its July 2023 high.
| Oil Services |
$OSX |
85.05 |
-0.10 |
-0.12% |
+1.42% |
| Integrated Oil |
$XOI |
1,883.83 |
+2.77 |
+0.15% |
+5.40% |
| Semiconductor |
$SOX |
4,132.86 |
+14.26 |
+0.35% |
+63.22% |
| Networking |
$NWX |
827.18 |
+4.17 |
+0.51% |
+5.60% |
| Broker/Dealer |
$XBD |
551.71 |
+1.90 |
+0.34% |
+22.84% |
| Retail |
$RLX |
3,909.60 |
-7.97 |
-0.20% |
+41.96% |
| Gold & Silver |
$XAU |
127.94 |
+0.99 |
+0.78% |
+5.86% |
| Bank |
$BKX |
95.32 |
+0.20 |
+0.21% |
-5.48% |
| Biotech |
$BTK |
5,368.86 |
+106.47 |
+2.02% |
+1.66% |
|
|
|
 |
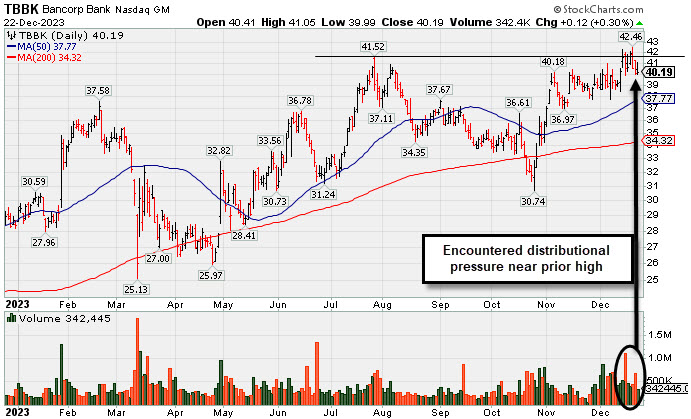
Negative Reversals are Signs of Distributional Pressure
Kenneth J. Gruneisen - Passed the CAN SLIM® Master's Exam
The Bancorp (TBBK +$0.12 or +0.30% to $40.19) posted a small gain today with light volume after "negative reversals" on the 2 prior sessions while perched at its all-time high, sputtering back below its pivot point raising concerns. The recent action has been indicative of distributional pressure. Subsequent gains and a strong close above the pivot point backed by at least +40% above average volume may trigger a proper technical buy signal. TBBK was highlighted in yellow with pivot point cited based on its 7/27/23 high plus 10 cents in the 12/04/23 mid-day report (read here). It last appeared in this FSU section on 12/05/23 with an annotated graph under the headline, "The Bancorp is Perched Near High with Strong Fundamentals". Quarterly earnings increases above the +25% guideline satisfy the C criteria. Its annual earnings (A criteria) history has been steadily improving. The number of top-rated funds owning its share rose from 422 in Sep '12 to 454 in Sep '23, a reassuring sign concerning the I criteria. Its small supply (S criteria) of only 51 million shares in the public float can contribute to greater price volatility in the event of institutional buying or selling. |
|
|
Color Codes Explained :
Y - Better candidates highlighted by our
staff of experts.
G - Previously featured
in past reports as yellow but may no longer be buyable under the
guidelines.
***Last / Change / Volume data in this table is the closing quote data***
Symbol/Exchange
Company Name
Industry Group |
PRICE |
CHANGE
(%Change) |
Day High |
Volume
(% DAV)
(% 50 day avg vol) |
52 Wk Hi
% From Hi |
Featured
Date |
Price
Featured |
Pivot Featured |
|
Max Buy |
 ANET
-
NYSE
ANET
-
NYSE
Arista Networks
Computer-Networking
|
$238.26
|
+2.92
1.24% |
$239.96
|
1,021,100
46.41% of 50 DAV
50 DAV is 2,200,000
|
$240.01
-0.73%
|
10/31/2023
|
$188.84
|
PP = $198.80
|
|
MB = $208.74
|
Most Recent Note - 12/21/2023 5:00:28 PM
G - Hovering near its all-time high, extended from any sound base. Its 50 DMA line ($210.52) defines near-term support above prior highs in the $198 area. Fundamentals remain strong.
>>> FEATURED STOCK ARTICLE : Made Gradual Progress Since Latest Breakout - 12/6/2023 |
View all notes |
Set NEW NOTE alert |
Company Profile |
SEC
News |
Chart |
Request a new note
C
A
S
I |
NVO
-
NYSE
Novo Nordisk ADR
Medical-Ethical Drugs
|
$102.71
|
-0.77
-0.74% |
$103.56
|
2,209,368
47.60% of 50 DAV
50 DAV is 4,642,000
|
$105.69
-2.82%
|
11/2/2023
|
$100.97
|
PP = $104.10
|
|
MB = $109.31
|
Most Recent Note - 12/21/2023 4:58:05 PM
Y - Posted a 4th consecutive gain today, wedging further above its 50 DMA line ($99.59) toward its high. Its 50 DMA line defines initial support above the recent low ($94.73 on 12/11/23) on pullbacks.
>>> FEATURED STOCK ARTICLE : Managed a "Positive Reversal" but Still Below 50-Day Moving Average - 12/11/2023 |
View all notes |
Set NEW NOTE alert |
Company Profile |
SEC
News |
Chart |
Request a new note
C
A
S
I |
QLYS
-
NASDAQ
Qualys
Computer Sftwr-Security
|
$204.41
|
+0.88
0.43% |
$206.25
|
162,665
42.69% of 50 DAV
50 DAV is 381,000
|
$206.35
-0.94%
|
11/3/2023
|
$167.50
|
PP = $165.03
|
|
MB = $173.28
|
Most Recent Note - 12/20/2023 5:10:26 PM
G - Pulled back today breaking a streak of 10 consecutive gains for new all-time highs. It is very extended from any sound base. Its 50 DMA line ($174) defines initial support to watch on pullbacks above the prior high ($165).
>>> FEATURED STOCK ARTICLE : Extended From Base Following Big Breakout - 12/12/2023 |
View all notes |
Set NEW NOTE alert |
Company Profile |
SEC
News |
Chart |
Request a new note
C
A
S
I |
AXON
-
NASDAQ
Axon Enterprise
Security/Sfty
|
$259.03
|
+2.19
0.85% |
$260.69
|
279,067
61.88% of 50 DAV
50 DAV is 451,000
|
$260.35
-0.51%
|
11/8/2023
|
$127.84
|
PP = $223.30
|
|
MB = $234.47
|
Most Recent Note - 12/21/2023 5:01:37 PM
G - Posted a gain today with lighter volume for a best-ever close. On pullbacks, the prior highs in the $229-231 area define near-term support to watch above its 50-day moving average (DMA) line ($225.62).
>>> FEATURED STOCK ARTICLE : Axon Enterprise Hits New High With 6th Straight Gain - 12/13/2023 |
View all notes |
Set NEW NOTE alert |
Company Profile |
SEC
News |
Chart |
Request a new note
C
A
S
I |
TDG
-
NYSE
TransDigm Group
Aerospace/Defense
|
$1,000.42
|
+6.30
0.63% |
$1,005.91
|
141,963
61.46% of 50 DAV
50 DAV is 231,000
|
$1,015.72
-1.51%
|
12/12/2023
|
$1,000.39
|
PP = $1,013.18
|
|
MB = $1,063.84
|
Most Recent Note - 12/19/2023 5:18:55 PM
Y - Posted a 2nd consecutive gain backed by light volume following 2 volume-driven losses. The new pivot point cited was based on its 11/14/23 high plus 10 cents, however, gains above the pivot point were not backed by the +40% above-average volume necessary to trigger a proper new technical buy signal. Fundamentals remain strong. Recent lows in the $950 area define near-term support to watch on pullbacks.
>>> FEATURED STOCK ARTICLE : Volume-Driven Loss Breaks Streak of 6 Straight Gains - 12/14/2023 |
View all notes |
Set NEW NOTE alert |
Company Profile |
SEC
News |
Chart |
Request a new note
C
A
S
I |
Symbol/Exchange
Company Name
Industry Group |
PRICE |
CHANGE
(%Change) |
Day High |
Volume
(% DAV)
(% 50 day avg vol) |
52 Wk Hi
% From Hi |
Featured
Date |
Price
Featured |
Pivot Featured |
|
Max Buy |
PANW
-
NASDAQ
Palo Alto Networks
Computer Sftwr-Security
|
$298.21
|
-1.19
-0.40% |
$300.75
|
2,373,048
53.45% of 50 DAV
50 DAV is 4,440,000
|
$318.00
-6.22%
|
11/13/2023
|
$255.90
|
PP = $266.00
|
|
MB = $279.30
|
Most Recent Note - 12/20/2023 5:09:00 PM
G - Volume totals have been cooling while consolidating near its all-time high. Prior highs in the $265 area define important support to watch along with its 50 DMA line ($267). Fundamentals remain strong.
>>> FEATURED STOCK ARTICLE : Consolidating After Volume-Driven Gains for All-Time Highs - 12/15/2023 |
View all notes |
Set NEW NOTE alert |
Company Profile |
SEC
News |
Chart |
Request a new note
C
A
S
I |
URI
-
NYSE
United Rentals
Comml Svcs-Leasing
|
$570.51
|
-0.44
-0.08% |
$575.50
|
354,787
43.53% of 50 DAV
50 DAV is 815,000
|
$582.63
-2.08%
|
12/1/2023
|
$499.51
|
PP = $488.73
|
|
MB = $513.17
|
Most Recent Note - 12/21/2023 4:59:10 PM
G - Posted a gain today with below-average volume, hovering near its all-time high. On pullbacks, the prior highs define near-term support to watch above its 50 DMA line ($467).
>>> FEATURED STOCK ARTICLE : Perched Near All-Time High Following Volume-Driven Gains - 12/19/2023 |
View all notes |
Set NEW NOTE alert |
Company Profile |
SEC
News |
Chart |
Request a new note
C
A
S
I |
AMPH
-
NASDAQ
Amphastar Pharm
Medical-Biomed/Biotech
|
$60.92
|
+0.96
1.60% |
$61.47
|
314,490
74.88% of 50 DAV
50 DAV is 420,000
|
$67.66
-9.96%
|
12/4/2023
|
$60.84
|
PP = $58.35
|
|
MB = $61.27
|
Most Recent Note - 12/21/2023 4:55:41 PM
Y - Posted a gain with light volume today. It is above the pivot point cited based on its 11/21/23 high after a cup-with-handle base. Volume totals have been cooling while consolidating. Little resistance remains due to overhead supply. Fundamentals remain strong. See the latest FSU analysis for more details and a new annotated graph.
>>> FEATURED STOCK ARTICLE : Consolidating Above Pivot Point With Volume Cooling - 12/21/2023 |
View all notes |
Set NEW NOTE alert |
Company Profile |
SEC
News |
Chart |
Request a new note
C
A
S
I |
TBBK
-
NASDAQ
The Bancorp
Banks-Northeast
|
$40.19
|
+0.12
0.30% |
$41.05
|
342,418
79.08% of 50 DAV
50 DAV is 433,000
|
$42.46
-5.35%
|
12/4/2023
|
$39.88
|
PP = $41.62
|
|
MB = $43.70
|
 Most Recent Note - 12/22/2023 11:14:13 PM
Y - Posted a small gain on lighter volume today after 2 "negative reversals" at its all-time high sputtering back below its pivot point. Subsequent gains and a strong close above the pivot point backed by at least +40% above average volume may trigger a proper technical buy signal. See the latest FSU analysis for more details and a new annotated graph.
>>> FEATURED STOCK ARTICLE : Negative Reversals are Signs of Distributional Pressure - 12/22/2023 |
View all notes |
Set NEW NOTE alert |
Company Profile |
SEC
News |
Chart |
Request a new note
C
A
S
I |
LULU
-
NASDAQ
lululemon athletica
Retail-Apparel/Shoes/Acc
|
$510.00
|
-1.03
-0.20% |
$510.48
|
1,174,963
48.67% of 50 DAV
50 DAV is 2,414,000
|
$511.60
-0.31%
|
12/8/2023
|
$490.61
|
PP = $485.93
|
|
MB = $510.23
|
Most Recent Note - 12/19/2023 5:20:03 PM
Y - Posted a gain today with below-average volume for a best-ever close as it hit a new all-time high. Its 2021 high of $485 defines initial support to watch after its recent breakout from a 2+ year base.
>>> FEATURED STOCK ARTICLE : Lululemon Breaks Out to New All-Time High - 12/8/2023 |
View all notes |
Set NEW NOTE alert |
Company Profile |
SEC
News |
Chart |
Request a new note
C
A
S
I |
Symbol/Exchange
Company Name
Industry Group |
PRICE |
CHANGE
(%Change) |
Day High |
Volume
(% DAV)
(% 50 day avg vol) |
52 Wk Hi
% From Hi |
Featured
Date |
Price
Featured |
Pivot Featured |
|
Max Buy |
|
|
|
THESE ARE NOT BUY RECOMMENDATIONS!
Comments contained in the body of this report are technical
opinions only. The material herein has been obtained
from sources believed to be reliable and accurate, however,
its accuracy and completeness cannot be guaranteed.
This site is not an investment advisor, hence it does
not endorse or recommend any securities or other investments.
Any recommendation contained in this report may not
be suitable for all investors and it is not to be deemed
an offer or solicitation on our part with respect to
the purchase or sale of any securities. All trademarks,
service marks and trade names appearing in this report
are the property of their respective owners, and are
likewise used for identification purposes only.
This report is a service available
only to active Paid Premium Members.
You may opt-out of receiving report notifications
at any time. Questions or comments may be submitted
by writing to Premium Membership Services 665 S.E. 10 Street, Suite 201 Deerfield Beach, FL 33441-5634 or by calling 1-800-965-8307
or 954-785-1121.
|
|
|