You are not logged in.
This means you
CAN ONLY VIEW reports that were published prior to Tuesday, March 25, 2025.
You
MUST UPGRADE YOUR MEMBERSHIP if you want to see any current reports.
AFTER MARKET UPDATE - TUESDAY, DECEMBER 19TH, 2023
Previous After Market Report Next After Market Report >>>
|
|
|
|
DOW |
+251.90 |
37,557.92 |
+0.68% |
|
Volume |
1,007,286,292 |
-2% |
|
Volume |
5,776,241,700 |
-5% |
|
NASDAQ |
+98.03 |
15,003.22 |
+0.66% |
|
Advancers |
2,262 |
81% |
|
Advancers |
3,184 |
73% |
|
S&P 500 |
+27.81 |
4,768.37 |
+0.59% |
|
Decliners |
540 |
19% |
|
Decliners |
1,167 |
27% |
|
Russell 2000 |
+38.54 |
2,020.95 |
+1.94% |
|
52 Wk Highs |
245 |
|
|
52 Wk Highs |
398 |
|
|
S&P 600 |
+26.34 |
1,314.24 |
+2.05% |
|
52 Wk Lows |
17 |
|
|
52 Wk Lows |
144 |
|
|
 |
Breadth Positive as Major Indices Rose With Greater Leadership
Kenneth J. Gruneisen - Passed the CAN SLIM® Master's Exam
The Russell 2000 closed with a 1.9% gain while the three major indices logged gains ranging from +0.6% to +0.7% and the Dow Jones Industrial Average closed at a fresh record high. Volume was reported lower than the prior session totals on the NYSE and on the Nasdaq exchange, revealing less institutional buying demand. Breadth was positive as advancers led decliners by a 4-1 margin on the NYSE and nearly 3-1 on the Nasdaq exchange. There were 132 high-ranked companies from the Leaders List that hit new 52-week highs and were listed on the BreakOuts Page, versus the total of 49 on the prior session. New 52-week highs totals expanded and solidly outnumbered new 52-week lows totals on the NYSE and on the Nasdaq exchange. The major indices are in a confirmed uptrend (M criteria). New buying efforts should be only made in stocks fitting all key criteria of the fact-based investment system.
PICTURED: The S&P 500 Index is perched -1% off its all-time high. Housing starts were much stronger than expected in November, and there was an upward revision to the Atlanta Fed GDPNow model estimate for Q4 real GDP growth to 2.7% from 2.6%. Atlanta Fed President Bostic (2024 FOMC voter) stated that he does not see an urgency to cut rates in 2024, according to Bloomberg. The 2-yr note yield fell one basis point to 4.45% and the 10-yr note yield fell four basis points to 3.92%. Meanwhile, the Bank of Japan left its policy rate unchanged at -0.10% and it intends to stick with a negative interest rate policy.
Broad based gains had all 11 S&P 500 sectors close in positive territory. The energy sector (+1.2%) led as WTI crude oil futures climbed another 1.6% today to $74.01/bbl. Consumer staples (+0.2%) and information technology (+0.2%) showed the slimmest gains.
|
 Kenneth J. Gruneisen started out as a licensed stockbroker in August 1987, a couple of months prior to the historic stock market crash that took the Dow Jones Industrial Average down -22.6% in a single day. He has published daily fact-based fundamental and technical analysis on high-ranked stocks online for two decades. Through FACTBASEDINVESTING.COM, Kenneth provides educational articles, news, market commentary, and other information regarding proven investment systems that work in good times and bad.
Comments contained in the body of this report are technical opinions only and are not necessarily those of Gruneisen Growth Corp. The material herein has been obtained from sources believed to be reliable and accurate, however, its accuracy and completeness cannot be guaranteed. Our firm, employees, and customers may effect transactions, including transactions contrary to any recommendation herein, or have positions in the securities mentioned herein or options with respect thereto. Any recommendation contained in this report may not be suitable for all investors and it is not to be deemed an offer or solicitation on our part with respect to the purchase or sale of any securities. |
|
 |
Commodity-Linked Groups and Financials Led Gainers
Kenneth J. Gruneisen - Passed the CAN SLIM® Master's Exam
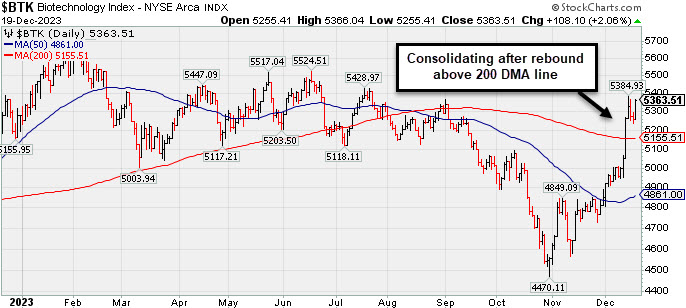
The Broker/Dealer Index ($XBD +2.13%) and the Bank Index ($BKX +1.17%) both posted influential gains on Tuesday while the Retail Index ($RLX +0.15%) inched higher. The tech sector had a positive bias as the Biotech Index ($BTK +2.06%) and Networking Index ($NWX +1.01%) both outpaced the Semiconductor Index ($SOX +0.53%). Commodity-linked groups also clearly had a positive bias as the Gold & Silver Index ($XAU +2.87%), Integrated Oil Index ($XOI +1.16%), and the Oil Services Index ($OSX +1.98%) each posted solid gains.
PICTURED: The Biotech Index ($BTK +2.06%) is consolidating after rebounding above its 200-day moving average (DMA) line.
| Oil Services |
$OSX |
85.17 |
+1.66 |
+1.98% |
+1.56% |
| Integrated Oil |
$XOI |
1,888.81 |
+21.58 |
+1.16% |
+5.68% |
| Semiconductor |
$SOX |
4,125.56 |
+21.77 |
+0.53% |
+62.93% |
| Networking |
$NWX |
824.03 |
+8.24 |
+1.01% |
+5.20% |
| Broker/Dealer |
$XBD |
551.83 |
+11.53 |
+2.13% |
+22.87% |
| Retail |
$RLX |
3,927.18 |
+5.98 |
+0.15% |
+42.60% |
| Gold & Silver |
$XAU |
127.75 |
+3.56 |
+2.87% |
+5.70% |
| Bank |
$BKX |
96.11 |
+1.11 |
+1.17% |
-4.70% |
| Biotech |
$BTK |
5,363.51 |
+108.10 |
+2.06% |
+1.56% |
|
|
|
 |
Perched Near All-Time High Following Volume-Driven Gains
Kenneth J. Gruneisen - Passed the CAN SLIM® Master's Exam
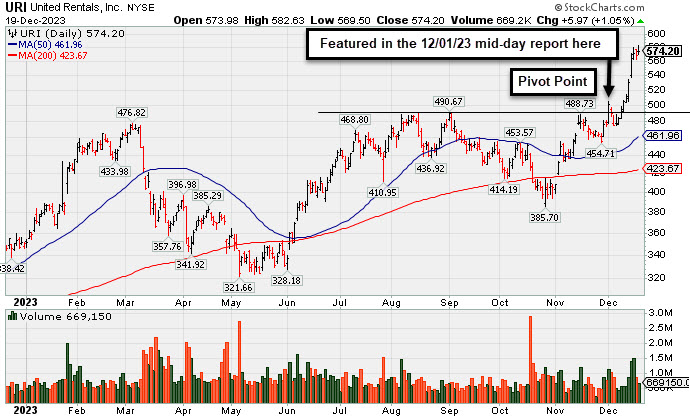
United Rentals Inc (URI +$5.97 or +1.05% to $574.20) is consolidating following a noted streak of 7 consecutive gains for new all-time highs. On pullbacks, prior highs define near-term support to watch above its 50-day moving average (DMA) line.
URI finished strong after highlighted in yellow in the 12/01/23 mid-day report (read here) with pivot point cited based on its 11/15/23 high after a cup-with-handle base. The gain above the pivot point backed by +51% above average volume triggered a proper technical buy signal. It was shown in greater detail that evening with an annotated graph under the headline, "New Breakout For United Rentals".
URI has a 96 Earnings Per Share Rating. Through Sep '23 its quarterly earnings increases versus the year ago periods have been above the +25% minimum guideline (C criteria). Annual earnings (A criteria) history had a downturn in FY '20 like many companies during the pandemic. Consensus estimates for FY '23 and '24 have been increasing, an encouraging sign.
The number of top-rated funds owning its shares reportedly fell from 2,267 in Mar '23 to 2,192 in Sep '23, not a reassuring sign concerning the I criteria. Its current Up/Down Volume Ratio of 1.2 is an unbiased indication its shares have been under accumulation over the past 50 days.
|
|
|
Color Codes Explained :
Y - Better candidates highlighted by our
staff of experts.
G - Previously featured
in past reports as yellow but may no longer be buyable under the
guidelines.
***Last / Change / Volume data in this table is the closing quote data***
Symbol/Exchange
Company Name
Industry Group |
PRICE |
CHANGE
(%Change) |
Day High |
Volume
(% DAV)
(% 50 day avg vol) |
52 Wk Hi
% From Hi |
Featured
Date |
Price
Featured |
Pivot Featured |
|
Max Buy |
 ANET
-
NYSE
ANET
-
NYSE
Arista Networks
Computer-Networking
|
$238.81
|
+3.21
1.36% |
$240.01
|
1,807,860
81.66% of 50 DAV
50 DAV is 2,214,000
|
$238.62
0.08%
|
10/31/2023
|
$188.84
|
PP = $198.80
|
|
MB = $208.74
|
 Most Recent Note - 12/18/2023 7:28:06 PM
G - Hit another new all-time high with lighter volume behind today's 3rd consecutive gain. It is extended from any sound base. Its 50 DMA line ($208) defines near-term support above prior highs in the $198 area. Fundamentals remain strong.
>>> FEATURED STOCK ARTICLE : Made Gradual Progress Since Latest Breakout - 12/6/2023 |
View all notes |
Set NEW NOTE alert |
Company Profile |
SEC
News |
Chart |
Request a new note
C
A
S
I |
NVO
-
NYSE
Novo Nordisk ADR
Medical-Ethical Drugs
|
$98.98
|
+1.88
1.94% |
$99.80
|
4,720,939
99.39% of 50 DAV
50 DAV is 4,750,000
|
$105.69
-6.35%
|
11/2/2023
|
$100.97
|
PP = $104.10
|
|
MB = $109.31
|
Most Recent Note - 12/18/2023 7:24:56 PM
Y - Gapped up today and closed the session near its 50 DMA line ($99.17). Recent low ($94.73 on 12/11/23) defines important near-term support to watch on pullbacks.
>>> FEATURED STOCK ARTICLE : Managed a "Positive Reversal" but Still Below 50-Day Moving Average - 12/11/2023 |
View all notes |
Set NEW NOTE alert |
Company Profile |
SEC
News |
Chart |
Request a new note
C
A
S
I |
QLYS
-
NASDAQ
Qualys
Computer Sftwr-Security
|
$202.14
|
+3.29
1.65% |
$202.60
|
340,286
87.03% of 50 DAV
50 DAV is 391,000
|
$200.84
0.65%
|
11/3/2023
|
$167.50
|
PP = $165.03
|
|
MB = $173.28
|
Most Recent Note - 12/15/2023 6:57:36 PM
G - Volume was higher behind today's 8th consecutive gain hitting another new all-time high, extended from any sound base. Its 50 DMA line ($171.76) defines initial support to watch on pullbacks above the prior high ($165).
>>> FEATURED STOCK ARTICLE : Extended From Base Following Big Breakout - 12/12/2023 |
View all notes |
Set NEW NOTE alert |
Company Profile |
SEC
News |
Chart |
Request a new note
C
A
S
I |
AXON
-
NASDAQ
Axon Enterprise
Security/Sfty
|
$255.70
|
-0.28
-0.11% |
$256.01
|
372,112
80.54% of 50 DAV
50 DAV is 462,000
|
$256.82
-0.44%
|
11/8/2023
|
$127.84
|
PP = $223.30
|
|
MB = $234.47
|
Most Recent Note - 12/18/2023 7:30:03 PM
G - Ended near the session high with a small loss today on lighter volume following 8 consecutive gains marked by ever-increasing volume as it rallied to new highs. On pullbacks, the prior highs in the $229-231 area define near-term support to watch above its 50-day moving average (DMA) line ($223.20).
>>> FEATURED STOCK ARTICLE : Axon Enterprise Hits New High With 6th Straight Gain - 12/13/2023 |
View all notes |
Set NEW NOTE alert |
Company Profile |
SEC
News |
Chart |
Request a new note
C
A
S
I |
TDG
-
NYSE
TransDigm Group
Aerospace/Defense
|
$989.89
|
+4.30
0.44% |
$996.81
|
138,284
57.14% of 50 DAV
50 DAV is 242,000
|
$1,015.72
-2.54%
|
12/12/2023
|
$1,000.39
|
PP = $1,013.18
|
|
MB = $1,063.84
|
Most Recent Note - 12/14/2023 5:54:55 PM
Y - Suffered a loss today with above-average volume undercutting prior highs and breaking a streak of 6 consecutive gains backed by lackluster volume. The new pivot point cited was based on its 11/14/23 high plus 10 cents, however, gains above the pivot point were not backed by the +40% above-average volume necessary to trigger a proper new technical buy signal. Fundamentals remain strong. Recent lows in the $950 area define near-term support to watch on pullbacks. See the latest FSU analysis for more details and a new annotated graph.
>>> FEATURED STOCK ARTICLE : Volume-Driven Loss Breaks Streak of 6 Straight Gains - 12/14/2023 |
View all notes |
Set NEW NOTE alert |
Company Profile |
SEC
News |
Chart |
Request a new note
C
A
S
I |
Symbol/Exchange
Company Name
Industry Group |
PRICE |
CHANGE
(%Change) |
Day High |
Volume
(% DAV)
(% 50 day avg vol) |
52 Wk Hi
% From Hi |
Featured
Date |
Price
Featured |
Pivot Featured |
|
Max Buy |
PANW
-
NASDAQ
Palo Alto Networks
Computer Sftwr-Security
|
$307.58
|
+0.28
0.09% |
$309.42
|
3,328,120
74.42% of 50 DAV
50 DAV is 4,472,000
|
$318.00
-3.28%
|
11/13/2023
|
$255.90
|
PP = $266.00
|
|
MB = $279.30
|
Most Recent Note - 12/15/2023 6:56:08 PM
G - Consolidating after a noted streak of 5 consecutive gains to new all-time highs. Prior highs in the $265 area define initial support to watch above its 50 DMA line ($264). Fundamentals remain strong. See the latest FSU analysis for more detailed analysis and a new annotated graph.
>>> FEATURED STOCK ARTICLE : Consolidating After Volume-Driven Gains for All-Time Highs - 12/15/2023 |
View all notes |
Set NEW NOTE alert |
Company Profile |
SEC
News |
Chart |
Request a new note
C
A
S
I |
URI
-
NYSE
United Rentals
Comml Svcs-Leasing
|
$568.23
|
-3.51
-0.61% |
$577.11
|
845,863
107.21% of 50 DAV
50 DAV is 789,000
|
$581.00
-2.20%
|
12/1/2023
|
$499.51
|
PP = $488.73
|
|
MB = $513.17
|
Most Recent Note - 12/14/2023 6:05:19 PM
G - Volume was heavier behind today's 7th consecutive gain while hitting another new all-time high. Prior highs in the $492 area define near-term support to watch on pullbacks.
>>> FEATURED STOCK ARTICLE : New Breakout For United Rentals - 12/1/2023 |
View all notes |
Set NEW NOTE alert |
Company Profile |
SEC
News |
Chart |
Request a new note
C
A
S
I |
AMPH
-
NASDAQ
Amphastar Pharm
Medical-Biomed/Biotech
|
$58.06
|
+1.46
2.58% |
$58.10
|
341,023
81.78% of 50 DAV
50 DAV is 417,000
|
$67.66
-14.19%
|
12/4/2023
|
$60.84
|
PP = $58.35
|
|
MB = $61.27
|
Most Recent Note - 12/18/2023 7:27:00 PM
Y - Posted a gain today with below-average volume following 2 volume-driven losses. Recent weakness raised concerns while slumping back below the pivot point cited based on its 11/21/23 high after a cup-with-handle base. Little resistance remains due to overhead supply. Fundamentals remain strong.
>>> FEATURED STOCK ARTICLE : Amphastar Pharm on Track for 7th Weekly Gain - 12/4/2023 |
View all notes |
Set NEW NOTE alert |
Company Profile |
SEC
News |
Chart |
Request a new note
C
A
S
I |
TBBK
-
NASDAQ
The Bancorp
Banks-Northeast
|
$40.59
|
+0.08
0.20% |
$41.86
|
474,772
113.85% of 50 DAV
50 DAV is 417,000
|
$42.27
-3.97%
|
12/4/2023
|
$39.88
|
PP = $41.62
|
|
MB = $43.70
|
Most Recent Note - 12/14/2023 6:03:30 PM
Y - Posted a 3rd consecutive gain today with +34% above average volume, hitting a new 52-week high but finishing near the middle of its intra-day range and below its pivot point. Subsequent gains and a strong close above the pivot point backed by at least +40% above average volume may trigger a proper technical buy signal.
>>> FEATURED STOCK ARTICLE : The Bancorp is Perched Near High with Strong Fundamentals - 12/5/2023 |
View all notes |
Set NEW NOTE alert |
Company Profile |
SEC
News |
Chart |
Request a new note
C
A
S
I |
LULU
-
NASDAQ
lululemon athletica
Retail-Apparel/Shoes/Acc
|
$501.63
|
+10.17
2.07% |
$501.72
|
1,230,602
50.70% of 50 DAV
50 DAV is 2,427,000
|
$508.43
-1.34%
|
12/8/2023
|
$490.61
|
PP = $485.93
|
|
MB = $510.23
|
Most Recent Note - 12/14/2023 5:59:52 PM
Y - Pulled back today with higher (near average) volume after 6 consecutive gains, retreating from its all-time high. Its 2021 high of $485 defines initial support to watch after its recent breakout from a 2+ year base.
>>> FEATURED STOCK ARTICLE : Lululemon Breaks Out to New All-Time High - 12/8/2023 |
View all notes |
Set NEW NOTE alert |
Company Profile |
SEC
News |
Chart |
Request a new note
C
A
S
I |
Symbol/Exchange
Company Name
Industry Group |
PRICE |
CHANGE
(%Change) |
Day High |
Volume
(% DAV)
(% 50 day avg vol) |
52 Wk Hi
% From Hi |
Featured
Date |
Price
Featured |
Pivot Featured |
|
Max Buy |
|
|
|
THESE ARE NOT BUY RECOMMENDATIONS!
Comments contained in the body of this report are technical
opinions only. The material herein has been obtained
from sources believed to be reliable and accurate, however,
its accuracy and completeness cannot be guaranteed.
This site is not an investment advisor, hence it does
not endorse or recommend any securities or other investments.
Any recommendation contained in this report may not
be suitable for all investors and it is not to be deemed
an offer or solicitation on our part with respect to
the purchase or sale of any securities. All trademarks,
service marks and trade names appearing in this report
are the property of their respective owners, and are
likewise used for identification purposes only.
This report is a service available
only to active Paid Premium Members.
You may opt-out of receiving report notifications
at any time. Questions or comments may be submitted
by writing to Premium Membership Services 665 S.E. 10 Street, Suite 201 Deerfield Beach, FL 33441-5634 or by calling 1-800-965-8307
or 954-785-1121.
|
|
|