You are not logged in.
This means you
CAN ONLY VIEW reports that were published prior to Tuesday, March 25, 2025.
You
MUST UPGRADE YOUR MEMBERSHIP if you want to see any current reports.
AFTER MARKET UPDATE - THURSDAY, JANUARY 4TH, 2024
Previous After Market Report Next After Market Report >>>
|
|
|
|
DOW |
+10.15 |
37,440.34 |
+0.03% |
|
Volume |
1,036,800,949 |
+6% |
|
Volume |
5,442,072,200 |
-3% |
|
NASDAQ |
-81.91 |
14,510.30 |
-0.56% |
|
Advancers |
1,330 |
48% |
|
Advancers |
2,060 |
48% |
|
S&P 500 |
-16.13 |
4,688.68 |
-0.34% |
|
Decliners |
1,428 |
52% |
|
Decliners |
2,196 |
52% |
|
Russell 2000 |
-1.47 |
1,957.73 |
-0.08% |
|
52 Wk Highs |
59 |
|
|
52 Wk Highs |
79 |
|
|
S&P 600 |
-1.10 |
1,274.52 |
-0.09% |
|
52 Wk Lows |
15 |
|
|
52 Wk Lows |
87 |
|
|
 |
Nasdaq Composite Index Led Major Indices Lower
Kenneth J. Gruneisen - Passed the CAN SLIM® Master's Exam
The S&P 500 fell -0.34% and the Nasdaq Composite registered a -0.56% loss while the Dow Jones Industrial Average finished slightly higher. Volume was reported mixed, higher than the prior session total on the NYSE and lighter on the Nasdaq exchange. Decliners led advancers by a narrow margin on the NYSE and on the Nasdaq exchange. There were 25 high-ranked companies from the Leaders List that hit new 52-week highs and were listed on the BreakOuts Page, versus the total of 15 on the prior session. New 52-week highs outnumbered new 52-week lows on the NYSE but new lows outnumbered new highs on the Nasdaq exchange for a 2nd consecutive session. The major indices are in a confirmed uptrend (M criteria). New buying efforts should be only made in stocks fitting all key criteria of the fact-based investment system.
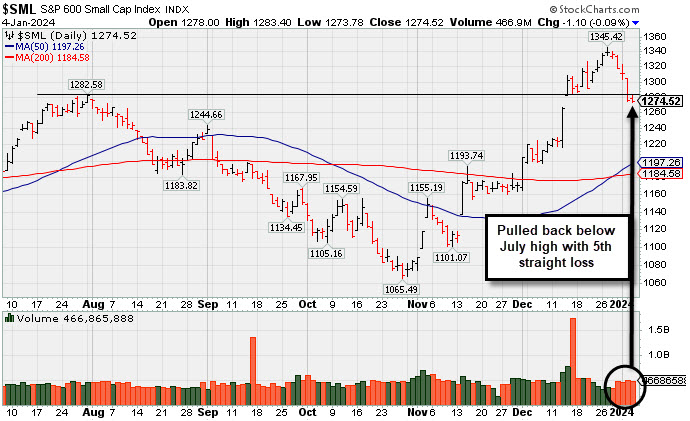
PICTURED: The S&P 600 Small Cap Index pulled back for a 5th straight loss off its recent high, slumping below its late-July high. Apple (AAPL -1.27%) edged lower after an analyst downgrade. Microsoft (MSFT -0.72%) and Tesla (TSLA -0.22%) gave up early gains to ende lower.
The S&P 500 sector that saw some of the largest declines was the energy sector (-1.6%). Meanwhile, the health care (+0.5%) and financials (+0.2%) sectors outperformed.
The 2-yr note yield rose five basis points to 4.37% and the 10-yr note yield climbed eight basis points to 3.99%. Market participants await the December jobs report due Friday.
|
 Kenneth J. Gruneisen started out as a licensed stockbroker in August 1987, a couple of months prior to the historic stock market crash that took the Dow Jones Industrial Average down -22.6% in a single day. He has published daily fact-based fundamental and technical analysis on high-ranked stocks online for two decades. Through FACTBASEDINVESTING.COM, Kenneth provides educational articles, news, market commentary, and other information regarding proven investment systems that work in good times and bad.
Comments contained in the body of this report are technical opinions only and are not necessarily those of Gruneisen Growth Corp. The material herein has been obtained from sources believed to be reliable and accurate, however, its accuracy and completeness cannot be guaranteed. Our firm, employees, and customers may effect transactions, including transactions contrary to any recommendation herein, or have positions in the securities mentioned herein or options with respect thereto. Any recommendation contained in this report may not be suitable for all investors and it is not to be deemed an offer or solicitation on our part with respect to the purchase or sale of any securities. |
|
 |
Retail, Semiconductor, Networking and Energy-Linked Indexes Felll
Kenneth J. Gruneisen - Passed the CAN SLIM® Master's Exam
The Bank Index ($BKX +0.59%) edged higher and the Broker/Dealer Index ($XBD +0.14%) inched higher, but the Retail Index ($RLX -1.62%) finished weak and created a drag on the major indices. The Semiconductor Index ($SOX -0.82%) and the Networking Index ($NWX -0.95%) both fell while the Biotech Index ($BTK +0.59%) posted a small gain. The Gold & Silver Index ($XAU +0.24%) eked out a small gain while the Oil Services Index ($OSX -2.16%) and the Integrated Oil Index ($XOI -1.83%) both fell.
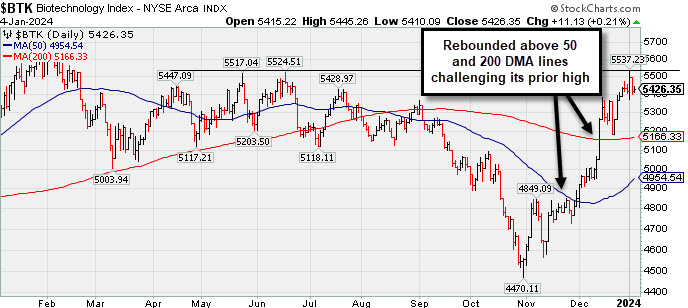
PICTURED: The Biotech Index ($BTK -1.48%) is consolidating near the recent high after rebounding above its 50 and 200 DMA lines.
|
|
|
 |
Featured Stocks
Kenneth J. Gruneisen - Passed the CAN SLIM® Master's Exam
|
|
|
Color Codes Explained :
Y - Better candidates highlighted by our
staff of experts.
G - Previously featured
in past reports as yellow but may no longer be buyable under the
guidelines.
***Last / Change / Volume data in this table is the closing quote data***
Symbol/Exchange
Company Name
Industry Group |
PRICE |
CHANGE
(%Change) |
Day High |
Volume
(% DAV)
(% 50 day avg vol) |
52 Wk Hi
% From Hi |
Featured
Date |
Price
Featured |
Pivot Featured |
|
Max Buy |
 ANET
-
NYSE
ANET
-
NYSE
Arista Networks
Computer-Networking
|
$230.56
|
+1.16
0.51% |
$232.31
|
1,326,669
63.23% of 50 DAV
50 DAV is 2,098,000
|
$240.68
-4.20%
|
10/31/2023
|
$188.84
|
PP = $198.80
|
|
MB = $208.74
|
Most Recent Note - 1/2/2024 6:24:55 PM
G - Pulling back after hovering near its all-time high, extended from any sound base. Its 50 DMA line ($215.66) defines near-term support above the prior low in the $210 area. Fundamentals remain strong.
>>> FEATURED STOCK ARTICLE : Extended From Base and Hovering at All-Time High - 12/26/2023 |
View all notes |
Set NEW NOTE alert |
Company Profile |
SEC
News |
Chart |
Request a new note
C
A
S
I |
NVO
-
NYSE
Novo Nordisk ADR
Medical-Ethical Drugs
|
$107.63
|
+4.01
3.87% |
$108.98
|
9,132,804
225.11% of 50 DAV
50 DAV is 4,057,000
|
$105.69
1.84%
|
11/2/2023
|
$100.97
|
PP = $104.10
|
|
MB = $109.31
|
 Most Recent Note - 1/4/2024 12:41:01 PM
Y - Gapped up today and it is hitting a new all-time high. Recently wedged toward its high with gains lacking great volume conviction. Its 50 DMA line ($100) defines initial support above the recent low ($94.73 on 12/11/23) on pullbacks.
>>> FEATURED STOCK ARTICLE : Managed a "Positive Reversal" but Still Below 50-Day Moving Average - 12/11/2023 |
View all notes |
Set NEW NOTE alert |
Company Profile |
SEC
News |
Chart |
Request a new note
C
A
S
I |
QLYS
-
NASDAQ
Qualys
Computer Sftwr-Security
|
$184.21
|
-1.15
-0.62% |
$189.01
|
335,341
91.62% of 50 DAV
50 DAV is 366,000
|
$206.35
-10.73%
|
11/3/2023
|
$167.50
|
PP = $165.03
|
|
MB = $173.28
|
Most Recent Note - 1/3/2024 7:07:08 PM
G - Pulled back today for a 6th consecutive loss with ever-increasing volume. It is very extended from any sound base. Its 50 DMA line ($180) defines initial support to watch.
>>> FEATURED STOCK ARTICLE : Extended From Base Following Big Breakout - 12/12/2023 |
View all notes |
Set NEW NOTE alert |
Company Profile |
SEC
News |
Chart |
Request a new note
C
A
S
I |
AXON
-
NASDAQ
Axon Enterprise
Security/Sfty
|
$244.81
|
-2.62
-1.06% |
$249.56
|
494,296
112.09% of 50 DAV
50 DAV is 441,000
|
$260.69
-6.09%
|
11/8/2023
|
$127.84
|
PP = $223.30
|
|
MB = $234.47
|
Most Recent Note - 12/28/2023 6:17:58 PM
G - Volume totals have been cooling while stubbornly holding its ground near its all-time high. On pullbacks, the prior highs in the $229-231 area define near-term support to watch coinciding with its 50-day moving average (DMA) line ($229).
>>> FEATURED STOCK ARTICLE : Axon Enterprise Hits New High With 6th Straight Gain - 12/13/2023 |
View all notes |
Set NEW NOTE alert |
Company Profile |
SEC
News |
Chart |
Request a new note
C
A
S
I |
TDG
-
NYSE
TransDigm Group
Aerospace/Defense
|
$975.53
|
+2.92
0.30% |
$994.18
|
207,083
91.23% of 50 DAV
50 DAV is 227,000
|
$1,018.50
-4.22%
|
12/12/2023
|
$1,000.39
|
PP = $1,013.18
|
|
MB = $1,063.84
|
Most Recent Note - 1/2/2024 6:26:48 PM
Y - Pulled back today with near-average (higher) volume. The new pivot point cited was based on its 11/14/23 high plus 10 cents, however, recent gains above the pivot point were not backed by the +40% above-average volume necessary to trigger a proper new technical buy signal. Fundamentals remain strong. Recent lows in the $950 area define near-term support to watch on pullbacks.
>>> FEATURED STOCK ARTICLE : Volume-Driven Loss Breaks Streak of 6 Straight Gains - 12/14/2023 |
View all notes |
Set NEW NOTE alert |
Company Profile |
SEC
News |
Chart |
Request a new note
C
A
S
I |
Symbol/Exchange
Company Name
Industry Group |
PRICE |
CHANGE
(%Change) |
Day High |
Volume
(% DAV)
(% 50 day avg vol) |
52 Wk Hi
% From Hi |
Featured
Date |
Price
Featured |
Pivot Featured |
|
Max Buy |
PANW
-
NASDAQ
Palo Alto Networks
Computer Sftwr-Security
|
$283.30
|
-3.17
-1.11% |
$287.48
|
2,542,677
59.19% of 50 DAV
50 DAV is 4,296,000
|
$318.00
-10.91%
|
11/13/2023
|
$255.90
|
PP = $266.00
|
|
MB = $279.30
|
Most Recent Note - 1/2/2024 6:28:03 PM
G - Pulled back today with below-average volume for a 4th consecutive loss. Prior highs in the $265 area define important support to watch along with its 50 DMA line ($272). Fundamentals remain strong.
>>> FEATURED STOCK ARTICLE : Consolidating After Volume-Driven Gains for All-Time Highs - 12/15/2023 |
View all notes |
Set NEW NOTE alert |
Company Profile |
SEC
News |
Chart |
Request a new note
C
A
S
I |
URI
-
NYSE
United Rentals
Comml Svcs-Leasing
|
$548.86
|
+1.70
0.31% |
$558.26
|
547,851
75.05% of 50 DAV
50 DAV is 730,000
|
$585.50
-6.26%
|
12/1/2023
|
$499.51
|
PP = $488.73
|
|
MB = $513.17
|
Most Recent Note - 1/3/2024 7:03:37 PM
G - Pulled back today with higher volume behind a 5th consecutive loss, reteating from its all-time high. On pullbacks, the prior highs define near-term support to watch above its 50 DMA line ($486.62).
>>> FEATURED STOCK ARTICLE : Perched Near All-Time High Following Volume-Driven Gains - 12/19/2023 |
View all notes |
Set NEW NOTE alert |
Company Profile |
SEC
News |
Chart |
Request a new note
C
A
S
I |
AMPH
-
NASDAQ
Amphastar Pharm
Medical-Biomed/Biotech
|
$63.45
|
+2.41
3.95% |
$64.42
|
541,828
124.85% of 50 DAV
50 DAV is 434,000
|
$67.66
-6.22%
|
12/4/2023
|
$60.84
|
PP = $58.35
|
|
MB = $61.27
|
Most Recent Note - 12/28/2023 6:16:08 PM
G - Color code is changed to green after Tuesday's volume-driven gain triggered a technical buy signal and it rose above its "max buy" level. Little resistance remains due to overhead supply. Fundamentals remain strong.
>>> FEATURED STOCK ARTICLE : Consolidating Above Pivot Point With Volume Cooling - 12/21/2023 |
View all notes |
Set NEW NOTE alert |
Company Profile |
SEC
News |
Chart |
Request a new note
C
A
S
I |
TBBK
-
NASDAQ
The Bancorp
Banks-Northeast
|
$37.73
|
+0.70
1.89% |
$38.17
|
418,027
96.54% of 50 DAV
50 DAV is 433,000
|
$42.46
-11.14%
|
12/4/2023
|
$39.88
|
PP = $41.62
|
|
MB = $43.70
|
Most Recent Note - 1/3/2024 7:06:27 PM
G - Violated its 50 DMA line ($38.39) with higher volume behind today's 5th consecutive loss raising concerns and its color code is changed to green. A prompt rebound above the 50 DMA line is needed for its outlook to improve.
>>> FEATURED STOCK ARTICLE : Negative Reversals are Signs of Distributional Pressure - 12/22/2023 |
View all notes |
Set NEW NOTE alert |
Company Profile |
SEC
News |
Chart |
Request a new note
C
A
S
I |
LULU
-
NASDAQ
lululemon athletica
Retail-Apparel/Shoes/Acc
|
$495.95
|
-2.07
-0.42% |
$502.00
|
1,174,377
76.86% of 50 DAV
50 DAV is 1,528,000
|
$516.39
-3.96%
|
12/8/2023
|
$490.61
|
PP = $485.93
|
|
MB = $510.23
|
Most Recent Note - 1/3/2024 7:02:07 PM
Y - Quietly pulling back yet lingering near its all-time high below its "max buy" level with volume totals cooling. Its 2021 high of $485 defines initial support to watch after its recent breakout from a 2+ year base.
>>> FEATURED STOCK ARTICLE : Perched at All-Time High With Volume Totals Cooling - 12/27/2023 |
View all notes |
Set NEW NOTE alert |
Company Profile |
SEC
News |
Chart |
Request a new note
C
A
S
I |
Symbol/Exchange
Company Name
Industry Group |
PRICE |
CHANGE
(%Change) |
Day High |
Volume
(% DAV)
(% 50 day avg vol) |
52 Wk Hi
% From Hi |
Featured
Date |
Price
Featured |
Pivot Featured |
|
Max Buy |
CRWD
-
NASDAQ
CrowdStrike Holdings
Computer Sftwr-Security
|
$245.66
|
+1.30
0.53% |
$247.61
|
2,102,955
69.38% of 50 DAV
50 DAV is 3,031,000
|
$261.81
-6.17%
|
1/2/2024
|
$246.42
|
PP = $261.91
|
|
MB = $275.01
|
Most Recent Note - 1/3/2024 7:00:41 PM
Y - Pulled back from its 52-week high with today's 5th consecutive loss. Color code was changed to yellow as it formed an advanced "3-weeks tight" base with the pivot point cited based on its 12/18/23 high plus 10 cents. Subsequent gains above the pivot point backed by at least +40% above average volume may trigger a technical buy signal. Reported Oct '23 quarterly earnings +105% on +35% sales revenues versus the year-ago period, extending its streak of strong earnings increases well above the +25% minimum guideline (C criteria) in quarterly comparisons. Faces no resistance due to overhead supply. Annual earnings history has been strong. Completed its $34 IPO on 6/12/19. See the latest FSU analysis for more details and a new annotated graph.
>>> FEATURED STOCK ARTICLE : CrowdStrike Holdings Pulling Back After "3-Weeks Tight" Pattern - 1/3/2024 |
View all notes |
Set NEW NOTE alert |
Company Profile |
SEC
News |
Chart |
Request a new note
C
A
S
I |
ELF
-
NYSE
e.l.f. Beauty
Cosmetics/Personal Care
|
$137.27
|
+5.11
3.87% |
$139.00
|
821,911
55.95% of 50 DAV
50 DAV is 1,469,000
|
$153.53
-10.59%
|
1/2/2024
|
$138.23
|
PP = $153.63
|
|
MB = $161.31
|
Most Recent Note - 1/3/2024 7:04:55 PM
Y - Pulled back for a 3rd consecutive loss. Pivot point cited recently was based on its 12/20/23 high plus 10 cents after forming an advanced "3 weeks tight" base. Subsequent volume-driven gains for new highs are needed to trigger a technical buy signal. Reported Sep '23 quarterly earnings +128% on +76% sales revenues versus the year-ago period, adding to its streak of very strong quarterly results well above the +25% minimum earnings guideline (C criteria). Annual earnings (A criteria) history over the past 3 years has been strong, making it a better match with the fact-based investment system's fundamental guidelines.
>>> FEATURED STOCK ARTICLE : Pulled Back After Closing 3 Weeks Tight - 1/2/2024 |
View all notes |
Set NEW NOTE alert |
Company Profile |
SEC
News |
Chart |
Request a new note
C
A
S
I |
|
|
|
THESE ARE NOT BUY RECOMMENDATIONS!
Comments contained in the body of this report are technical
opinions only. The material herein has been obtained
from sources believed to be reliable and accurate, however,
its accuracy and completeness cannot be guaranteed.
This site is not an investment advisor, hence it does
not endorse or recommend any securities or other investments.
Any recommendation contained in this report may not
be suitable for all investors and it is not to be deemed
an offer or solicitation on our part with respect to
the purchase or sale of any securities. All trademarks,
service marks and trade names appearing in this report
are the property of their respective owners, and are
likewise used for identification purposes only.
This report is a service available
only to active Paid Premium Members.
You may opt-out of receiving report notifications
at any time. Questions or comments may be submitted
by writing to Premium Membership Services 665 S.E. 10 Street, Suite 201 Deerfield Beach, FL 33441-5634 or by calling 1-800-965-8307
or 954-785-1121.
|
|
|