You are not logged in.
This means you
CAN ONLY VIEW reports that were published prior to Saturday, April 12, 2025.
You
MUST UPGRADE YOUR MEMBERSHIP if you want to see any current reports.
AFTER MARKET UPDATE - MONDAY, DECEMBER 11TH, 2023
Previous After Market Report Next After Market Report >>>
|
|
|
|
DOW |
+157.06 |
36,404.93 |
+0.43% |
|
Volume |
924,415,408 |
+5% |
|
Volume |
5,649,947,800 |
+3% |
|
NASDAQ |
+28.51 |
14,432.49 |
+0.20% |
|
Advancers |
1,407 |
50% |
|
Advancers |
1,906 |
44% |
|
S&P 500 |
+18.07 |
4,622.44 |
+0.39% |
|
Decliners |
1,385 |
50% |
|
Decliners |
2,402 |
56% |
|
Russell 2000 |
+2.86 |
1,883.68 |
+0.15% |
|
52 Wk Highs |
114 |
|
|
52 Wk Highs |
195 |
|
|
S&P 600 |
+6.48 |
1,226.69 |
+0.53% |
|
52 Wk Lows |
28 |
|
|
52 Wk Lows |
145 |
|
|
 |
Major Indices Posted Gains Backed by Higher Volume Totals
Kenneth J. Gruneisen - Passed the CAN SLIM® Master's Exam
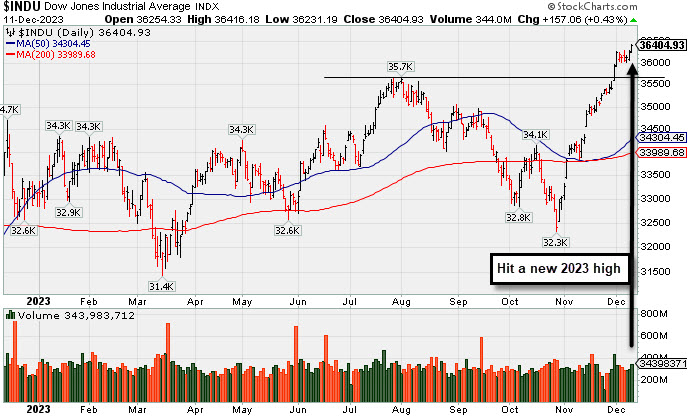
The equal-weighted S&P 500 closed with a 0.9% gain while the market-cap weighted S&P 500 logged a 0.4% gain. The major indices overcame a mixed start and climbed through the afternoon to finish the session near their best levels. Volume was reported higher than the prior session total on the NYSE and on the Nasdaq exchange. Advancers led decliners by a narrow margin on the NYSE but decliners led advancers by about a 6-5 margin on the Nasdaq exchange. There were 69 high-ranked companies from the Leaders List that hit new 52-week highs and were listed on the BreakOuts Page, versus the total of 73 on the prior session. New 52-week highs totals expanded and outnumbered new 52-week lows on the NYSE and on the Nasdaq exchange. The major indices are in a confirmed uptrend (M criteria). New buying efforts should be only made in stocks fitting all key criteria of the fact-based investment system.
PICTURED: The Dow Jones Industrial Average hit a new 2023 high. Only one of the S&P 500 sectors fell, communication services (-1.0%), while the consumer staples (+1.0%) and industrial (+0.9%) sectors saw the biggest gains. Semiconductor equipment stocks had a strong showing on a WSJ report that New York is joining with semiconductor companies to invest in a research facility at the University of Albany.
There was no new U.S. economic data of note. Investors are awaiting the November Consumer Price Index on Tuesday, the FOMC meeting on Wednesday, and the November Retail Sales Report on Thursday. The ECB and Bank of England also have their policy meetings on Thursday.
Today's $50 billion 3-yr note auction and $37 billion 10-yr note auction were both met with weak demand. The 2-yr note yield fell one basis point to 4.73% and the 10-yr note yield declined one basis point to 4.24%.
|
 Kenneth J. Gruneisen started out as a licensed stockbroker in August 1987, a couple of months prior to the historic stock market crash that took the Dow Jones Industrial Average down -22.6% in a single day. He has published daily fact-based fundamental and technical analysis on high-ranked stocks online for two decades. Through FACTBASEDINVESTING.COM, Kenneth provides educational articles, news, market commentary, and other information regarding proven investment systems that work in good times and bad.
Comments contained in the body of this report are technical opinions only and are not necessarily those of Gruneisen Growth Corp. The material herein has been obtained from sources believed to be reliable and accurate, however, its accuracy and completeness cannot be guaranteed. Our firm, employees, and customers may effect transactions, including transactions contrary to any recommendation herein, or have positions in the securities mentioned herein or options with respect thereto. Any recommendation contained in this report may not be suitable for all investors and it is not to be deemed an offer or solicitation on our part with respect to the purchase or sale of any securities. |
|
 |
Semiconductor Index Led Tech Sector Higher
Kenneth J. Gruneisen - Passed the CAN SLIM® Master's Exam
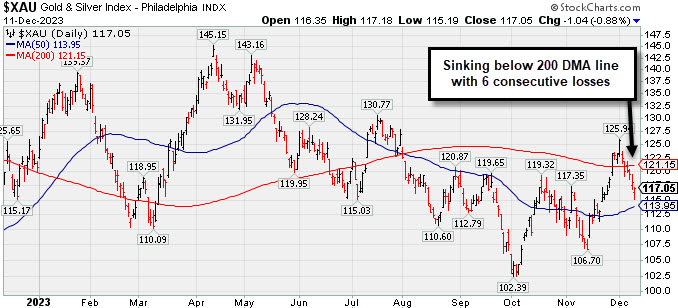
The Bank Index ($BKX +0.05%) and the Broker/Dealer Index ($XBD +0.34%) both inched higher while the Retail Index ($RLX -0.15%) inched higher. The tech sector had a positive bias as the Semiconductor Index ($SOX +3.40%) and Networking Index ($NWX +2.50%) both posted solid gains while the Biotech Index ($BTK +0.83%) followed with a smaller gain. The Integrated Oil Index ($XOI +0.27%) inched higher while the Oil Services Index ($OSX -0.16%) ended slightly in the red.
PICTURED: The Gold & Silver Index ($XAU -0.88%) lost more ground, slumping further below its 200 DMA line with a 6th consecutive loss.
| Oil Services |
$OSX |
78.88 |
-0.13 |
-0.16% |
-5.93% |
| Integrated Oil |
$XOI |
1,796.18 |
+4.82 |
+0.27% |
+0.50% |
| Semiconductor |
$SOX |
3,902.38 |
+128.21 |
+3.40% |
+54.12% |
| Networking |
$NWX |
779.69 |
+19.00 |
+2.50% |
-0.46% |
| Broker/Dealer |
$XBD |
521.45 |
+1.77 |
+0.34% |
+16.10% |
| Retail |
$RLX |
3,736.62 |
-5.79 |
-0.15% |
+35.68% |
| Gold & Silver |
$XAU |
117.05 |
-1.04 |
-0.88% |
-3.15% |
| Bank |
$BKX |
88.68 |
+0.05 |
+0.05% |
-12.07% |
| Biotech |
$BTK |
4,997.17 |
+40.90 |
+0.83% |
-5.38% |
|
|
|
 |
Managed a "Positive Reversal" but Still Below 50-Day Moving Average
Kenneth J. Gruneisen - Passed the CAN SLIM® Master's Exam
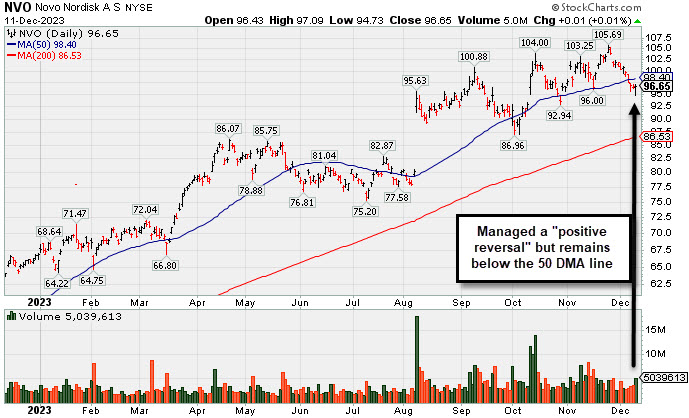
Novo Nordisk (NVO +$0.01 or +0.01% to $96.65) suffered a 5th consecutive loss with lackluster volume. It gapped down on 11/28/23 then steadily slumped below its 50-day moving average (DMA) line in recent weeks. A prompt rebound above the 50 DMA line is needed for its outlook to improve.
NVO was highlighted in yellow in the 11/02/23 mid-day report (read here) with pivot point cited based on its 10/13/23 high plus 10 cents while building on an advanced ascending base. Disciplined investors will note that it did not produce the subsequent gains for new highs backed by at least +40% above average volume needed to trigger a technical buy signal. It wedged higher with gains lacking volume conviction.
This Denmark-based Medical - Ethical Drugs firm's shares split 2-1 on 9/20/23. NVO reported Sep '23 quarterly earnings +69% on +39% sales revenues versus the year-ago period, its 3rd strong quarter well above the +25% minimum earnings guideline (C criteria). Annual earnings growth has been slow and steady. It has a 97 Earnings Per Share Rating, well above the 80+ minimum for buy candidates.
The number of top-rated funds owning its shares rose from 372 in Dec '22 to 448 in Sep '23, a reassuring sign concerning the I criteria. Its current Up/Down Volume Ratio of 1.3 is an unbiased indication its shares have been under accumulation over the past 50 days. It has a Timeliness Rating of B and an Accumulation/Distribution Rating of B. |
|
|
Color Codes Explained :
Y - Better candidates highlighted by our
staff of experts.
G - Previously featured
in past reports as yellow but may no longer be buyable under the
guidelines.
***Last / Change / Volume data in this table is the closing quote data***
Symbol/Exchange
Company Name
Industry Group |
PRICE |
CHANGE
(%Change) |
Day High |
Volume
(% DAV)
(% 50 day avg vol) |
52 Wk Hi
% From Hi |
Featured
Date |
Price
Featured |
Pivot Featured |
|
Max Buy |
 ANET
-
NYSE
ANET
-
NYSE
Arista Networks
Computer-Networking
|
$226.57
|
+2.54
1.13% |
$227.54
|
2,002,413
92.28% of 50 DAV
50 DAV is 2,170,000
|
$224.23
1.04%
|
10/31/2023
|
$188.84
|
PP = $198.80
|
|
MB = $208.74
|
Most Recent Note - 12/8/2023 5:24:25 PM
G - Ended near the session high today and hit a new all-time high with today's gain backed by average volume. Prior highs in the $198 area define near-term support above its 50 DMA line ($202.75). Fundamentals remain strong.
>>> FEATURED STOCK ARTICLE : Made Gradual Progress Since Latest Breakout - 12/6/2023 |
View all notes |
Set NEW NOTE alert |
Company Profile |
SEC
News |
Chart |
Request a new note
C
A
S
I |
NVO
-
NYSE
Novo Nordisk ADR
Medical-Ethical Drugs
|
$96.65
|
+0.01
0.01% |
$97.09
|
4,841,303
102.53% of 50 DAV
50 DAV is 4,722,000
|
$105.69
-8.55%
|
11/2/2023
|
$100.97
|
PP = $104.10
|
|
MB = $109.31
|
 Most Recent Note - 12/11/2023 10:06:22 PM
G - Managed a "positive reversal" today but remains below its 50 DMA line ($98.41). A rebound above the 50 DMA line is needed for its outlook to improve.
>>> FEATURED STOCK ARTICLE : Managed a "Positive Reversal" but Still Below 50-Day Moving Average - 12/11/2023 |
View all notes |
Set NEW NOTE alert |
Company Profile |
SEC
News |
Chart |
Request a new note
C
A
S
I |
QLYS
-
NASDAQ
Qualys
Computer Sftwr-Security
|
$189.20
|
+0.88
0.47% |
$190.00
|
392,121
108.92% of 50 DAV
50 DAV is 360,000
|
$190.00
-0.42%
|
11/3/2023
|
$167.50
|
PP = $165.03
|
|
MB = $173.28
|
Most Recent Note - 12/6/2023 5:44:24 PM
G - Volume was light today while hovering near all-time high. Prior high ($165) defines initial support to watch on pullbacks.
>>> FEATURED STOCK ARTICLE : Powerful Breakout for Qualys - 11/3/2023 |
View all notes |
Set NEW NOTE alert |
Company Profile |
SEC
News |
Chart |
Request a new note
C
A
S
I |
AXON
-
NASDAQ
Axon Enterprise
Security/Sfty
|
$238.84
|
+2.46
1.04% |
$238.96
|
302,279
67.17% of 50 DAV
50 DAV is 450,000
|
$238.96
-0.05%
|
11/8/2023
|
$127.84
|
PP = $223.30
|
|
MB = $234.47
|
Most Recent Note - 12/11/2023 10:11:11 PM
G - Color code is changed to green as it hit a new high above its "max buy" level with today's 4th consecutive gain backed by light volume. The recent low ($212.89 on 11/09/23) defines near-term support above its 50 DMA line ($217.67).
>>> FEATURED STOCK ARTICLE : Breakout for Axon as it Returns to Featured Stocks List - 11/8/2023 |
View all notes |
Set NEW NOTE alert |
Company Profile |
SEC
News |
Chart |
Request a new note
C
A
S
I |
TDG
-
NYSE
TransDigm Group
Aerospace/Defense
|
$992.52
|
+8.60
0.87% |
$994.69
|
145,320
59.80% of 50 DAV
50 DAV is 243,000
|
$1,013.08
-2.03%
|
11/9/2023
|
$982.68
|
PP = $940.10
|
|
MB = $987.11
|
Most Recent Note - 12/6/2023 5:48:01 PM
G - Volume totals have been cooling while consolidating in recent weeks after briefly trading above the $1,000 threshold. Fundamentals remain strong. Prior high ($940) defines initial support to watch on pullbacks.
>>> FEATURED STOCK ARTICLE : TransDigm's Big Gap Up Gain Triggered Technical Buy Signal - 11/9/2023 |
View all notes |
Set NEW NOTE alert |
Company Profile |
SEC
News |
Chart |
Request a new note
C
A
S
I |
Symbol/Exchange
Company Name
Industry Group |
PRICE |
CHANGE
(%Change) |
Day High |
Volume
(% DAV)
(% 50 day avg vol) |
52 Wk Hi
% From Hi |
Featured
Date |
Price
Featured |
Pivot Featured |
|
Max Buy |
PANW
-
NASDAQ
Palo Alto Networks
Computer Sftwr-Security
|
$299.88
|
+1.46
0.49% |
$300.11
|
4,035,454
98.38% of 50 DAV
50 DAV is 4,102,000
|
$299.12
0.25%
|
11/13/2023
|
$255.90
|
PP = $266.00
|
|
MB = $279.30
|
Most Recent Note - 12/11/2023 10:12:37 PM
G - Posted a 3rd consecutive gain today for a new all-time high. Prior highs in the $265 area define initial support to watch above its 50 DMA line ($258.32). Fundamentals remain strong after it reported Oct '23 quarterly earnings +66% on +20% sales revenues versus the year-ago period.
>>> FEATURED STOCK ARTICLE : Earnings New Due While Perched Near Prior High - 11/13/2023 |
View all notes |
Set NEW NOTE alert |
Company Profile |
SEC
News |
Chart |
Request a new note
C
A
S
I |
URI
-
NYSE
United Rentals
Comml Svcs-Leasing
|
$505.14
|
+10.08
2.04% |
$505.90
|
554,647
73.46% of 50 DAV
50 DAV is 755,000
|
$505.16
-0.00%
|
12/1/2023
|
$499.51
|
PP = $488.73
|
|
MB = $513.17
|
Most Recent Note - 12/8/2023 5:26:46 PM
Y - Posted a 3rd consecutive gain with below average volume today. Highlighted in yellow in the 12/01/23 mid-day report with new pivot point cited based on its 11/15/23 high after a cup-with-handle base. The recent low ($454.71 on 11/28/23) defines near-term support to watch.
>>> FEATURED STOCK ARTICLE : New Breakout For United Rentals - 12/1/2023 |
View all notes |
Set NEW NOTE alert |
Company Profile |
SEC
News |
Chart |
Request a new note
C
A
S
I |
AMPH
-
NASDAQ
Amphastar Pharm
Medical-Biomed/Biotech
|
$57.06
|
+0.29
0.50% |
$58.31
|
285,485
73.20% of 50 DAV
50 DAV is 390,000
|
$67.66
-15.67%
|
12/4/2023
|
$60.84
|
PP = $58.35
|
|
MB = $61.27
|
Most Recent Note - 12/11/2023 10:08:20 PM
Y - Posted a small gain today with light volume. New pivot point cited was based on its 11/21/23 high after a cup-with-handle base. Little resistance remains due to overhead supply. A gain and strong close above the pivot point backed by at least +40% above average volume may trigger a proper new technical buy signal. Fundamentals remain strong.
>>> FEATURED STOCK ARTICLE : Amphastar Pharm on Track for 7th Weekly Gain - 12/4/2023 |
View all notes |
Set NEW NOTE alert |
Company Profile |
SEC
News |
Chart |
Request a new note
C
A
S
I |
TBBK
-
NASDAQ
The Bancorp
Banks-Northeast
|
$38.95
|
-0.34
-0.87% |
$39.46
|
526,683
138.24% of 50 DAV
50 DAV is 381,000
|
$41.52
-6.19%
|
12/4/2023
|
$39.88
|
PP = $41.62
|
|
MB = $43.70
|
Most Recent Note - 12/8/2023 1:02:10 PM
Y - Perched within close striking distance of its 52-week high. Pivot point cited was based on its 7/27/23 high plus 10 cents. Subsequent gains above the pivot point backed by at least +40% above average volume may trigger a technical buy signal. The 4 latest quarterly comparisons through Sep '23 had earnings increases above the +25% minimum guideline (C criteria) versus the year ago period. Annual earnings history has been strong.
>>> FEATURED STOCK ARTICLE : The Bancorp is Perched Near High with Strong Fundamentals - 12/5/2023 |
View all notes |
Set NEW NOTE alert |
Company Profile |
SEC
News |
Chart |
Request a new note
C
A
S
I |
LULU
-
NASDAQ
lululemon athletica
Retail-Apparel/Shoes/Acc
|
$502.74
|
+13.10
2.68% |
$507.44
|
2,787,878
119.40% of 50 DAV
50 DAV is 2,335,000
|
$493.80
1.81%
|
12/8/2023
|
$490.61
|
PP = $485.93
|
|
MB = $510.23
|
Most Recent Note - 12/11/2023 10:16:02 PM
Y - Rallying from a 2-year long base, it posted a 3rd consecutive gain today backed by +19% above average volume for another new all-time high. Pivot point cited was based on its Nov '21 high plus 10 cents.
>>> FEATURED STOCK ARTICLE : Lululemon Breaks Out to New All-Time High - 12/8/2023 |
View all notes |
Set NEW NOTE alert |
Company Profile |
SEC
News |
Chart |
Request a new note
C
A
S
I |
Symbol/Exchange
Company Name
Industry Group |
PRICE |
CHANGE
(%Change) |
Day High |
Volume
(% DAV)
(% 50 day avg vol) |
52 Wk Hi
% From Hi |
Featured
Date |
Price
Featured |
Pivot Featured |
|
Max Buy |
|
|
|
THESE ARE NOT BUY RECOMMENDATIONS!
Comments contained in the body of this report are technical
opinions only. The material herein has been obtained
from sources believed to be reliable and accurate, however,
its accuracy and completeness cannot be guaranteed.
This site is not an investment advisor, hence it does
not endorse or recommend any securities or other investments.
Any recommendation contained in this report may not
be suitable for all investors and it is not to be deemed
an offer or solicitation on our part with respect to
the purchase or sale of any securities. All trademarks,
service marks and trade names appearing in this report
are the property of their respective owners, and are
likewise used for identification purposes only.
This report is a service available
only to active Paid Premium Members.
You may opt-out of receiving report notifications
at any time. Questions or comments may be submitted
by writing to Premium Membership Services 665 S.E. 10 Street, Suite 201 Deerfield Beach, FL 33441-5634 or by calling 1-800-965-8307
or 954-785-1121.
|
|
|