Pulled Back Abruptly to 50-Day Moving Average Line - Monday, July 24, 2023
SPS Commerce (SPSC -1.93% or $177.89) suffered a 4th consecutive loss today, slumping near its 50-day moving average (DMA) line which defines important near-term support to watch. Keep in mind it is due top report Jun '23 quarterly results on 7/27/23. Volume and volatility often increase near earnings news.
Recently it reported Mar '23 quarterly earnings +22% on +20% versus the year-ago period, below the +25% minimum earnings guideline (C criteria) raising some fundamental concerns. Two of the 4 latest quarterly comparisons were above the +25% minimum earnings guideline (C criteria). Annual earnings (A criteria) history has been strong and it still has an Earnings Per Share Rating of 98.
SPSC was highlighted in yellow in the 4/24/23 mid-day report with new pivot point cited based on its 2/15/23 high plus 10 cents. It was last shown in this FSU section in greater detail on 6/21/23 with an annotated graph under the headline, "Perched Near High Following Noted Volume-Driven Gains".
SPSC hails from the Computer Software - Spec Enterprise group which is currently ranked 4th on the 197 Industry Groups list (L criteria). The number of top-rated funds owning its shares rose from 562 in Sep '22 to 601 in Jun '23, a reassuring sign concerning the I criteria. Its current Up/Down Volume Ratio of 1.5 is an unbiased indication its shares have been under accumulation over the past 50 days. It has a Timeliness Rating of A and Sponsorship Rating of B. The small supply of 36.5 million shares outstanding (S criteria) can contribute to greater price volatility in the event of institutional buying or selling. A 2:1 split impacted share price on 8/23/19.
Charts courtesy of www.stockcharts.com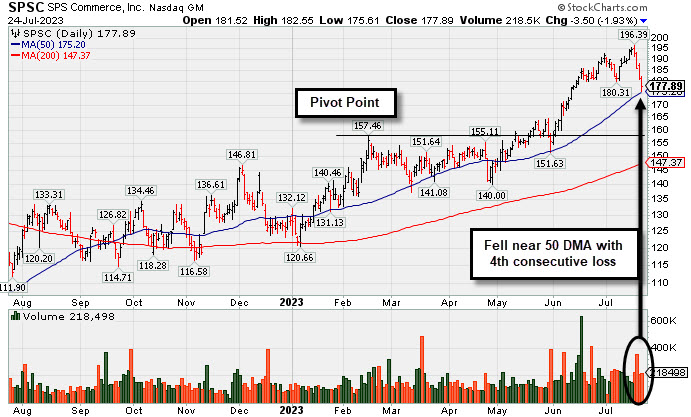
Perched Near High Following Noted Volume-Driven Gains - Wednesday, June 21, 2023
SPS Commerce (SPSC -$0.67 or -0.37% to $182.17) pulled back slightly with lighter volume, stubbornly holding its ground near its 52-week high following an impressive streak of gains. It is extended from the previousl noted base.
Recently it reported Mar '23 quarterly earnings +22% on +20% versus the year-ago period, below the +25% minimum earnings guideline (C criteria) raising some fundamental concerns. Two of the 4 latest quarterly comparisons were above the +25% minimum earnings guideline (C criteria). Annual earnings (A criteria) history has been strong and it still has an Earnings Per Share Rating of 98.
SPSC was highlighted in yellow in the 4/24/23 mid-day report with new pivot point cited based on its 2/15/23 high plus 10 cents. It was last shown in this FSU section in greater detail on 5/31/23 with an annotated graph under the headline, "Pulled Back After Quietly Wedging to New Highs".
SPSC hails from the Computer Software - Spec Enterprise group which is currently ranked 6th on the 197 Industry Groups list (L criteria). The number of top-rated funds owning its shares rose from 562 in Sep '22 to 586 in Mar '23, a reassuring sign concerning the I criteria. Its current Up/Down Volume Ratio of 2.0 is an unbiased indication its shares have been under accumulation over the past 50 days. It has a Timeliness Rating of A and Sponsorship Rating of B. The small supply of 36.5 million shares outstanding (S criteria) can contribute to greater price volatility in the event of institutional buying or selling. A 2:1 split impacted share price on 8/23/19.
Charts courtesy of www.stockcharts.com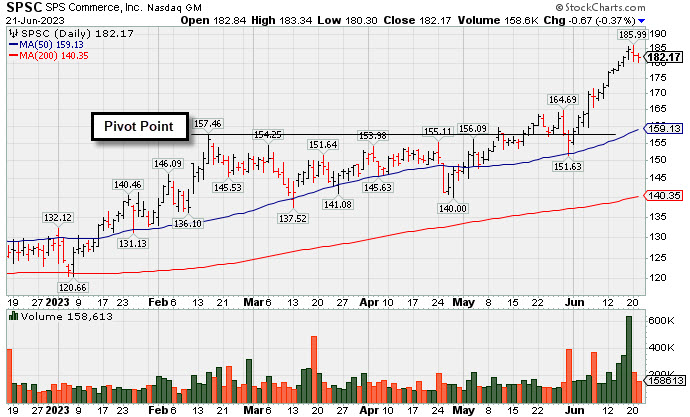
Pulled Back After Quietly Wedging to New Highs - Wednesday, May 31, 2023
SPS Commerce (SPSC -$2.12 or -1.34% to $155.80) pulled back testing its 50-day moving average (DMA) line ($151.96) with today's loss after a "negative reversal" on the prior session when wedging to a new 52-week high. Recent gains above the pivot point were not backed by the +40% above average volume needed to trigger a proper technical buy signal.
Recently it reported Mar '23 quarterly earnings +22% on +20% versus the year-ago period, below the +25% minimum earnings guideline (C criteria) raising some fundamental concerns. Two of the 4 latest quarterly comparisons were above the +25% minimum earnings guideline (C criteria). Annual earnings (A criteria) history has been strong and it has an Earnings Per Share Rating of 98.
SPSC was highlighted in yellow in the 4/24/23 mid-day report with new pivot point cited based on its 2/15/23 high plus 10 cents. It was shown in greater detail that evening with an annotated graph under the headline, "Sputtered While Perched in Striking Distance of 52-Week HIgh". Subsequent gains above the pivot point were not backed by at least +40% above average volume to trigger a proper technical buy signal.
SPSC is -5.4% off its 52-week high. Its current Relative Strength Rating of 90 is above the 80+ minimum guideline for buy candidates. It hails from the Computer Software - Spec Enterprise group which is currently ranked 6th on the 197 Industry Groups list (L criteria).
The number of top-rated funds owning its shares rose from 562 in Sep '22 to 583 in Mar '23, a reassuring sign concerning the I criteria. Its current Up/Down Volume Ratio of 1.4 is an unbiased indication its shares have been under slight accumulation over the past 50 days. It has a Timeliness Rating of A and Sponsorship Rating of B. The small supply of 36.5 million shares outstanding (S criteria) can contribute to greater price volatility in the even of institutional buying or selling. A 2:1 split impacted share price on 8/23/19.
Charts courtesy of www.stockcharts.com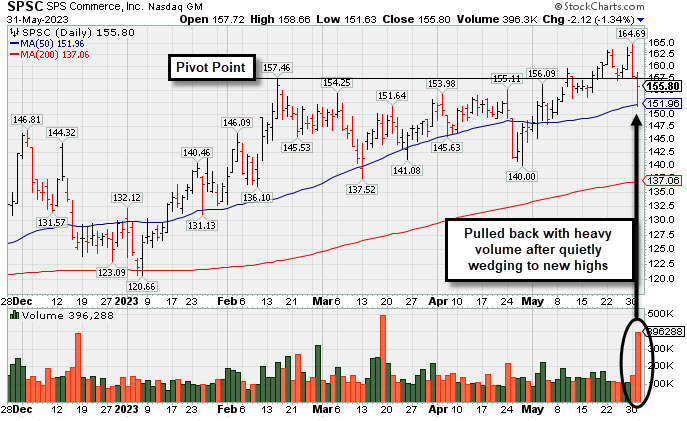
| Symbol/Exchange Company Name Industry Group | PRICE | CHANGE | Day High | Volume (% DAV) (% 50 day avg vol) | 52 Wk Hi | Featured Date | Price Featured | Pivot Featured |
| Max Buy | ||||||||
Graphic Packaging Hldg CONSUMER NON-DURABLES - Packaging and Containers | $23.90 | -0.56 -2.29% | $24.35 | 3,136,534 50 DAV is 2,795,400 | $26.16 -8.64% | 10/25/2022 | $22.75 | PP = $24.17 |
| MB = $25.38 | ||||||||
G - Tested its 4/27/23 low today which defines near term support to watch above its 200 DMA line ($23.14). Volume totals have been below average but it slumped below its 50 DMA line ($25) triggering a technical sell signal during a 7-session losing streak. A rebound above the 50 DMA line is needed for its outlook to improve. Reported Mar '23 quarterly earnings +60% on +9% sales revenues versus the year-ago period. >>> FEATURED STOCK ARTICLE : Packaging Firm Due to Report Earnings News - 5/1/2023 | View all notes | Set NEW NOTE alert | Company Profile | SEC News | Chart | Request a new note | ||||||||
Sterling Infrastructure MATERIALS and; CONSTRUCTION - Heavy Construction | $46.07 | -1.60 -3.36% | $47.89 | 728,687 50 DAV is 228,000 | $48.44 -4.89% | 12/14/2022 | $32.41 | PP = $33.72 |
| MB = $35.41 | ||||||||
G - Retreating from its all-time high with above average volume behind today's loss following 9 consecutive gains. Reported Mar '23 quarterly earnings +0% on +10% sales revenues versus the year-ago period, below the +25% minimum earnings guideline (C criteria) raising fundamental concerns. >>> FEATURED STOCK ARTICLE : 50-Day Moving Average Line Acted as Recent Resistance - 4/28/2023 | View all notes | Set NEW NOTE alert | Company Profile | SEC News | Chart | Request a new note | ||||||||
Comfort Systems USA MATERIALS and CONSTRUCTION - General Contractors | $147.98 | -3.36 -2.22% | $152.89 | 285,462 50 DAV is 277,000 | $156.19 -5.26% | 4/27/2023 | $148.85 | PP = $152.23 |
| MB = $159.84 | ||||||||
| Most Recent Note - 5/30/2023 9:31:21 PM Y - Still perched near its all-time high. No resistance remains due to overhead supply, however, it has made little headway in recent weeks. Subsequent gains and new highs backed by at least +40% above average volume may help reconfirm a technical buy signal. >>> FEATURED STOCK ARTICLE : Churning Action While Recently Hovering Near All-Time High - 5/12/2023 | View all notes | Set NEW NOTE alert | Company Profile | SEC News | Chart | Request a new note | ||||||||
Coca-Cola Femsa ADR FOOD and BEVERAGE - Beverages - Soft Drinks | $82.82 | -1.45 -1.72% | $84.45 | 286,603 50 DAV is 194,000 | $91.23 -9.22% | 3/7/2023 | $76.63 | PP = $77.11 |
| MB = $80.97 | ||||||||
| Most Recent Note - 5/30/2023 9:40:04 PM G - Testing support near its 50 DMA line ($83.94) with higher volume behind today's 6th consecutive loss. More damaging losses would trigger a technical sell signal. Reported Mar '23 quarterly earnings +53% on +24% sales revenues versus the year-ago period. Prior highs in the $79-$77 area define the next support to watch below its 50 DMA line. >>> FEATURED STOCK ARTICLE : Posted Gain Afrer Reporting Strong Mar '23 Quarterly Results - 5/2/2023 | View all notes | Set NEW NOTE alert | Company Profile | SEC News | Chart | Request a new note | ||||||||
Clean Harbors Pollution Control | $140.40 | -3.77 -2.61% | $144.64 | 648,704 50 DAV is 373,000 | $147.76 -4.98% | 3/10/2023 | $136.89 | PP = $136.74 |
| MB = $143.58 | ||||||||
| Most Recent Note - 5/30/2023 9:22:19 PM G - Color code is changed to green while hovering above its "max buy" level near its all-time high without making meaningful progress for the past week. Found support near its 50 DMA line ($140.01). More damaging losses would raise greater concerns. Reported Mar '23 quarterly earnings +64% on +12% sales revenues versus the year-ago period. Fundamentals remain strong. >>> FEATURED STOCK ARTICLE : Showed Resilience Near 50-Day Moving Average Following Sell-Off - 5/10/2023 | View all notes | Set NEW NOTE alert | Company Profile | SEC News | Chart | Request a new note | ||||||||
| Symbol/Exchange Company Name Industry Group | PRICE | CHANGE | Day High | Volume (% DAV) (% 50 day avg vol) | 52 Wk Hi | Featured Date | Price Featured | Pivot Featured |
| Max Buy | ||||||||
SPS Commerce COMPUTER SOFTWARE and SERVICES - Application Software | $155.80 | -2.12 -1.34% | $158.66 | 396,237 50 DAV is 135,000 | $164.69 -5.40% | 4/24/2023 | $150.01 | PP = $157.56 |
| MB = $165.44 | ||||||||
Y - Pulling back testing its 50 DMA line ($151.91) today after a "negative reversal" on the prior session when wedging to a new 52-week high. Recent gains above the pivot point were not backed by the +40% above average volume needed to trigger a proper technical buy signal. Reported Mar '23 quarterly earnings +22% on +20% versus the year-ago period, below the +25% minimum earnings guideline (C criteria) raising some fundamental concerns. >>> FEATURED STOCK ARTICLE : Pulled Back After Quietly Wedging to New Highs - 5/31/2023 | View all notes | Set NEW NOTE alert | Company Profile | SEC News | Chart | Request a new note | ||||||||
Hubbell Electrical-Power/Equipmt | $282.46 | -6.42 -2.22% | $289.49 | 538,205 50 DAV is 398,000 | $291.91 -3.24% | 4/25/2023 | $262.85 | PP = $257.51 |
| MB = $270.39 | ||||||||
G - Pulling back today for a 2nd loss after hitting new all-time highs and getting extended from any sound base. Bullish action came after its strong Mar '23 quarterly results. Prior highs in the $263 area define initial support to watch on pullbacks. >>> FEATURED STOCK ARTICLE : Gap Up Following Earnings Triggered Technical Buy Signal - 4/25/2023 | View all notes | Set NEW NOTE alert | Company Profile | SEC News | Chart | Request a new note | ||||||||
NVR MATERIALS and CONSTRUCTION - Residential Construction | $5,554.22 | -66.99 -1.19% | $5,643.57 | 93,654 50 DAV is 22,000 | $5,986.96 -7.23% | 4/25/2023 | $5,882.18 | PP = $5,978.25 |
| MB = $6,277.16 | ||||||||
| Most Recent Note - 5/30/2023 9:44:46 PM G - Slumped below its 50 DMA line last week raising technical concerns. Reported Mar '23 quarterly earnings -14% on -3% sales revenues versus the year-ago period, below the +25% minimum earnings guideline (C criteria) raising fundamental concerns, and its color code was changed to green. Prior quarterly comparisons were well above the +25% minimum earnings guideline (C criteria). Annual earnings (A criteria) growth has been very strong. >>> FEATURED STOCK ARTICLE : Fell From High and Raised Concern With Subpar Mar '23 Report - 4/27/2023 | View all notes | Set NEW NOTE alert | Company Profile | SEC News | Chart | Request a new note | ||||||||
PulteGroup MATERIALS and CONSTRUCTION - Residential Construction | $66.08 | -0.61 -0.91% | $66.74 | 6,403,059 50 DAV is 2,817,000 | $70.54 -6.32% | 4/25/2023 | $65.17 | PP = $64.01 |
| MB = $67.21 | ||||||||
| Most Recent Note - 5/30/2023 9:46:30 PM Y - Pulled back from its all-time high and below "max buy" level and its color code is changed to yellow. Reported earnings +28% for the Mar '23 quarter versus the year-ago period. Prior highs in the $64-60 area define initial support to watch above its 50 DMA line ($63.03). >>> FEATURED STOCK ARTICLE : Recently Rallying to New All-Time Highs - 4/26/2023 | View all notes | Set NEW NOTE alert | Company Profile | SEC News | Chart | Request a new note | ||||||||
Coca-Cola Consolidated FOOD and BEVERAGE - Beverages - Soft Drinks | $661.74 | -6.08 -0.91% | $670.49 | 57,707 50 DAV is 32,000 | $694.20 -4.68% | 5/4/2023 | $646.66 | PP = $656.21 |
| MB = $689.02 | ||||||||
| Most Recent Note - 5/30/2023 9:24:10 PM Y - Consolidating above the pivot point and below its "max buy" level. Bullish action came after it reported Mar '23 quarterly earnings +93% on +12% sales revenues versus the year-ago period, continuing its strong earnings track record. >>> FEATURED STOCK ARTICLE : COKE is Showing Real Strength - 5/4/2023 | View all notes | Set NEW NOTE alert | Company Profile | SEC News | Chart | Request a new note | ||||||||
| Symbol/Exchange Company Name Industry Group | PRICE | CHANGE | Day High | Volume (% DAV) (% 50 day avg vol) | 52 Wk Hi | Featured Date | Price Featured | Pivot Featured |
| Max Buy | ||||||||
Amphastar Pharm Medical-Biomed/Biotech | $44.37 | +0.03 0.07% | $45.00 | 435,365 50 DAV is 381,000 | $45.50 -2.48% | 5/15/2023 | $43.56 | PP = $44.15 |
| MB = $46.36 | ||||||||
| Most Recent Note - 5/30/2023 9:16:32 PM Y - Volume totals have been cooling while hovering near its all-time high. Subsequent gains and a strong close above the pivot point backed by at least +40% above average volume may clinch a technical buy signal. Three of the 4 latest quarterly comparisons through Mar '23 versus the year-ago periods have been strong and well above the +25% minimum earnings guideline (C criteria). Annual earnings history (A criteria) has been strong. >>> FEATURED STOCK ARTICLE : Weak Finish After Early Gain When Perched Near All-Time High - 5/15/2023 | View all notes | Set NEW NOTE alert | Company Profile | SEC News | Chart | Request a new note | ||||||||
Arista Networks Computer-Networking | $166.34 | -8.08 -4.63% | $170.60 | 6,173,812 50 DAV is 3,162,000 | $178.36 -6.74% | 5/30/2023 | $176.35 | PP = $171.54 |
| MB = $180.12 | ||||||||
Y - Pulling back today following 4 consecutive volume-driven gains hitting a new high triggering a technical buy signal. Color code was changed to yellow with new pivot point cited based on its 3/23/23 high plus 10 cents in the 5/30/23 mid-day report. Reported Mar '23 quarterly earnings +70% on +54% sales revenues versus the year-ago period and fundamentals remain strong. Found support at its 200 DMA line in recent weeks since dropped from the Featured Stocks list on 5/03/23. >>> FEATURED STOCK ARTICLE : Technical Sell Signal Triggered by Damaging Volume-Driven Loss - 5/3/2023 | View all notes | Set NEW NOTE alert | Company Profile | SEC News | Chart | Request a new note | ||||||||
Sputtered While Perched in Striking Distance of 52-Week HIgh - Monday, April 24, 2023
SPS Commerce (SPSC -$1.24 or -0.82% to $150.88) was highlighted in yellow with new pivot point cited based on its 2/15/23 high plus 10 cents. Subsequent gains above the pivot point backed by at least +40% above average volume may trigger a technical buy signal. It has been consolidating above its 50-day moving average (DMA) line ($148.72) in an orderly fashion in recent weeks.
SPSC reported Dec '22 quarterly earnings +37% on +19% sales revenues versus the year-ago period. Three of the 4 latest quarterly comparisons were above the +25% minimum earnings guideline (C criteria). Annual earnings (A criteria) history has been strong and it has an Earnings Per Share Rating of 98.
SPSC reported Dec '22 quarterly earnings +37% on +19% sales revenues versus the year-ago period. Three of the 4 latest quarterly comparisons were above the +25% minimum earnings guideline (C criteria). Annual earnings (A criteria) history has been strong and it has an Earnings Per Share Rating of 98.
SPSC is -4.2% off its 52-week high and -13.5% off its all-time high. Its current Relative Strength Rating of 90 is above the 80+ minimum guideline for buy candidates. It hails from the Computer Software - Spec Enterprise group which is currently ranked 31st on the 197 Industry Groups list (L criteria).
The number of top-rated funds owning its shares rose from 562 in Sep '22 to 598 in Mar '23, a reassuring sign concerning the I criteria. Its current Up/Down Volume Ratio of 1.1 is an unbiased indication its shares have been under slight accumulation over the past 50 days. It has a Timeliness Rating of A and Sponsorship Rating of B. The small supply of 36.3 million shares outstanding (S criteria) can contribute to greater price volatility in the even of institutional buying or selling. A 2:1 split impacted share price on 8/23/19.
Charts courtesy of www.stockcharts.com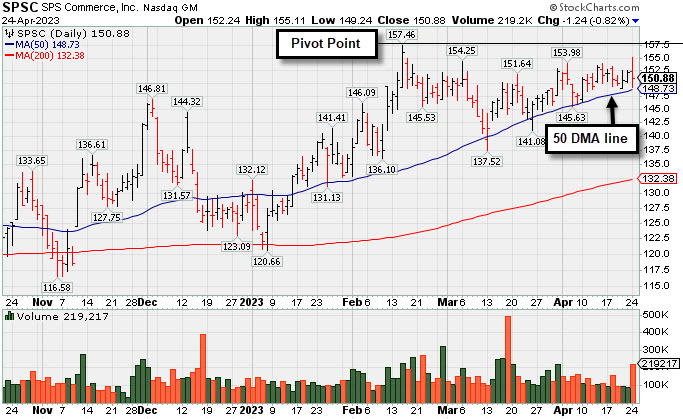
4 Damaging Losses Followed Recent Technical Breakout - Monday, February 24, 2020
S P S Commerce Inc (SPSC -$0.96 or -1.71% to $55.29) pulled back for a 4th consecutive loss today following 4 consecutive gains for new all-time highs. It stalled soon after volume-driven gains above its pivot point had triggered a new technical buy signal. Losses violating its 50-day moving average triggered a technical sell signal, and a rebound above that important short-term average ($57.34) is needed for its outlook to improve.
SPSC is 11.2% off its all-time high. Its current Relative Strength Rating of 54 is below the 80+ minimum guideline for buy candidates. The high-ranked Computer Software firm was highlighted in yellow with new pivot point cited based on its 7/26/19 high plus 10 cents in the 11/29/19 mid-day report (read here). It was last shown in this FSU section on 2/03/20 with an annotated graph under the headline, "Perched Near High Finding Support at 50-Day Average".
A 2:1 split impacted share price on 8/23/19. Fundamentals remain strong. Reported earnings +30% on +12% sales revenues for the Dec '19 quarter versus the year ago period, and 3 of the past 4 quarterly comparisons were above the +25% minimum earnings guideline (C criteria). A small downturn in FY '16 earnings was previously noted as a flaw in its annual earnings (A criteria) history.
The number of top-rated funds owning its shares rose from 238 in Mar '18 to 490 in Dec '19, a reassuring sign concerning the I criteria. Its current Up/Down Volume Ratio of 1.4 is an unbiased indication its shares have been under accumulation over the past 50 days. It has a Timeliness Rating of Band Sponsorship Rating of D. The small supply of 34.8 million shares outstanding (S criteria) can contribute to greater price volatility in the even of institutional buying or selling.
Charts courtesy of www.stockcharts.com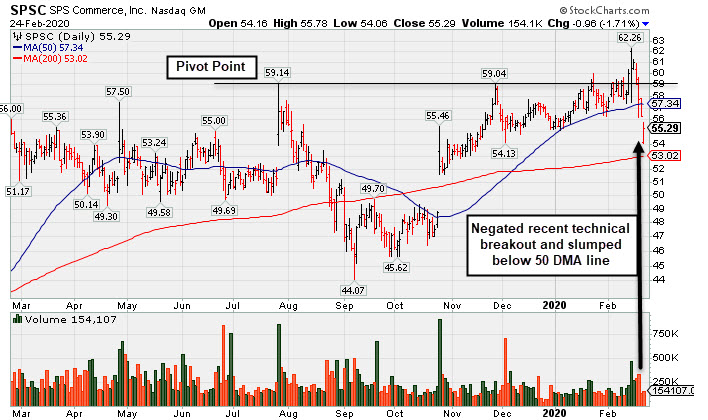
Perched Near High Finding Support at 50-Day Average - Monday, February 3, 2020
S P S Commerce Inc (SPSC +$0.74 or +1.30% to $57.57) posted a solid gain today after finding support near its 50-day moving average (DMA) line ($56.71). It remains perched near its all-time high. Subsequent gains above its pivot point backed by at least +40% above average volume are needed to trigger a new technical buy signal. Fundamentals remain strong. Its current Relative Strength Rating of 77 is below the 80+ minimum guideline for buy candidates.
SPSC is perched only -4% off its all-time high. The high-ranked Computer Software firm was highlighted in yellow with new pivot point cited based on its 7/26/19 high plus 10 cents in the 11/29/19 mid-day report (read here). It was last shown in this FSU section on 1/13/20 with an annotated graph under the headline, "Still Lingering Below Prior Resistance".
A 2:1 split impacted share price on 8/23/19 when it was dropped from the Featured Stocks list. It reported earnings +27% on +13% sales revenues for the Sep '19 quarter, and 3 of the past 4 quarterly comparisons were above the +25% minimum earnings guideline (C criteria). A small downturn in FY '16 earnings was previously noted as a flaw in its annual earnings (A criteria) history.
The number of top-rated funds owning its shares rose from 238 in Mar '18 to 484 in Dec '19, a reassuring sign concerning the I criteria. Its current Up/Down Volume Ratio of 1.1 is an unbiased indication its shares have been slight under accumulation over the past 50 days. It has a Timeliness Rating of A and Sponsorship Rating of D. The small supply of 34.8 million shares outstanding (S criteria) can contribute to greater price volatility in the even of institutional buying or selling.
Charts courtesy of www.stockcharts.com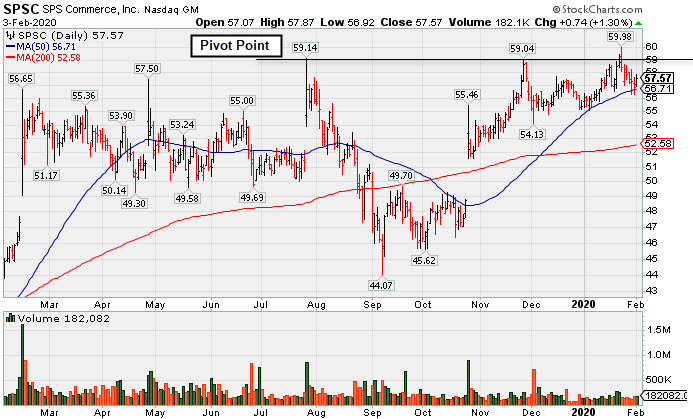
Still Lingering Below Prior Resistance - Monday, January 13, 2020
S P S Commerce Inc (SPSC +$0.68 or +1.20% to $57.36) is perched only -3% off its all-time high. Subsequent gains above its pivot point backed by at least +40% above average volume are needed to trigger a new technical buy signal. Fundamentals remain strong, however, its Relative Strength Rating of 81 is just above the 80+ minimum guideline for buy candidates.
The high-ranked Computer Software firm was highlighted in yellow with new pivot point cited based on its 7/26/19 high plus 10 cents in the 11/29/19 mid-day report (read here). It was last shown in this FSU section on 12/20/19 with an annotated graph under the headline, "Perched Within Close Striking Distance of 52-Week High".
A 2:1 split impacted share price on 8/23/19 when it was dropped from the Featured Stocks list. It reported earnings +27% on +13% sales revenues for the Sep '19 quarter, and 3 of the past 4 quarterly comparisons were above the +25% minimum earnings guideline (C criteria). A small downturn in FY '16 earnings was previously noted as a flaw in its annual earnings (A criteria) history.
The number of top-rated funds owning its shares rose from 238 in Mar '18 to 483 in Sep '19, a reassuring sign concerning the I criteria. Its current Up/Down Volume Ratio of 1.2 is an unbiased indication its shares have been under accumulation over the past 50 days. It has a Timeliness Rating of B and Sponsorship Rating of D. The small supply of 34.8 million shares outstanding (S criteria) can contribute to greater price volatility in the even of institutional buying or selling.
Charts courtesy of www.stockcharts.com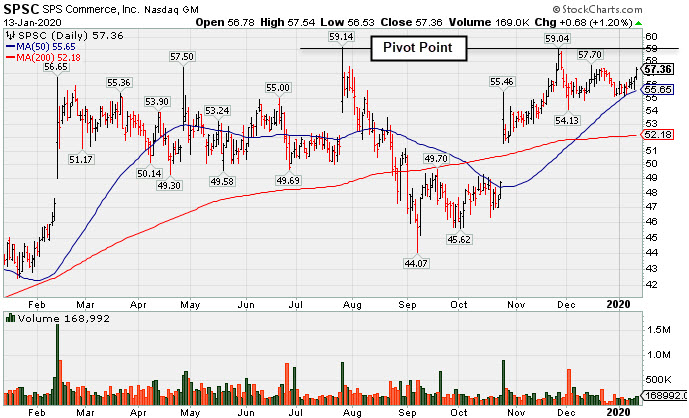
Perched Within Close Striking Distance of 52-Week High - Friday, December 20, 2019
S P S Commerce Inc (SPSC -$0.05 or -0.09% to $57.17) paused today after 6 consecutive gains and remains perched near its all-time high. Subsequent gains above its pivot point backed by at least +40% above average volume are needed to trigger a new technical buy signal. Fundamentals remain strong.
The high-ranked Computer Software firm was highlighted in yellow with new pivot point cited based on its 7/26/19 high plus 10 cents in the 11/29/19 mid-day report (read here) and covered in greater detail that evening under the headline, "Rebound Leaves Supply Chain Management Software Firm Near High".
A 2:1 split impacted share price on 8/23/19 when it was dropped from the Featured Stocks list. It reported earnings +27% on +13% sales revenues for the Sep '19 quarter, and 3 of the past 4 quarterly comparisons were above the +25% minimum earnings guideline (C criteria). A small downturn in FY '16 earnings was previously noted as a flaw in its annual earnings (A criteria) history.
The number of top-rated funds owning its shares rose from 238 in Mar '18 to 480 in Sep '19, a reassuring sign concerning the I criteria. Its current Up/Down Volume Ratio of 1.6 is an unbiased indication its shares have been under accumulation over the past 50 days. It has a Timeliness Rating of B and Sponsorship Rating of D. The small supply of 34.8 million shares outstanding (S criteria) can contribute to greater price volatility in the even of institutional buying or selling.
Charts courtesy of www.stockcharts.com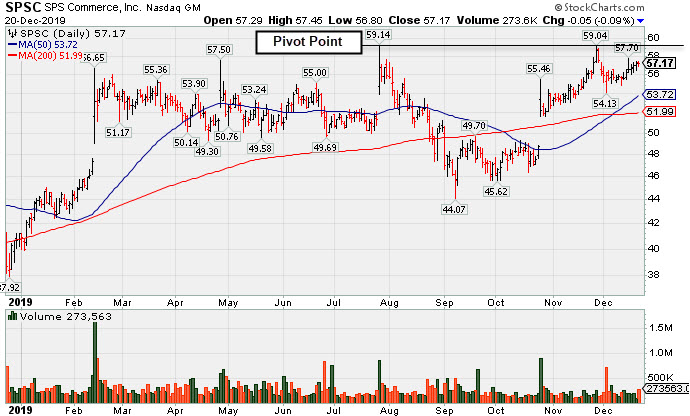
Rebound Leaves Supply Chain Management Software Firm Near High - Friday, November 29, 2019
S P S Commerce Inc (SPSC -$1.21 or -2.10% to $56.33) was highlighted in yellow with new pivot point cited based on its 7/26/19 high plus 10 cents in the earlier mid-day report (read here). It is consolidating near its all-time high. Subsequent gains above its pivot point backed by at least +40% above average volume are needed to trigger a new technical buy signal.
A 2:1 split impacted share price on 8/23/19 when it was dropped from the Featured Stocks list. It reported earnings +27% on +13% sales revenues for the Sep '19 quarter, and 3 of the past 4 quarterly comparisons were above the +25% minimum earnings guideline (C criteria). A small downturn in FY '16 earnings was previously noted as a flaw in its annual earnings (A criteria) history.
SPSC went through a choppy consolidation and rebounded impressively since last shown in this FSU section on 8/08/19 with an annotated graph under the headline, "Found Support at 50-Day Average". The high-ranked Computer Software firm's current Up/Down Volume Ratio of 1.6 is an unbiased indication its shares have been under accumulation over the past 50 days.
It completed new Public Offerings on 11/20/13 and 9/06/12. The number of top-rated funds owning its shares rose from 238 in Mar '18 to 483 in Sep '19, a reassuring sign concerning the I criteria. It has a Timeliness Rating of B and Sponsorship Rating of D. The small supply of 34.8 million shares outstanding (S criteria) can contribute to greater price volatility in the even of institutional buying or selling.
Charts courtes 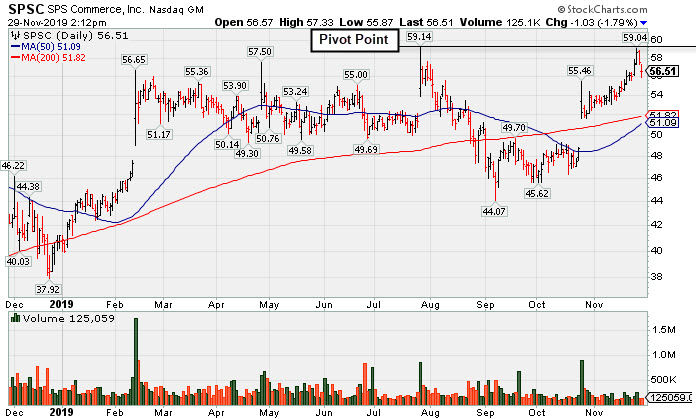
Found Support at 50-Day Average - Thursday, August 8, 2019
S P S Commerce Inc (SPSC +$2.50 or +2.33% to $109.84) found support at its 50-day moving average (DMA) line ($105.19). It stalled after a gap up and big volume-driven gain noted on 7/26/19. Subsequent gains and a strong close above the pivot point may help clinch a convincing new (or add-on) technical buy signal. However, it reported earnings +22% on +12% sales revenues for the Jun '19 quarter, slightly under the +25% minimum earnings guideline (C criteria), raising fundamental concerns. A small downturn in FY '16 earnings was previously noted as a flaw in its annual earnings (A criteria) history.
It was last shown in this FSU section on 7/09/19 with an annotated graph under the headline, "Recently Sputtering Below 50-Day Moving Average". The high-ranked Computer Software firm's current Up/Down Volume Ratio of 0.9 is an unbiased indication its shares have been under slight distributional pressure over the past 50 days.
It completed new Public Offerings on 11/20/13 and 9/06/12. The number of top-rated funds owning its shares rose from 238 in Mar '18 to 464 in Jun '19, a reassuring sign concerning the I criteria. It has a Timeliness Rating of B and Sponsorship Rating of C. The small supply of 17.4 million shares outstanding (S criteria) can contribute to greater price volatility in the even of institutional buying or selling.
Charts courtesy of www.stockcharts.com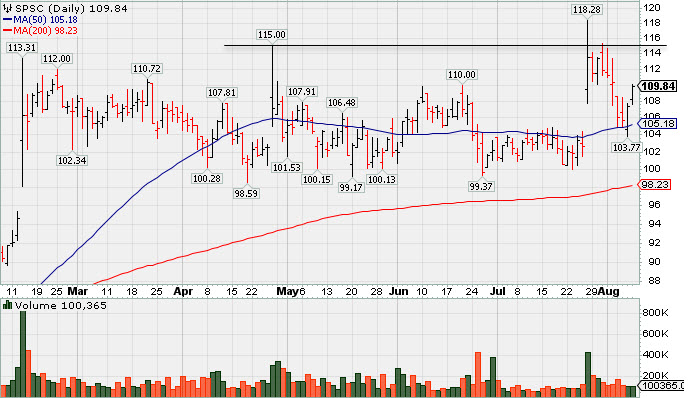
Recently Sputtering Below 50-Day Moving Average - Tuesday, July 9, 2019
S P S Commerce Inc (SPSC +$1.55 or +1.53% to $103.14) is still sputtering below its 50-day moving average (DMA) line ($104.26). Recent lows in the $98-99 area define important near-term support to watch above its 200 DMA line (the red line). A rebound above the 50 DMA line (blue line) and subsequent volume-driven gains above the pivot point are needed to trigger a new (or add-on) technical buy signal. It faces some resistance due to overhead supply up to the $115 level.
Fundamentals remain strong. It reported earnings +54% on +13% sales revenues for the quarter ended March 31, 2019 versus the year ago period, its 6th quarterly earnings comparison above the +25% minimum guideline (C criteria). A small downturn in FY '16 earnings was previously noted as a flaw in its annual earnings (A criteria) history.
It has formed a big base-on-base pattern. It was last shown in this FSU section on 6/07/19 with an annotated graph under the headline, "Base Building Now Above 50-Day Moving Average Line" The high-ranked Computer Software firm's current Up/Down Volume Ratio of 1.3 is an unbiased indication its shares have been under slight accumulation over the past 50 days.
It completed new Public Offerings on 11/20/13 and 9/06/12. The number of top-rated funds owning its shares rose from 238 in Mar '18 to 438 in Mar '19, a reassuring sign concerning the I criteria. It has a Timeliness Rating of A and Sponsorship Rating of B. The small supply of 17.9 million shares outstanding (S criteria) can contribute to greater price volatility in the even of institutional buying or selling.
Charts courtesy of www.stockcharts.com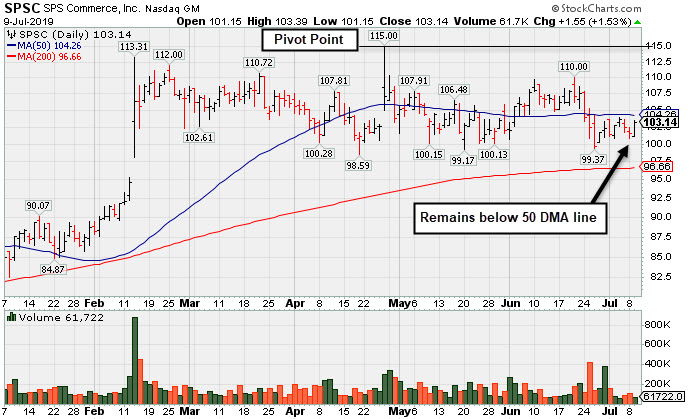
Base Building Now Above 50-Day Moving Average Line - Friday, June 7, 2019
S P S Commerce Inc (SPSC +$2.07 or +1.96% to $107.72) rebounded further above its 50-day moving average (DMA) line ($104.03) with today's gain on light volume. Recent volume-driven gains above the 50 DMA line helped its technical stance improve. A new pivot point is cited based on its 4/26/19 high plus 10 cents.
It faces some resistance due to overhead supply up to the $115 level. Subsequent gains above the pivot point backed by at least +40% above average volume may trigger a new (or add-on) technical buy signal. Recent lows in the $98-99 area define important near-term support to watch.
Fundamentals remain strong. It reported earnings +54% on +13% sales revenues for the quarter ended March 31, 2019 versus the year ago period, its 6th quarterly earnings comparison above the +25% minimum guideline (C criteria). A small downturn in FY '16 earnings was previously noted as a flaw in its annual earnings (A criteria) history.
It has formed a big base-on-base pattern. It was last shown in this FSU section on 5/01/19 with an annotated graph under the headline, "Sputtering Near 50-Day Average Line Building Base-On-Base" The high-ranked Computer Software firm's current Up/Down Volume Ratio of 1.1 is an unbiased indication its shares have been under slight accumulation over the past 50 days.
It completed new Public Offerings on 11/20/13 and 9/06/12. The number of top-rated funds owning its shares rose from 238 in Mar '18 to 440 in Mar '19, a reassuring sign concerning the I criteria. It has a Timeliness Rating of A and Sponsorship Rating of B. The small supply of 17.9 million shares outstanding (S criteria) can contribute to greater price volatility in the even of institutional buying or selling.
Charts courtesy of www.stockcharts.com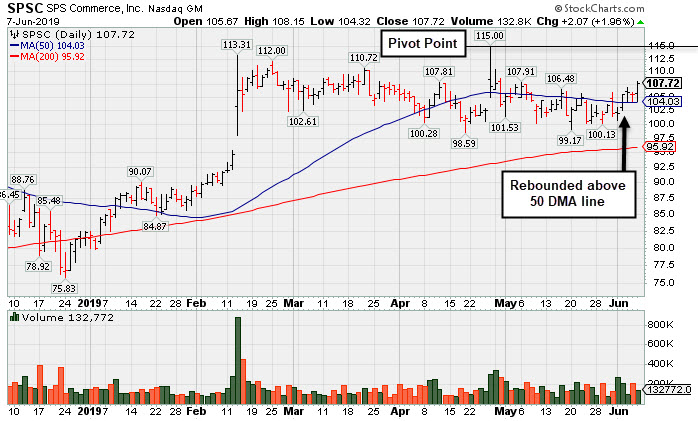
Sputtering Near 50-Day Average Line Building Base-On-Base - Wednesday, May 1, 2019
S P S Commerce Inc (SPSC +$1.35 or +1.30% to $105.09) posted a 3rd volume-driven gain in the span of 4 sessions but it still remains below its 50-day moving average (DMA) line ($105.75). It gapped up on 4/26/19 but encountered distributional pressure and ended in the lower part of its intra-day range after hitting new 52-week and all-time highs. Weak action negated the bullish action that came after it reported earnings +54% on +13% sales revenues for the quarter ended March 31, 2019 versus the year ago period.
Prior highs in the $98-100 area define important near-term support. Its current Up/Down Volume Ratio of 0.9 is an unbiased indication its shares have been under slight distributional pressure over the past 50 days.
It has formed a big base-on-base pattern since highlighted in yellow with pivot point cited based on its 9/14/18 high plus 10 cents in the 2/13/19 mid-day report (read here). It was last shown in this FSU section on 3/22/19 with an annotated graph under the headline, "Consolidating in Orderly Fashion Above Prior Highs"
The high-ranked Computer Software firm reported earnings +89% on +12% sales revenues for the quarter ended December 31, 2018. The past 5 quarterly earnings comparisons were above the +25% minimum guideline (C criteria). Small downturn in FY '16 earnings was previously noted as a flaw in its annual earnings (A criteria) history.
It completed new Public Offerings on 11/20/13 and 9/06/12. The number of top-rated funds owning its shares rose from 238 in Mar '18 to 427 in Mar '19, a reassuring sign concerning the I criteria. It has a Timeliness Rating of A and Sponsorship Rating of B. The small supply of 17.5 million shares outstanding (S criteria) can contribute to greater price volatility in the even of institutional buying or selling.
Charts courtesy of www.stockcharts.com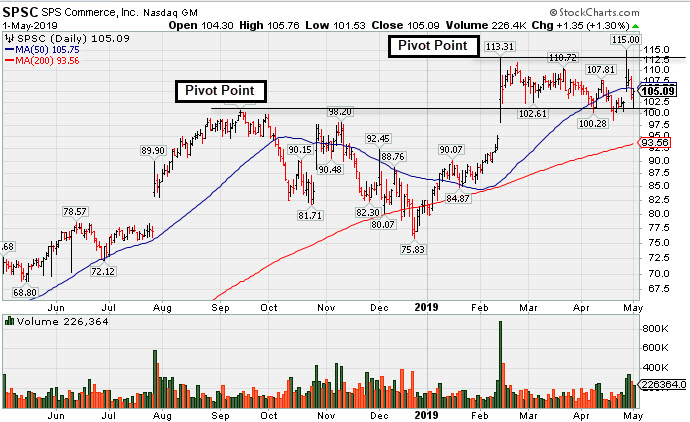
Consolidating in Orderly Fashion Above Prior Highs - Friday, March 22, 2019
S P S Commerce Inc (SPSC -$4.88 or -4.43% to $105.40) is consolidating in an orderly fashion in recent weeks. Prior highs in the $100 area define initial support to watch. Its current Up/Down Volume Ratio of 1.7 is an unbiased indication its shares have been under accumulation over the past 50 days.
It was highlighted in yellow with pivot point cited based on its 9/14/18 high plus 10 cents in the 2/13/19 mid-day report (read here). It hit new 52-week and all-time highs with a gap up and big gain backed by +430% above average volume triggering a technical buy signal. It was in this FSU section with an annotated graph under the headline, "Gap Up and Big Volume Driven Gain for New High".
The high-ranked Computer Software firm reported earnings +89% on +12% sales revenues for the quarter ended December 31, 2018. The past 5 quarterly earnings comparisons were above the +25% minimum guideline (C criteria). Small downturn in FY '16 earnings was previously noted as a flaw in its annual earnings (A criteria) history.
It completed new Public Offerings on 11/20/13 and 9/06/12. The number of top-rated funds owning its shares rose from 238 in Mar '18 to 414 in Dec '18, a reassuring sign concerning the I criteria. It has a Timeliness Rating of A and Sponsorship Rating of B. The small supply of 17.8 million shares outstanding (S criteria) can contribute to greater price volatility in the even of institutional buying or selling.
Charts courtesy of www.stockcharts.com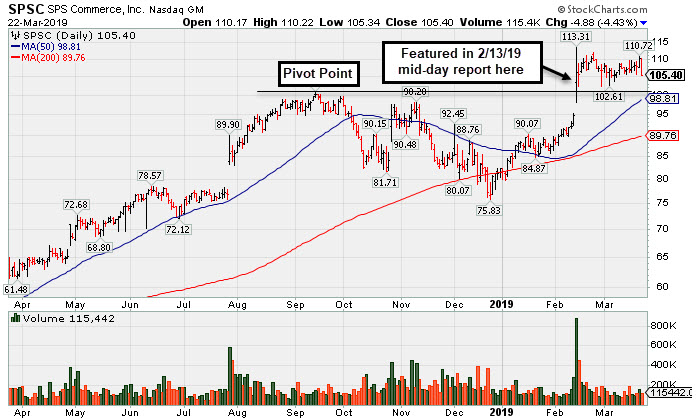
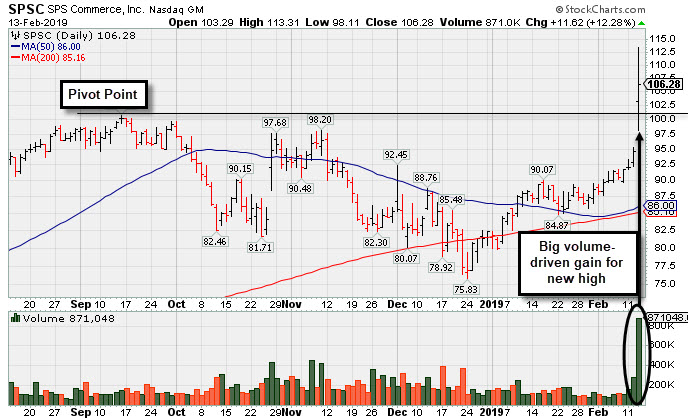
Gap Up and Big Volume Driven Gain for New High - Wednesday, February 13, 2019
S P S Commerce Inc (SPSC $106.28 +$11.62 or +12.28%) finished in the upper half of its intra-day range after highlighted in yellow with pivot point cited based on its 9/14/18 high plus 10 cents in he earlier mid-day report (read here). It hit new 52-week and all-time highs with today's gap up and big gain backed by +430% above average volume triggering a technical buy signal.
The high-ranked Computer Software firm reported earnings +89% on +12% sales revenues for the quarter ended December 31, 2018. The past 5 quarterly earnings comparisons were above the +25% minimum guideline (C criteria). Small downturn in FY '16 earnings was previously noted as a flaw in its annual earnings (A criteria) history.
It completed new Public Offerings on 11/20/13 and 9/06/12. The number of top-rated funds owning its shares rose from 238 in Mar '18 to 403 in Dec '18, a reassuring sign concerning the I criteria. It has a Timeliness Rating of A and Sponsorship Rating of B. The small supply of 17.7 million shares outstanding (S criteria) can contribute to greater price volatility in the even of institutional buying or selling.
Charts courtesy of www.stockcharts.com