***Last / Change / Volume data in this table is the closing quote data***
Symbol/Exchange
Company Name
Industry Group |
PRICE |
CHANGE
(%Change) |
Day High |
Volume
(% DAV)
(% 50 day avg vol) |
52 Wk Hi
% From Hi |
Featured
Date |
Price
Featured |
Pivot Featured |
|
Max Buy |
OSBC
-
NASDAQ
Old Second Bancorp Inc
BANKING - Regional - Midwest Banks
|
$15.01
|
-0.13
-0.86% |
$15.24
|
81,740
86.04% of 50 DAV
50 DAV is 95,000
|
$16.30
-7.91%
|
9/24/2018
|
$15.38
|
PP = $16.40
|
|
MB = $17.22
|
 Most Recent Note - 10/10/2018 1:33:01 PM
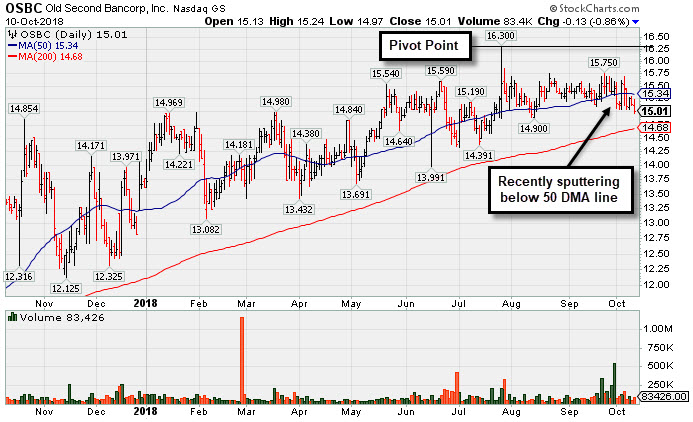
G - Color code is changed to green while sputtering below its 50 DMA line ($15.34). Prior lows and its 200 DMA line define additional near-term support. Its Relative Strength Rating is 74, below the 80+ minimum guideline for buy candidates. Met stubborn resistance after hitting a new high on 7/26/18 with a big volume-driven gain. Fundamentals remain strong.
>>> FEATURED STOCK ARTICLE : Bank Recently Sputtering Below its 50-Day Moving Average - 10/10/2018 |
View all notes |
Set NEW NOTE alert |
Company Profile |
SEC
News |
Chart |
Request a new note
C
A
S
I |
SIVB
-
NASDAQ
S V B Financial Group
BANKING - Regional - Pacific Banks
|
$301.14
|
-14.91
-4.72% |
$317.29
|
755,215
199.27% of 50 DAV
50 DAV is 379,000
|
$333.74
-9.77%
|
8/6/2018
|
$314.77
|
PP = $329.75
|
|
MB = $346.24
|
Most Recent Note - 10/10/2018 6:03:27 PM
G - Suffered a big volume-driven loss today and ended near the session low. A rebound above the 50 DMA line ($320) is needed for its outlook to improve.
>>> FEATURED STOCK ARTICLE : Bank Posted Quiet Gain for a Best-Ever Close - 8/27/2018 |
View all notes |
Set NEW NOTE alert |
Company Profile |
SEC
News |
Chart |
Request a new note
C
A
S
I |
GMED
-
NYSE
Globus Medical Inc Cl A
CHEMICALS - Specialty Chemicals
|
$50.68
|
-0.19
-0.37% |
$51.46
|
950,692
155.09% of 50 DAV
50 DAV is 613,000
|
$57.55
-11.94%
|
9/26/2018
|
$56.11
|
PP = $57.65
|
|
MB = $60.53
|
Most Recent Note - 10/9/2018 5:13:38 PM
G - Color code is changed to green after a slump. Halted its slide at its 200 DMA line, however a rebound above the 50 DMA line is needed for its outlook to improve. Subsequent gains above the pivot point backed by more than +40% above average volume are needed to trigger a proper technical buy signal.
>>> FEATURED STOCK ARTICLE : Rallying Near Pivot Point With Volume-Driven Gains - 9/26/2018 |
View all notes |
Set NEW NOTE alert |
Company Profile |
SEC
News |
Chart |
Request a new note
C
A
S
I |
ZBRA
-
NASDAQ
Zebra Tech Corp Cl A
COMPUTER HARDWARE - Computer Peripherals
|
$149.58
|
-7.80
-4.96% |
$157.76
|
761,893
199.97% of 50 DAV
50 DAV is 381,000
|
$179.47
-16.65%
|
8/7/2018
|
$164.26
|
PP = $161.82
|
|
MB = $169.91
|
Most Recent Note - 10/10/2018 12:28:51 PM
G - With today's 5th consecutive loss it is slumping further below its 50 DMA line ($166) and prior high ($161) after noted losses triggered technical sell signals. Only a prompt rebound above the 50 DMA line would help its outlook improve.
>>> FEATURED STOCK ARTICLE : Hovering Near All-Time High With Strong Fundamentals - 9/24/2018 |
View all notes |
Set NEW NOTE alert |
Company Profile |
SEC
News |
Chart |
Request a new note
C
A
S
I |
EPAM
-
NYSE
Epam Systems Inc
COMPUTER SOFTWARE and SERVICES - Information Technology Service
|
$122.12
|
-6.82
-5.29% |
$128.93
|
386,087
93.71% of 50 DAV
50 DAV is 412,000
|
$144.19
-15.31%
|
7/5/2018
|
$123.70
|
PP = $131.85
|
|
MB = $138.44
|
Most Recent Note - 10/10/2018 5:55:05 PM
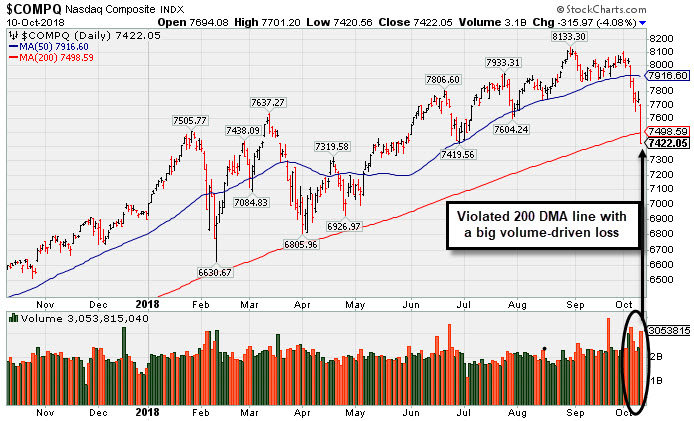
Violated its 200 DMA line with today's big loss on higher (near average) volume. Faces resistance due to overhead supply up through the $144 level. It will be dropped from the Featured Stocks list tonight.
>>> FEATURED STOCK ARTICLE : Slump Below 50-Day Moving Average Raised Concerns - 10/5/2018 |
View all notes |
Set NEW NOTE alert |
Company Profile |
SEC
News |
Chart |
Request a new note
C
A
S
I |
Symbol/Exchange
Company Name
Industry Group |
PRICE |
CHANGE
(%Change) |
Day High |
Volume
(% DAV)
(% 50 day avg vol) |
52 Wk Hi
% From Hi |
Featured
Date |
Price
Featured |
Pivot Featured |
|
Max Buy |
IRBT
-
NASDAQ
Irobot Corp
CONSUMER DURABLES - Electronic Equipment
|
$88.81
|
-6.18
-6.51% |
$95.00
|
880,812
107.81% of 50 DAV
50 DAV is 817,000
|
$118.75
-25.21%
|
8/29/2018
|
$112.07
|
PP = $109.88
|
|
MB = $115.37
|
Most Recent Note - 10/10/2018 5:22:54 PM
Slumped further below its 50 DMA line and prior low ($99.73 on 9/07/18) today after recently noted technical sell signals. A rebound above the 50 DMA line ($101) is needed for its outlook to improve. It will be dropped from the Featured Stocks list tonight.
>>> FEATURED STOCK ARTICLE : Household Appliance Maker Rallied From Choppy Base - 8/29/2018 |
View all notes |
Set NEW NOTE alert |
Company Profile |
SEC
News |
Chart |
Request a new note
C
A
S
I |
TSC
-
NASDAQ
TriState Capital Hld Inc
CONSUMER NON-DURABLES - Personal Products
|
$27.76
|
-0.23
-0.82% |
$28.11
|
370,470
188.06% of 50 DAV
50 DAV is 197,000
|
$30.10
-7.77%
|
9/11/2018
|
$29.75
|
PP = $30.20
|
|
MB = $31.71
|
Most Recent Note - 10/10/2018 1:31:32 PM
G - A rebound above the 50 DMA line ($28.87) still is needed for its outlook to improve. Found support near prior highs in the $27 area. Faces near-term resistance due to overhead supply up to the $30 level.
>>> FEATURED STOCK ARTICLE : TriState Bank Perched Near All-Time High - 9/11/2018 |
View all notes |
Set NEW NOTE alert |
Company Profile |
SEC
News |
Chart |
Request a new note
C
A
S
I |
CME
-
NASDAQ
C M E Group Inc
DIVERSIFIED SERVICES - Business/Management Services
|
$180.25
|
-0.91
-0.50% |
$182.48
|
2,399,015
183.97% of 50 DAV
50 DAV is 1,304,000
|
$182.97
-1.49%
|
10/4/2018
|
$179.29
|
PP = $177.45
|
|
MB = $186.32
|
Most Recent Note - 10/10/2018 5:53:05 PM
Y - Stubbornly holding its ground despite broad market weakness (M criteria). Prior highs in the $177 area define initial support to watch on pullbacks.
>>> FEATURED STOCK ARTICLE : CME Group Blasted to New Record High - 10/4/2018 |
View all notes |
Set NEW NOTE alert |
Company Profile |
SEC
News |
Chart |
Request a new note
C
A
S
I |
FLT
-
NYSE
Fleetcor Technologies
DIVERSIFIED SERVICES - Business/Management Services
|
$205.28
|
-9.88
-4.59% |
$215.16
|
745,106
143.84% of 50 DAV
50 DAV is 518,000
|
$230.24
-10.84%
|
9/12/2018
|
$221.01
|
PP = $226.02
|
|
MB = $237.32
|
Most Recent Note - 10/9/2018 5:10:08 PM
G - Sputtering below its 50 DMA line ($218) after 4 consecutive losses and its color code is changed to green. A rebound above the 50 DMA line is needed for its outlook to improve. Subsequent volume-driven gains above the pivot point are needed to trigger a new (or add-on) technical buy signal.
>>> FEATURED STOCK ARTICLE : Perched Within Close Striking Distance of New Pivot Point - 9/20/2018 |
View all notes |
Set NEW NOTE alert |
Company Profile |
SEC
News |
Chart |
Request a new note
C
A
S
I |
MA
-
NYSE
Mastercard Inc Cl A
Finance-CrdtCard/PmtPr
|
$196.69
|
-13.07
-6.23% |
$209.33
|
7,606,507
242.86% of 50 DAV
50 DAV is 3,132,000
|
$225.35
-12.72%
|
7/11/2018
|
$203.84
|
PP = $204.10
|
|
MB = $214.31
|
Most Recent Note - 10/10/2018 12:08:46 PM
G - Slumping further today raising concerns after volume-driven losses triggered technical sell signals. Only a prompt rebound above the 50 DMA line ($211) would help its outlook improve.
>>> FEATURED STOCK ARTICLE : Hovering Near High, Extended From Any Sound Base - 9/27/2018 |
View all notes |
Set NEW NOTE alert |
Company Profile |
SEC
News |
Chart |
Request a new note
C
A
S
I |
Symbol/Exchange
Company Name
Industry Group |
PRICE |
CHANGE
(%Change) |
Day High |
Volume
(% DAV)
(% 50 day avg vol) |
52 Wk Hi
% From Hi |
Featured
Date |
Price
Featured |
Pivot Featured |
|
Max Buy |
V
-
NYSE
Visa Inc Cl A
Finance-CrdtCard/PmtPr
|
$135.52
|
-6.79
-4.77% |
$142.69
|
15,094,443
208.29% of 50 DAV
50 DAV is 7,247,000
|
$151.56
-10.58%
|
4/26/2018
|
$126.68
|
PP = $126.98
|
|
MB = $133.33
|
Most Recent Note - 10/10/2018 12:21:39 PM
G - Slumping even further below its 50 DMA line ($144) and recent low ($142.55 on 9/05/18) with today's big loss after recently noted technical sell signals. Only a rebound above the 50 DMA line would help its outlook improve.
>>> FEATURED STOCK ARTICLE : Visa Near Record but Endured Distributional Pressure - 9/13/2018 |
View all notes |
Set NEW NOTE alert |
Company Profile |
SEC
News |
Chart |
Request a new note
C
A
S
I |
ENV
-
NYSE
Envestnet Inc
FINANCIAL SERVICES - Diversified Investments
|
$58.09
|
-1.60
-2.68% |
$59.72
|
380,567
154.70% of 50 DAV
50 DAV is 246,000
|
$64.80
-10.35%
|
6/15/2018
|
$57.85
|
PP = $60.37
|
|
MB = $63.39
|
Most Recent Note - 10/8/2018 6:47:11 PM
G - Sputtering below its 50 DMA line ($61.15) again. A rebound is needed for its outlook to improve. Its Relative Strength Rating is 79, below the 80+ minimum guideline for buy candidates. Fundamentals remain strong.
>>> FEATURED STOCK ARTICLE : Found Recent Support at 50-Day Moving Average - 9/21/2018 |
View all notes |
Set NEW NOTE alert |
Company Profile |
SEC
News |
Chart |
Request a new note
C
A
S
I |
TPL
-
NYSE
Texas Pacific Land Trust
Real Estate Dvlpmt/Ops
|
$804.89
|
-34.21
-4.08% |
$834.00
|
18,812
144.71% of 50 DAV
50 DAV is 13,000
|
$877.97
-8.32%
|
9/14/2018
|
$820.45
|
PP = $874.10
|
|
MB = $917.81
|
Most Recent Note - 10/10/2018 5:58:50 PM
G - Color code is changed to green after a loss today on higher volume violated its 50 DMA line triggering a technical sell signal. A rebound above the 50 DMA line ($828) is needed for its outlook to improve. The recent low ($818 on 9/17/18) defines the next important near-term support to watch.
>>> FEATURED STOCK ARTICLE : Best Ever Close After a Solid Gain on Higher Volume - 9/4/2018 |
View all notes |
Set NEW NOTE alert |
Company Profile |
SEC
News |
Chart |
Request a new note
C
A
S
I |
ABMD
-
NASDAQ
Abiomed Inc
HEALTH SERVICES - Medical Instruments and Supplies
|
$376.89
|
-18.19
-4.60% |
$396.99
|
849,510
144.47% of 50 DAV
50 DAV is 588,000
|
$459.75
-18.02%
|
9/25/2018
|
$441.96
|
PP = $451.03
|
|
MB = $473.58
|
Most Recent Note - 10/10/2018 5:36:51 PM
G - Color code is changed to green after slumping below its 50 DMA line ($391) with higher volume behind today's 8th consecutive loss. Only a prompt rebound above the 50 DMA line would help its outlook improve.
>>> FEATURED STOCK ARTICLE : Quick Rebound Near Prior High - 9/25/2018 |
View all notes |
Set NEW NOTE alert |
Company Profile |
SEC
News |
Chart |
Request a new note
C
A
S
I |
ODFL
-
NASDAQ
Old Dominion Fght Line
TRANSPORTATION - Trucking
|
$139.00
|
-9.40
-6.33% |
$148.82
|
1,327,563
245.39% of 50 DAV
50 DAV is 541,000
|
$170.22
-18.34%
|
9/6/2018
|
$163.11
|
PP = $164.20
|
|
MB = $172.41
|
Most Recent Note - 10/10/2018 5:34:54 PM
Violated its 200 DMA line ($147) with a big volume-driven loss today triggering a more worrisome technical sell signal. It will be dropped from the Featured Stocks list tonight.
>>> FEATURED STOCK ARTICLE : Trucking Firm Perched at All-Time High - 9/7/2018 |
View all notes |
Set NEW NOTE alert |
Company Profile |
SEC
News |
Chart |
Request a new note
C
A
S
I |
Symbol/Exchange
Company Name
Industry Group |
PRICE |
CHANGE
(%Change) |
Day High |
Volume
(% DAV)
(% 50 day avg vol) |
52 Wk Hi
% From Hi |
Featured
Date |
Price
Featured |
Pivot Featured |
|
Max Buy |
DPZ
-
NYSE
Dominos Pizza Inc
Retail-Restaurants
|
$274.92
|
-9.26
-3.26% |
$285.76
|
569,431
113.66% of 50 DAV
50 DAV is 501,000
|
$305.34
-9.96%
|
8/13/2018
|
$288.60
|
PP = $293.91
|
|
MB = $308.61
|
Most Recent Note - 10/10/2018 1:30:01 PM
G - Color code is changed to green while sputtering below its 50 DMA line ($287) raising concerns. The recent low ($273.63 on 9/17/18) defines important near-term support to watch.
>>> FEATURED STOCK ARTICLE : Pulling Back After Wedging Gains for Highs Lacked Great Volume - 9/5/2018 |
View all notes |
Set NEW NOTE alert |
Company Profile |
SEC
News |
Chart |
Request a new note
C
A
S
I |
FIVE
-
NASDAQ
Five Below Inc
Retail-DiscountandVariety
|
$115.04
|
-6.01
-4.96% |
$121.97
|
1,228,255
133.94% of 50 DAV
50 DAV is 917,000
|
$136.13
-15.49%
|
7/6/2018
|
$98.90
|
PP = $104.09
|
|
MB = $109.29
|
Most Recent Note - 10/10/2018 5:56:26 PM
G - Violated its 50 DMA line ($117) with today's volume-driven loss triggering a technical sell signal. The prior high ($109.09 on 7/19/18) defines the next important support level to watch.
>>> FEATURED STOCK ARTICLE : Retreating After +138% Rally in Under 12 Months - 10/2/2018 |
View all notes |
Set NEW NOTE alert |
Company Profile |
SEC
News |
Chart |
Request a new note
C
A
S
I |
NOW
-
NYSE
Servicenow Inc
Computer Sftwr-Enterprse
|
$172.14
|
-9.27
-5.11% |
$180.83
|
3,538,151
195.05% of 50 DAV
50 DAV is 1,814,000
|
$206.30
-16.56%
|
8/24/2018
|
$193.83
|
PP = $194.91
|
|
MB = $204.66
|
Most Recent Note - 10/10/2018 6:01:56 PM
Slumped below the prior low ($174.35 on 7/12/18) and tested its 200 DMA line ($172) with a volume-driven loss today. A rebound above the 50 DMA line ($190) is needed for its outlook to improve. It will be dropped from the Featured Stocks list tonight.
>>> FEATURED STOCK ARTICLE : Found Support at 50-Day Average After Slump Into Prior Base - 10/3/2018 |
View all notes |
Set NEW NOTE alert |
Company Profile |
SEC
News |
Chart |
Request a new note
C
A
S
I |
NVEE
-
NASDAQ
N V 5 Global Inc
Comml Svcs-Consulting
|
$82.88
|
-1.41
-1.67% |
$84.57
|
108,110
122.85% of 50 DAV
50 DAV is 88,000
|
$92.75
-10.64%
|
6/15/2018
|
$7,070.00
|
PP = $72.00
|
|
MB = $75.60
|
Most Recent Note - 10/8/2018 6:55:02 PM
G - Still sputtering below its 50 DMA line ($86.32). A rebound above the 50 DMA line is needed for its outlook to improve. See the latest FSU analysis for more details and a new annotated graph.
>>> FEATURED STOCK ARTICLE : Recently Slumped Below 50-Day Moving Average Line - 10/8/2018 |
View all notes |
Set NEW NOTE alert |
Company Profile |
SEC
News |
Chart |
Request a new note
C
A
S
I |
PANW
-
NYSE
Palo Alto Networks
Computer Sftwr-Security
|
$202.38
|
-9.94
-4.68% |
$214.85
|
1,947,168
160.00% of 50 DAV
50 DAV is 1,217,000
|
$239.50
-15.50%
|
6/12/2018
|
$206.55
|
PP = $214.69
|
|
MB = $225.42
|
Most Recent Note - 10/10/2018 6:06:23 PM
G - After noted technical sell signals it slumped even further below its 50 DMA line ($221) and below the prior high ($219.38 on 7/13/18) with heavier volume behind today's 12th consecutive loss. A rebound above the 50 DMA line is needed for its outlook to improve.
>>> FEATURED STOCK ARTICLE : Perched Near All-Time High With Volume Totals Cooling - 9/17/2018 |
View all notes |
Set NEW NOTE alert |
Company Profile |
SEC
News |
Chart |
Request a new note
C
A
S
I |
Symbol/Exchange
Company Name
Industry Group |
PRICE |
CHANGE
(%Change) |
Day High |
Volume
(% DAV)
(% 50 day avg vol) |
52 Wk Hi
% From Hi |
Featured
Date |
Price
Featured |
Pivot Featured |
|
Max Buy |
PAYC
-
NYSE
Paycom Software Inc
COMPUTER SOFTWARE and SERVICES - Application Software
|
$128.56
|
-6.24
-4.63% |
$135.38
|
1,612,831
195.02% of 50 DAV
50 DAV is 827,000
|
$164.08
-21.65%
|
8/1/2018
|
$122.87
|
PP = $118.55
|
|
MB = $124.48
|
Most Recent Note - 10/10/2018 5:25:37 PM
Slumped further below its 50 DMA line with a volume-driven loss today after recently noted technical sell signals. A rebound above the 50 DMA line ($146) is needed for its outlook to improve. It will be dropped from the Featured Stocks list tonight.
>>> FEATURED STOCK ARTICLE : Very Extended From Base After Impressive Rally - 9/18/2018 |
View all notes |
Set NEW NOTE alert |
Company Profile |
SEC
News |
Chart |
Request a new note
C
A
S
I |
GRUB
-
NYSE
Grubhub Inc
INTERNET - Content
|
$117.82
|
-10.63
-8.28% |
$128.69
|
3,106,897
275.92% of 50 DAV
50 DAV is 1,126,000
|
$149.35
-21.11%
|
8/24/2018
|
$138.44
|
PP = $141.16
|
|
MB = $148.22
|
Most Recent Note - 10/10/2018 5:27:16 PM
Slumped further below its 50 DMA line ($135) and below the recent low ($132.15 on 9/24/18) with today's volume-driven loss after noted technical sell signals. A rebound above the 50 DMA line is needed for its outlook to improve. It will be dropped from the Featured Stocks list tonight.
>>> FEATURED STOCK ARTICLE : Wedged Higher Then Fell Below Pivot Point With Heavier Volume - 9/19/2018 |
View all notes |
Set NEW NOTE alert |
Company Profile |
SEC
News |
Chart |
Request a new note
C
A
S
I |
HQY
-
NASDAQ
Healthequity Inc
COMPUTER SOFTWARE and SERVICES - Healthcare Information Service
|
$84.76
|
-3.95
-4.45% |
$88.79
|
825,884
111.31% of 50 DAV
50 DAV is 742,000
|
$99.99
-15.23%
|
8/13/2018
|
$82.39
|
PP = $83.44
|
|
MB = $87.61
|
Most Recent Note - 10/8/2018 6:48:54 PM
G - Quietly slumped below its 50 DMA line ($89.05) today raising concerns. More damaging losses would raise greater concerns. Prior highs in the $82-83 area define the next important support to watch.
>>> FEATURED STOCK ARTICLE : Very Extended From Any Sound Base After Streak of Gains - 9/10/2018 |
View all notes |
Set NEW NOTE alert |
Company Profile |
SEC
News |
Chart |
Request a new note
C
A
S
I |
PYPL
-
NASDAQ
"PayPal Holdings, Inc"
Finance-CrdtCard/PmtPr
|
$75.45
|
-4.58
-5.72% |
$79.91
|
16,569,799
220.58% of 50 DAV
50 DAV is 7,512,000
|
$93.70
-19.48%
|
7/23/2018
|
$89.24
|
PP = $87.55
|
|
MB = $91.93
|
Most Recent Note - 10/10/2018 5:32:33 PM
Slumped further below its 200 DMA line ($82.24) and prior lows with a volume-driven loss today after damaging losses were noted triggered technical sell signals. A rebound above the 50 DMA line ($87.77) is needed for its outlook to improve. It will be dropped from the Featured Stocks list tonight.
>>> FEATURED STOCK ARTICLE : Consolidating Above 50-Day Moving Average Near High - 9/12/2018 |
View all notes |
Set NEW NOTE alert |
Company Profile |
SEC
News |
Chart |
Request a new note
C
A
S
I |
OLLI
-
NASDAQ
Ollie's Bargain Outlet
Retail-DiscountandVariety
|
$87.36
|
-3.22
-3.55% |
$90.97
|
919,359
142.32% of 50 DAV
50 DAV is 646,000
|
$97.61
-10.50%
|
7/12/2018
|
$74.43
|
PP = $77.60
|
|
MB = $81.48
|
Most Recent Note - 10/8/2018 12:49:02 PM
G - Very extended from any sound base. Its 50 DMA line ($83.59) defines near-term support above prior highs in the $77 area. Fundamentals remain strong.
>>> FEATURED STOCK ARTICLE : Encountered Distributional Pressure After a Great Rally - 10/9/2018 |
View all notes |
Set NEW NOTE alert |
Company Profile |
SEC
News |
Chart |
Request a new note
C
A
S
I |
Symbol/Exchange
Company Name
Industry Group |
PRICE |
CHANGE
(%Change) |
Day High |
Volume
(% DAV)
(% 50 day avg vol) |
52 Wk Hi
% From Hi |
Featured
Date |
Price
Featured |
Pivot Featured |
|
Max Buy |
TEAM
-
NASDAQ
Atlassian Corp Plc Cl A
Comp Sftwr-Spec Enterprs
|
$78.65
|
-2.64
-3.25% |
$80.69
|
2,381,154
163.77% of 50 DAV
50 DAV is 1,454,000
|
$98.21
-19.92%
|
7/27/2018
|
$73.73
|
PP = $68.85
|
|
MB = $72.29
|
Most Recent Note - 10/10/2018 5:29:58 PM
Slumped further below its 50 DMA line ($85.56) with a volume-driven loss today after a recently noted technical sell signal. A rebound above the 50 DMA line is needed for its outlook to improve. It will be dropped from the Featured Stocks list tonight.
>>> FEATURED STOCK ARTICLE : Extended From Base and Hitting Another New High - 9/14/2018 |
View all notes |
Set NEW NOTE alert |
Company Profile |
SEC
News |
Chart |
Request a new note
C
A
S
I |
SEND
-
NYSE
Sendgrid Inc
INTERNET - Content
|
$29.70
|
-2.03
-6.40% |
$31.66
|
739,231
82.05% of 50 DAV
50 DAV is 901,000
|
$38.66
-23.18%
|
8/13/2018
|
$32.20
|
PP = $32.13
|
|
MB = $33.74
|
Most Recent Note - 10/10/2018 5:24:08 PM
Slumped further below its 50 DMA line today after recently noted technical sell signals. A rebound above the 50 DMA line ($34) is needed for its outlook to improve. It will be dropped from the Featured Stocks list tonight.
>>> FEATURED STOCK ARTICLE : Extended From Prior Base Following Rally - 10/1/2018 |
View all notes |
Set NEW NOTE alert |
Company Profile |
SEC
News |
Chart |
Request a new note
C
A
S
I |