***Last / Change / Volume data in this table is the closing quote data***
Symbol/Exchange
Company Name
Industry Group |
PRICE |
CHANGE
(%Change) |
Day High |
Volume
(% DAV)
(% 50 day avg vol) |
52 Wk Hi
% From Hi |
Featured
Date |
Price
Featured |
Pivot Featured |
|
Max Buy |
OSBC
-
NASDAQ
Old Second Bancorp Inc
BANKING - Regional - Midwest Banks
|
$15.14
|
-0.12
-0.79% |
$15.29
|
49,943
52.57% of 50 DAV
50 DAV is 95,000
|
$16.30
-7.12%
|
9/24/2018
|
$15.38
|
PP = $16.40
|
|
MB = $17.22
|
Most Recent Note - 10/3/2018 6:23:03 PM
Y - Rebounded above its 50 DMA line ($15.36) with today's solid volume-driven gain. Prior lows and its 200 DMA line define additional near-term support. Its Relative Strength Rating is 77, below the 80+ minimum guideline for buy candidates. Met stubborn resistance after hitting a new high on 7/26/18 with a big volume-driven gain. Fundamentals remain strong.
>>> FEATURED STOCK ARTICLE : Bank Perched Less Than -5% Off Record High - 8/23/2018 |
View all notes |
Set NEW NOTE alert |
Company Profile |
SEC
News |
Chart |
Request a new note
C
A
S
I |
SIVB
-
NASDAQ
S V B Financial Group
BANKING - Regional - Pacific Banks
|
$316.05
|
-2.32
-0.73% |
$318.48
|
275,606
70.31% of 50 DAV
50 DAV is 392,000
|
$333.74
-5.30%
|
8/6/2018
|
$314.77
|
PP = $329.75
|
|
MB = $346.24
|
 Most Recent Note - 10/9/2018 5:17:57 PM
G - Still sputtering below its 50 DMA line ($320). A rebound above the 50 DMA line is needed for its outlook to improve. Subsequent gains above the pivot point backed by at least +40% above average volume are necessary to trigger a convincing new technical buy signal.
>>> FEATURED STOCK ARTICLE : Bank Posted Quiet Gain for a Best-Ever Close - 8/27/2018 |
View all notes |
Set NEW NOTE alert |
Company Profile |
SEC
News |
Chart |
Request a new note
C
A
S
I |
GMED
-
NYSE
Globus Medical Inc Cl A
CHEMICALS - Specialty Chemicals
|
$50.87
|
+0.68
1.35% |
$51.25
|
959,682
158.63% of 50 DAV
50 DAV is 605,000
|
$57.55
-11.61%
|
9/26/2018
|
$56.11
|
PP = $57.65
|
|
MB = $60.53
|
Most Recent Note - 10/9/2018 5:13:38 PM
G - Color code is changed to green after a slump. Halted its slide at its 200 DMA line, however a rebound above the 50 DMA line is needed for its outlook to improve. Subsequent gains above the pivot point backed by more than +40% above average volume are needed to trigger a proper technical buy signal.
>>> FEATURED STOCK ARTICLE : Rallying Near Pivot Point With Volume-Driven Gains - 9/26/2018 |
View all notes |
Set NEW NOTE alert |
Company Profile |
SEC
News |
Chart |
Request a new note
C
A
S
I |
ZBRA
-
NASDAQ
Zebra Tech Corp Cl A
COMPUTER HARDWARE - Computer Peripherals
|
$157.38
|
-1.12
-0.71% |
$161.29
|
457,266
120.02% of 50 DAV
50 DAV is 381,000
|
$179.47
-12.31%
|
8/7/2018
|
$164.26
|
PP = $161.82
|
|
MB = $169.91
|
Most Recent Note - 10/8/2018 6:53:29 PM
G - Violated its 50 DMA line ($165) and slumped below the prior high ($161) with damaging losses triggering technical sell signals. Only a prompt rebound above the 50 DMA line would help its outlook improve.
>>> FEATURED STOCK ARTICLE : Hovering Near All-Time High With Strong Fundamentals - 9/24/2018 |
View all notes |
Set NEW NOTE alert |
Company Profile |
SEC
News |
Chart |
Request a new note
C
A
S
I |
EPAM
-
NYSE
Epam Systems Inc
COMPUTER SOFTWARE and SERVICES - Information Technology Service
|
$128.94
|
-0.27
-0.21% |
$131.42
|
174,827
42.03% of 50 DAV
50 DAV is 416,000
|
$144.19
-10.58%
|
7/5/2018
|
$123.70
|
PP = $131.85
|
|
MB = $138.44
|
Most Recent Note - 10/5/2018 5:46:57 PM
G - Violated its 50 DMA line ($136) and recent low triggering technical sell signals this week. Only a prompt rebound above the 50 DMA line would help its outlook improve. See the latest FSU analysis for more details and a new annotated graph.
>>> FEATURED STOCK ARTICLE : Slump Below 50-Day Moving Average Raised Concerns - 10/5/2018 |
View all notes |
Set NEW NOTE alert |
Company Profile |
SEC
News |
Chart |
Request a new note
C
A
S
I |
Symbol/Exchange
Company Name
Industry Group |
PRICE |
CHANGE
(%Change) |
Day High |
Volume
(% DAV)
(% 50 day avg vol) |
52 Wk Hi
% From Hi |
Featured
Date |
Price
Featured |
Pivot Featured |
|
Max Buy |
IRBT
-
NASDAQ
Irobot Corp
CONSUMER DURABLES - Electronic Equipment
|
$94.99
|
-2.02
-2.08% |
$97.99
|
617,392
75.57% of 50 DAV
50 DAV is 817,000
|
$118.75
-20.01%
|
8/29/2018
|
$112.07
|
PP = $109.88
|
|
MB = $115.37
|
Most Recent Note - 10/8/2018 11:35:02 AM
G - Gapped down today violating both its 50 DMA line ($101.25) and the prior low ($99.73 on 9/07/18) triggering technical sell signals. Color code is changed to green. Only a prompt rebound above the 50 DMA line would help its outlook improve.
>>> FEATURED STOCK ARTICLE : Household Appliance Maker Rallied From Choppy Base - 8/29/2018 |
View all notes |
Set NEW NOTE alert |
Company Profile |
SEC
News |
Chart |
Request a new note
C
A
S
I |
TSC
-
NASDAQ
TriState Capital Hld Inc
CONSUMER NON-DURABLES - Personal Products
|
$27.99
|
-0.12
-0.43% |
$28.15
|
214,519
109.45% of 50 DAV
50 DAV is 196,000
|
$30.10
-7.01%
|
9/11/2018
|
$29.75
|
PP = $30.20
|
|
MB = $31.71
|
Most Recent Note - 10/3/2018 12:55:35 PM
G - A rebound above the 50 DMA line ($29.00) still is needed for its outlook to improve. Its Relative Strength Rating has improved to 83. Found support near prior highs in the $27 area. While rebounding it faces resistance due to overhead supply up to the $30 level.
>>> FEATURED STOCK ARTICLE : TriState Bank Perched Near All-Time High - 9/11/2018 |
View all notes |
Set NEW NOTE alert |
Company Profile |
SEC
News |
Chart |
Request a new note
C
A
S
I |
CME
-
NASDAQ
C M E Group Inc
DIVERSIFIED SERVICES - Business/Management Services
|
$181.16
|
+0.25
0.14% |
$182.09
|
1,543,113
118.79% of 50 DAV
50 DAV is 1,299,000
|
$182.97
-0.99%
|
10/4/2018
|
$179.29
|
PP = $177.45
|
|
MB = $186.32
|
Most Recent Note - 10/4/2018 5:55:27 PM
Y - Finished strong after highlighted in yellow with pivot point cited based on its 9/05/18 high plus 10 cents. Hit a new all-time high with +80% above average volume behind today's 4th consecutive gain while clearing a brief consolidation above its 50 DMA line. Earnings increases in the Mar and Jun '18 quarters were above the +25% minimum guideline (C criteria) with solid sales revenues increases. Annual earnings (A criteria) growth has been steady. See the latest FSU analysis for more details and a new annotated graph.
>>> FEATURED STOCK ARTICLE : CME Group Blasted to New Record High - 10/4/2018 |
View all notes |
Set NEW NOTE alert |
Company Profile |
SEC
News |
Chart |
Request a new note
C
A
S
I |
FLT
-
NYSE
Fleetcor Technologies
DIVERSIFIED SERVICES - Business/Management Services
|
$215.16
|
-1.65
-0.76% |
$217.15
|
440,141
84.00% of 50 DAV
50 DAV is 524,000
|
$230.24
-6.55%
|
9/12/2018
|
$221.01
|
PP = $226.02
|
|
MB = $237.32
|
Most Recent Note - 10/9/2018 5:10:08 PM
G - Sputtering below its 50 DMA line ($218) after 4 consecutive losses and its color code is changed to green. A rebound above the 50 DMA line is needed for its outlook to improve. Subsequent volume-driven gains above the pivot point are needed to trigger a new (or add-on) technical buy signal.
>>> FEATURED STOCK ARTICLE : Perched Within Close Striking Distance of New Pivot Point - 9/20/2018 |
View all notes |
Set NEW NOTE alert |
Company Profile |
SEC
News |
Chart |
Request a new note
C
A
S
I |
MA
-
NYSE
Mastercard Inc Cl A
Finance-CrdtCard/PmtPr
|
$209.76
|
+1.50
0.72% |
$210.99
|
4,508,512
143.67% of 50 DAV
50 DAV is 3,138,000
|
$225.35
-6.92%
|
7/11/2018
|
$203.84
|
PP = $204.10
|
|
MB = $214.31
|
Most Recent Note - 10/8/2018 12:48:23 PM
G - Violated the prior high ($214) and also violated its 50 DMA line ($211) with today's 3rd consecutive volume-driven loss, triggering technical sell signals. Only a prompt rebound above the 50 DMA line would help its outlook improve.
>>> FEATURED STOCK ARTICLE : Hovering Near High, Extended From Any Sound Base - 9/27/2018 |
View all notes |
Set NEW NOTE alert |
Company Profile |
SEC
News |
Chart |
Request a new note
C
A
S
I |
Symbol/Exchange
Company Name
Industry Group |
PRICE |
CHANGE
(%Change) |
Day High |
Volume
(% DAV)
(% 50 day avg vol) |
52 Wk Hi
% From Hi |
Featured
Date |
Price
Featured |
Pivot Featured |
|
Max Buy |
V
-
NYSE
Visa Inc Cl A
Finance-CrdtCard/PmtPr
|
$142.31
|
+0.42
0.30% |
$143.29
|
10,778,914
147.92% of 50 DAV
50 DAV is 7,287,000
|
$151.56
-6.10%
|
4/26/2018
|
$126.68
|
PP = $126.98
|
|
MB = $133.33
|
Most Recent Note - 10/8/2018 1:05:35 PM
G - Violated its 50 DMA line ($144) and recent low ($142.55 on 9/050/18) triggering technical sell signals. Only a rebound above the 50 DMA line would help its outlook improve.
>>> FEATURED STOCK ARTICLE : Visa Near Record but Endured Distributional Pressure - 9/13/2018 |
View all notes |
Set NEW NOTE alert |
Company Profile |
SEC
News |
Chart |
Request a new note
C
A
S
I |
ENV
-
NYSE
Envestnet Inc
FINANCIAL SERVICES - Diversified Investments
|
$59.69
|
-0.47
-0.78% |
$60.84
|
236,694
95.06% of 50 DAV
50 DAV is 249,000
|
$64.80
-7.89%
|
6/15/2018
|
$57.85
|
PP = $60.37
|
|
MB = $63.39
|
Most Recent Note - 10/8/2018 6:47:11 PM
G - Sputtering below its 50 DMA line ($61.15) again. A rebound is needed for its outlook to improve. Its Relative Strength Rating is 79, below the 80+ minimum guideline for buy candidates. Fundamentals remain strong.
>>> FEATURED STOCK ARTICLE : Found Recent Support at 50-Day Moving Average - 9/21/2018 |
View all notes |
Set NEW NOTE alert |
Company Profile |
SEC
News |
Chart |
Request a new note
C
A
S
I |
TPL
-
NYSE
Texas Pacific Land Trust
Real Estate Dvlpmt/Ops
|
$839.10
|
-2.96
-0.35% |
$844.76
|
8,863
68.18% of 50 DAV
50 DAV is 13,000
|
$877.97
-4.43%
|
9/14/2018
|
$820.45
|
PP = $874.10
|
|
MB = $917.81
|
Most Recent Note - 10/5/2018 1:00:05 PM
Y - Perched near its all-time high, holding its ground in a very tight range in recent weeks. New pivot point cited was based on its 8/27/18 high plus 10 cents. Subsequent gains above the pivot point back by at least +40% above average volume may trigger a new (or add-on) technical buy signal. The 50 DMA line ($823) and recent low ($818 on 9/17/18) define important near-term support to watch on pullbacks.
>>> FEATURED STOCK ARTICLE : Best Ever Close After a Solid Gain on Higher Volume - 9/4/2018 |
View all notes |
Set NEW NOTE alert |
Company Profile |
SEC
News |
Chart |
Request a new note
C
A
S
I |
ABMD
-
NASDAQ
Abiomed Inc
HEALTH SERVICES - Medical Instruments and Supplies
|
$395.08
|
-3.93
-0.98% |
$408.87
|
529,702
88.43% of 50 DAV
50 DAV is 599,000
|
$459.75
-14.07%
|
9/25/2018
|
$441.96
|
PP = $451.03
|
|
MB = $473.58
|
Most Recent Note - 10/8/2018 7:03:29 PM
Y - Tallied 6 consecutive losses since a "negative reversal" on 10/01/18 at its all-time high. Its 50 DMA line ($390) defines important support.
>>> FEATURED STOCK ARTICLE : Quick Rebound Near Prior High - 9/25/2018 |
View all notes |
Set NEW NOTE alert |
Company Profile |
SEC
News |
Chart |
Request a new note
C
A
S
I |
ODFL
-
NASDAQ
Old Dominion Fght Line
TRANSPORTATION - Trucking
|
$148.40
|
-2.35
-1.56% |
$152.00
|
583,552
108.47% of 50 DAV
50 DAV is 538,000
|
$170.22
-12.82%
|
9/6/2018
|
$163.11
|
PP = $164.20
|
|
MB = $172.41
|
Most Recent Note - 10/8/2018 6:51:42 PM
G - Color code is changed to green after slumping below its 50 DMA line ($154) raising concerns and triggering a technical sell signal. Only a prompt rebound would help its outlook improve. Its 200 DMA line ($147) defines near-term support above prior lows.
>>> FEATURED STOCK ARTICLE : Trucking Firm Perched at All-Time High - 9/7/2018 |
View all notes |
Set NEW NOTE alert |
Company Profile |
SEC
News |
Chart |
Request a new note
C
A
S
I |
Symbol/Exchange
Company Name
Industry Group |
PRICE |
CHANGE
(%Change) |
Day High |
Volume
(% DAV)
(% 50 day avg vol) |
52 Wk Hi
% From Hi |
Featured
Date |
Price
Featured |
Pivot Featured |
|
Max Buy |
DPZ
-
NYSE
Dominos Pizza Inc
Retail-Restaurants
|
$284.18
|
+3.94
1.41% |
$288.64
|
346,641
68.24% of 50 DAV
50 DAV is 508,000
|
$305.34
-6.93%
|
8/13/2018
|
$288.60
|
PP = $293.91
|
|
MB = $308.61
|
Most Recent Note - 10/3/2018 10:08:37 AM
Y - Consolidating near its 50 DMA line ($285) but again sputtering below the previously cited pivot point. The recent low ($273.63 on 9/17/18) defines important near-term support to watch.
>>> FEATURED STOCK ARTICLE : Pulling Back After Wedging Gains for Highs Lacked Great Volume - 9/5/2018 |
View all notes |
Set NEW NOTE alert |
Company Profile |
SEC
News |
Chart |
Request a new note
C
A
S
I |
FIVE
-
NASDAQ
Five Below Inc
Retail-DiscountandVariety
|
$121.05
|
+0.50
0.41% |
$124.01
|
733,034
80.20% of 50 DAV
50 DAV is 914,000
|
$136.13
-11.08%
|
7/6/2018
|
$98.90
|
PP = $104.09
|
|
MB = $109.29
|
Most Recent Note - 10/9/2018 5:08:09 PM
G - Tested support at its 50 DMA line ($117.02) this week. More damaging losses would raise concerns. Below that short-term average, the prior high ($109.09 on 7/19/18) defines the next important support level to watch.
>>> FEATURED STOCK ARTICLE : Retreating After +138% Rally in Under 12 Months - 10/2/2018 |
View all notes |
Set NEW NOTE alert |
Company Profile |
SEC
News |
Chart |
Request a new note
C
A
S
I |
NOW
-
NYSE
Servicenow Inc
Computer Sftwr-Enterprse
|
$181.41
|
+1.15
0.64% |
$187.29
|
2,330,448
128.40% of 50 DAV
50 DAV is 1,815,000
|
$206.30
-12.06%
|
8/24/2018
|
$193.83
|
PP = $194.91
|
|
MB = $204.66
|
Most Recent Note - 10/9/2018 12:25:36 PM
G - Sputtering below its 50 DMA line ($190) after volume-driven losses. A rebound above that important short-term average is needed for its outlook to improve. Prior low ($174.35 on 7/12/18) and 200 DMA line ($172) define the next important support levels to watch.
>>> FEATURED STOCK ARTICLE : Found Support at 50-Day Average After Slump Into Prior Base - 10/3/2018 |
View all notes |
Set NEW NOTE alert |
Company Profile |
SEC
News |
Chart |
Request a new note
C
A
S
I |
NVEE
-
NASDAQ
N V 5 Global Inc
Comml Svcs-Consulting
|
$84.29
|
+0.04
0.05% |
$85.50
|
49,209
55.92% of 50 DAV
50 DAV is 88,000
|
$92.75
-9.12%
|
6/15/2018
|
$7,070.00
|
PP = $72.00
|
|
MB = $75.60
|
Most Recent Note - 10/8/2018 6:55:02 PM
G - Still sputtering below its 50 DMA line ($86.32). A rebound above the 50 DMA line is needed for its outlook to improve. See the latest FSU analysis for more details and a new annotated graph.
>>> FEATURED STOCK ARTICLE : Recently Slumped Below 50-Day Moving Average Line - 10/8/2018 |
View all notes |
Set NEW NOTE alert |
Company Profile |
SEC
News |
Chart |
Request a new note
C
A
S
I |
PANW
-
NYSE
Palo Alto Networks
Computer Sftwr-Security
|
$212.32
|
-0.06
-0.03% |
$214.23
|
1,104,806
88.38% of 50 DAV
50 DAV is 1,250,000
|
$239.50
-11.35%
|
6/12/2018
|
$206.55
|
PP = $214.69
|
|
MB = $225.42
|
Most Recent Note - 10/9/2018 5:16:38 PM
G - Color code is changed to green after slumping below its 50 DMA line ($221) and below the prior high ($219.38 on 7/13/18) triggering technical sell signals during a streak of 11 consecutive losses. A prompt rebound above the 50 DMA line is needed for its outlook to improve.
>>> FEATURED STOCK ARTICLE : Perched Near All-Time High With Volume Totals Cooling - 9/17/2018 |
View all notes |
Set NEW NOTE alert |
Company Profile |
SEC
News |
Chart |
Request a new note
C
A
S
I |
Symbol/Exchange
Company Name
Industry Group |
PRICE |
CHANGE
(%Change) |
Day High |
Volume
(% DAV)
(% 50 day avg vol) |
52 Wk Hi
% From Hi |
Featured
Date |
Price
Featured |
Pivot Featured |
|
Max Buy |
PAYC
-
NYSE
Paycom Software Inc
COMPUTER SOFTWARE and SERVICES - Application Software
|
$134.80
|
+0.03
0.02% |
$137.40
|
561,722
67.60% of 50 DAV
50 DAV is 831,000
|
$164.08
-17.84%
|
8/1/2018
|
$122.87
|
PP = $118.55
|
|
MB = $124.48
|
Most Recent Note - 10/4/2018 3:04:33 PM
G - Violated its 50 DMA line ($144.60) with today's big volume-driven loss triggering a technical sell signal. Only a prompt rebound above the 50 DMA line would help its outlook improve.
>>> FEATURED STOCK ARTICLE : Very Extended From Base After Impressive Rally - 9/18/2018 |
View all notes |
Set NEW NOTE alert |
Company Profile |
SEC
News |
Chart |
Request a new note
C
A
S
I |
GRUB
-
NYSE
Grubhub Inc
INTERNET - Content
|
$128.45
|
+1.75
1.38% |
$129.66
|
1,182,451
102.82% of 50 DAV
50 DAV is 1,150,000
|
$149.35
-13.99%
|
8/24/2018
|
$138.44
|
PP = $141.16
|
|
MB = $148.22
|
Most Recent Note - 10/4/2018 3:11:01 PM
G - Color code is changed to green while slumping below its 50 DMA line ($135.46) and below the recent low ($132.15 on 9/24/18) with a big loss raising concerns and triggering technical sell signals. Recent gains lacked great volume conviction. Only a prompt rebound would help its outlook improve.
>>> FEATURED STOCK ARTICLE : Wedged Higher Then Fell Below Pivot Point With Heavier Volume - 9/19/2018 |
View all notes |
Set NEW NOTE alert |
Company Profile |
SEC
News |
Chart |
Request a new note
C
A
S
I |
HQY
-
NASDAQ
Healthequity Inc
COMPUTER SOFTWARE and SERVICES - Healthcare Information Service
|
$88.71
|
+0.69
0.78% |
$90.32
|
614,124
82.88% of 50 DAV
50 DAV is 741,000
|
$99.99
-11.28%
|
8/13/2018
|
$82.39
|
PP = $83.44
|
|
MB = $87.61
|
Most Recent Note - 10/8/2018 6:48:54 PM
G - Quietly slumped below its 50 DMA line ($89.05) today raising concerns. More damaging losses would raise greater concerns. Prior highs in the $82-83 area define the next important support to watch.
>>> FEATURED STOCK ARTICLE : Very Extended From Any Sound Base After Streak of Gains - 9/10/2018 |
View all notes |
Set NEW NOTE alert |
Company Profile |
SEC
News |
Chart |
Request a new note
C
A
S
I |
PYPL
-
NASDAQ
"PayPal Holdings, Inc"
Finance-CrdtCard/PmtPr
|
$80.03
|
-0.52
-0.65% |
$81.84
|
9,254,288
121.84% of 50 DAV
50 DAV is 7,595,400
|
$93.70
-14.59%
|
7/23/2018
|
$89.24
|
PP = $87.55
|
|
MB = $91.93
|
Most Recent Note - 10/8/2018 12:52:27 PM
G - Violated its 200 DMA line ($82.20) and undercut prior lows in the $80-81 area with today's 3rd consecutive loss triggering a worrisome technical sell signal. A rebound above the 50 DMA line ($87.94) is needed for its outlook to improve.
>>> FEATURED STOCK ARTICLE : Consolidating Above 50-Day Moving Average Near High - 9/12/2018 |
View all notes |
Set NEW NOTE alert |
Company Profile |
SEC
News |
Chart |
Request a new note
C
A
S
I |
OLLI
-
NASDAQ
Ollie's Bargain Outlet
Retail-DiscountandVariety
|
$90.58
|
+1.20
1.34% |
$91.33
|
757,887
117.87% of 50 DAV
50 DAV is 643,000
|
$97.61
-7.20%
|
7/12/2018
|
$74.43
|
PP = $77.60
|
|
MB = $81.48
|
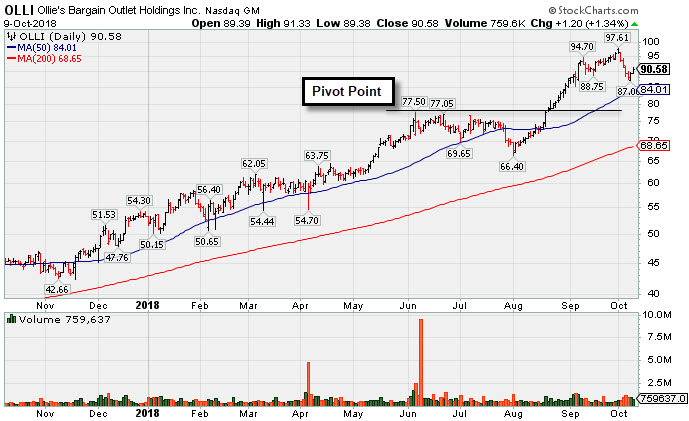
Most Recent Note - 10/8/2018 12:49:02 PM
G - Very extended from any sound base. Its 50 DMA line ($83.59) defines near-term support above prior highs in the $77 area. Fundamentals remain strong.
>>> FEATURED STOCK ARTICLE : Encountered Distributional Pressure After a Great Rally - 10/9/2018 |
View all notes |
Set NEW NOTE alert |
Company Profile |
SEC
News |
Chart |
Request a new note
C
A
S
I |
Symbol/Exchange
Company Name
Industry Group |
PRICE |
CHANGE
(%Change) |
Day High |
Volume
(% DAV)
(% 50 day avg vol) |
52 Wk Hi
% From Hi |
Featured
Date |
Price
Featured |
Pivot Featured |
|
Max Buy |
TEAM
-
NASDAQ
Atlassian Corp Plc Cl A
Comp Sftwr-Spec Enterprs
|
$81.29
|
+0.20
0.25% |
$83.85
|
1,667,328
113.27% of 50 DAV
50 DAV is 1,472,000
|
$98.21
-17.23%
|
7/27/2018
|
$73.73
|
PP = $68.85
|
|
MB = $72.29
|
Most Recent Note - 10/8/2018 7:01:19 PM
G - Violated its 50 DMA line ($85.23) triggering a technical sell signal with above average volume behind today's 6th consecutive loss. Only a prompt rebound above the 50 DMA line would help its outlook improve.
>>> FEATURED STOCK ARTICLE : Extended From Base and Hitting Another New High - 9/14/2018 |
View all notes |
Set NEW NOTE alert |
Company Profile |
SEC
News |
Chart |
Request a new note
C
A
S
I |
SEND
-
NYSE
Sendgrid Inc
INTERNET - Content
|
$31.73
|
-0.73
-2.25% |
$33.29
|
591,133
65.68% of 50 DAV
50 DAV is 900,000
|
$38.66
-17.93%
|
8/13/2018
|
$32.20
|
PP = $32.13
|
|
MB = $33.74
|
Most Recent Note - 10/8/2018 11:37:18 AM
G - Violated its 50 DMA line ($33.83) and prior highs in the $32 area with a big loss today triggering technical signals. Only a prompt rebound above the 50 DMA line would help its outlook improve.
>>> FEATURED STOCK ARTICLE : Extended From Prior Base Following Rally - 10/1/2018 |
View all notes |
Set NEW NOTE alert |
Company Profile |
SEC
News |
Chart |
Request a new note
C
A
S
I |