You are not logged in.
This means you
CAN ONLY VIEW reports that were published prior to Tuesday, April 8, 2025.
You
MUST UPGRADE YOUR MEMBERSHIP if you want to see any current reports.
AFTER MARKET UPDATE - THURSDAY, DECEMBER 1ST, 2022
Previous After Market Report Next After Market Report >>>
|
|
|
|
DOW |
-194.76 |
34,395.01 |
-0.56% |
|
Volume |
947,114,163 |
-53% |
|
Volume |
5,107,544,700 |
-21% |
|
NASDAQ |
+14.45 |
11,482.45 |
+0.13% |
|
Advancers |
1,662 |
55% |
|
Advancers |
2,396 |
53% |
|
S&P 500 |
-3.54 |
4,076.57 |
-0.09% |
|
Decliners |
1,352 |
45% |
|
Decliners |
2,124 |
47% |
|
Russell 2000 |
-4.90 |
1,881.68 |
-0.26% |
|
52 Wk Highs |
104 |
|
|
52 Wk Highs |
134 |
|
|
S&P 600 |
-3.00 |
1,240.42 |
-0.24% |
|
52 Wk Lows |
25 |
|
|
52 Wk Lows |
109 |
|
|
 |
Leadership Improved But Major Indices Ended Mixed
Kenneth J. Gruneisen - Passed the CAN SLIM® Master's Exam
The Dow lost 194 points, while the Nasdaq Composite climbed 0.1%. The S&P 500 declined 0.1%. Volume totals were lighter than the prior session on the NYSE and on the Nasdaq exchange. Breadth was slightly positive as advancers led decliners by an 8-7 margin on the NYSE and on the Nasdaq exchange. There were 58 high-ranked companies from the Leaders List that hit new 52-week highs and were listed on the BreakOuts Page, versus the total of 40 on the prior session. New 52-week highs outnumbered new 52-week lows on the NYSE and on the Nasdaq exchange. The market is in a confirmed uptrend (M criteria). Healthy leadership (new 52-week highs totals) has continued helping the rally be productive. Only stocks meeting all key-criteria of the fact-based investment system should be considered as buy candidates.
Chart courtesy of www.stockcharts.com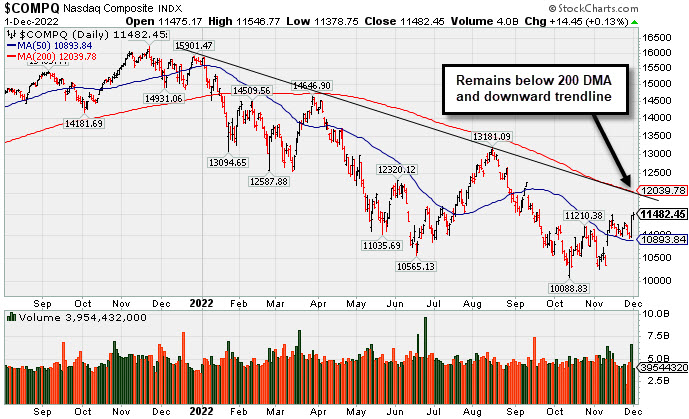 PICTURED: The Nasdaq Composite Index remains below its 200 DMA line and below its long term downward trendline.
U.S. equities finished mixed Thursday amid October’s sharp uptick in household spending while inflation data showed easing in November. As investors assess today’s data, they await the release of November’s closely watched U.S. jobs data due Friday morning. Seven of the 11 sectors in the S&P 500 finished in negative territory, with Financials leading laggards.
On the data front, the Federal Reserve (Fed) favored core Personal Consumption Expenditures (PCE) price index (which excludes volatile food and energy) increased 0.2% month-over-month and 5% annually. The headline PCE rose 0.3% monthly and 6% annually. Meanwhile, the Institute for Supply Management (ISM) manufacturing index came in weaker-than-expected at 49 in November compared to the 49.7 expected, reaching its lowest level since May 2020. Also, the ISM prices paid index came in lower-than-expected by 2.9 reaching 43 for November indicating inflation may be weakening.
Treasury yields lost momentum Thursday as investor’s focus had shifted to the possibility of a recession. The yield on the 10-year note lost 14 basis points (0.14%) to 3.50%, while the 30-year bond yield shed 17 basis points (0.17%) to 3.60%. The two-year note yield slipped nine basis points (0.09%) to 4.24%. In commodities, West Texas Intermediate (WTI) crude climbed 1% to $81.32/barrel as investors shift their focus to the Organization of the Petroleum Exporting Countries’ (OPEC) meeting Sunday. In the metals complex, Gold increased 3.2% for its best daily performance since April 9, 2020, when the index climbed 4.1%.
|
 Kenneth J. Gruneisen started out as a licensed stockbroker in August 1987, a couple of months prior to the historic stock market crash that took the Dow Jones Industrial Average down -22.6% in a single day. He has published daily fact-based fundamental and technical analysis on high-ranked stocks online for two decades. Through FACTBASEDINVESTING.COM, Kenneth provides educational articles, news, market commentary, and other information regarding proven investment systems that work in good times and bad.
Comments contained in the body of this report are technical opinions only and are not necessarily those of Gruneisen Growth Corp. The material herein has been obtained from sources believed to be reliable and accurate, however, its accuracy and completeness cannot be guaranteed. Our firm, employees, and customers may effect transactions, including transactions contrary to any recommendation herein, or have positions in the securities mentioned herein or options with respect thereto. Any recommendation contained in this report may not be suitable for all investors and it is not to be deemed an offer or solicitation on our part with respect to the purchase or sale of any securities. |
|
 |
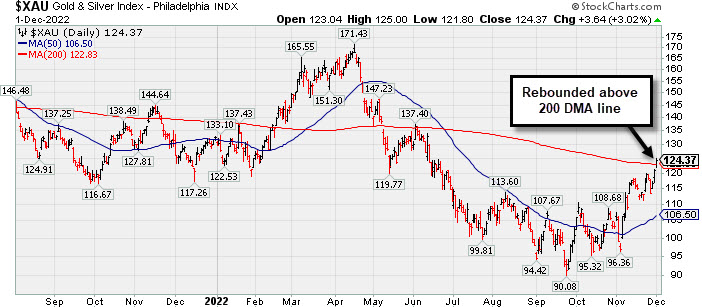
Gold & Silver, Biotech, and Broker/Dealer Indexes Rose
Kenneth J. Gruneisen - Passed the CAN SLIM® Master's Exam
The Retail Index ($RLX -0.45%) and Bank Index ($BKX -1.32%) both lost ground while the Broker/Dealer Index ($XBD +0.26%) eked out a small gain. The tech sector was mixed as the Semiconductor Index ($SOX -0.78%) edged lower and the Biotech Index ($BTK +0.75%) edged higher while the Networking Index ($NWX -0.02%) finished flat. The Gold & Silver Index ($XAU +3.02%) outpaced the Oil Services Index ($OSX -0.72%) and Integrated Oil Index ($XOI -0.92%) to the downside.
PICTURED: The Gold & Silver Index ($XAU +3.02%) posted a solid gain rebounding above its 200-day moving average (DMA) line.
| Oil Services |
$OSX |
83.52 |
-0.60 |
-0.72% |
+58.42% |
| Integrated Oil |
$XOI |
1,858.49 |
-17.29 |
-0.92% |
+57.74% |
| Semiconductor |
$SOX |
2,804.69 |
-22.15 |
-0.78% |
-28.93% |
| Networking |
$NWX |
836.89 |
-0.16 |
-0.02% |
-13.82% |
| Broker/Dealer |
$XBD |
483.99 |
+1.24 |
+0.26% |
-0.59% |
| Retail |
$RLX |
2,980.56 |
-13.60 |
-0.45% |
-29.48% |
| Gold & Silver |
$XAU |
124.37 |
+3.64 |
+3.02% |
-6.10% |
| Bank |
$BKX |
107.45 |
-1.44 |
-1.32% |
-18.73% |
| Biotech |
$BTK |
5,355.37 |
+39.62 |
+0.75% |
-2.96% |
|
|
|
 |
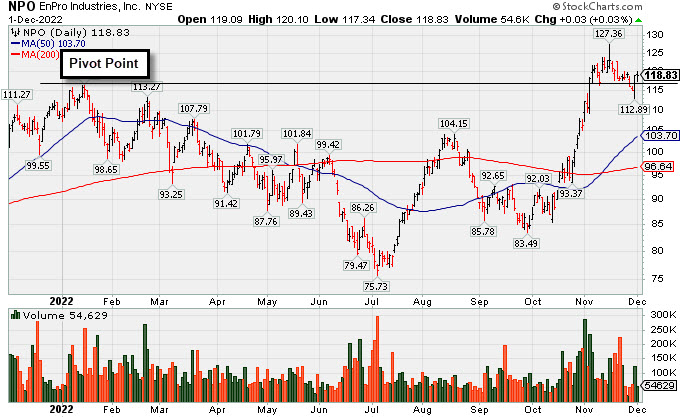
Consolidating Near Old Highs Following Recent Breakout
Kenneth J. Gruneisen - Passed the CAN SLIM® Master's Exam
Enpro Industries Inc (NPO +$0.03 or +0.03% to $118.83) inched higher today. Volume was +25% above average on the prior session as it managed a "positive reversal" and rebounded back above the pivot point cited. Fundamentals remain strong.
NPO was highlighted in yellow with pivot point cited based on its 1/14/22 high plus 10 cents in the 11/04/22 mid-day report (read here) and it was shown in greater detail with an annotated graph that evening under the headline, "Finished Strong After Highlighted in Friday Mid-Day Report". It had rallied into new 52-week high territory with impressive volume-driven gains after a 9-month consolidation.
NPO has a 98 Earnings Per Share Rating. It reported Sep '22 quarterly earnings +65% on +34% sales revenues versus the year ago period, its 3rd strong quarterly comparison above the +25% minimum earnings guideline (C criteria), helping it better match the winning models of the fact-based investment system. Annual earnings growth has been steady even through the pandemic. It hails from the Machinery-Gen Industrial group which is currently ranked 32rd on the 197 Industry Groups list (L criteria).
Its small supply of only 20.8 million shares outstanding can contribute to greater price volatility in the event of institutional buying or selling. The number of top-rated funds owning its shares fell from 411 in Mar '22 to 398 in Sep '22, however its current Up/Down Volume Ratio of 1.2 is an unbiased indication its shares have been under accumulation over the past 50 days. It has an A Timeliness Rating and a B Sponsorship Rating. |
|
|
Color Codes Explained :
Y - Better candidates highlighted by our
staff of experts.
G - Previously featured
in past reports as yellow but may no longer be buyable under the
guidelines.
***Last / Change / Volume data in this table is the closing quote data***
Symbol/Exchange
Company Name
Industry Group |
PRICE |
CHANGE
(%Change) |
Day High |
Volume
(% DAV)
(% 50 day avg vol) |
52 Wk Hi
% From Hi |
Featured
Date |
Price
Featured |
Pivot Featured |
|
Max Buy |
 ESQ
-
NASDAQ
ESQ
-
NASDAQ
Esquire Financial Hldgs
Finance-Commercial Loans
|
$44.75
|
-0.09
-0.20% |
$45.10
|
10,094
34.81% of 50 DAV
50 DAV is 29,000
|
$48.13
-7.02%
|
10/18/2022
|
$40.02
|
PP = $39.95
|
|
MB = $41.95
|
Most Recent Note - 11/30/2022 5:22:52 PM
G - Posted a big gain today with near average volume after 4 consecutive losses. Prior highs and its 50 DMA line ($41.59) coincide in the $41 area defining important near-term support to watch on pullbacks.
>>> FEATURED STOCK ARTICLE : Pulled Back Following "Negative Reversal" at All-Time High - 11/25/2022 |
View all notes |
Set NEW NOTE alert |
Company Profile |
SEC
News |
Chart |
Request a new note
C
A
S
I |
CCRN
-
NASDAQ
Cross Country Healthcare
DIVERSIFIED SERVICES - Staffing and Outsourcing Service
|
$35.35
|
-0.43
-1.20% |
$36.06
|
490,017
59.32% of 50 DAV
50 DAV is 826,000
|
$40.12
-11.89%
|
9/9/2022
|
$27.32
|
PP = $30.61
|
|
MB = $32.14
|
 Most Recent Note - 12/1/2022 4:28:22 PM
G - It has not formed a new base of sufficient length but has still been consolidating above its 50 DMA line ($33.35) and its color code was changed to green while trading above its "max buy" level. Reported Sep '22 quarterly earnings +75% on +70% sales revenues versus the year ago period.
>>> FEATURED STOCK ARTICLE : Consolidating Above Prior Highs and Above 50-Day Moving Average - 11/8/2022 |
View all notes |
Set NEW NOTE alert |
Company Profile |
SEC
News |
Chart |
Request a new note
C
A
S
I |
CMC
-
NYSE
Commercial Metals Co
METALS and MINING - Steel and Iron
|
$49.06
|
-0.16
-0.33% |
$49.69
|
908,448
92.13% of 50 DAV
50 DAV is 986,000
|
$49.41
-0.71%
|
10/14/2022
|
$41.61
|
PP = $44.45
|
|
MB = $46.67
|
Most Recent Note - 12/1/2022 4:25:56 PM
G - Quietly touched a new high today but ended the session slightly lower with below average volume. Fundamentals remain strong. Prior high in the $44 area defines initial support to watch above its 50 DMA line ($43.34).
>>> FEATURED STOCK ARTICLE : Steel/Metal Products Firm Quietly Perched Near All Time High - 11/7/2022 |
View all notes |
Set NEW NOTE alert |
Company Profile |
SEC
News |
Chart |
Request a new note
C
A
S
I |
VRTX
-
NASDAQ
Vertex Pharmaceuticals
Medical-Biomed/Biotech
|
$320.76
|
+4.36
1.38% |
$321.53
|
1,542,978
101.25% of 50 DAV
50 DAV is 1,524,000
|
$323.61
-0.88%
|
10/24/2022
|
$308.47
|
PP = $306.05
|
|
MB = $321.35
|
Most Recent Note - 11/30/2022 5:37:34 PM
Y - Churned +322% above average volume today but only posted a small gain after briefly trading above its "max buy" level and ended in the lower half of its intra-day range, action indicative of distributional pressure. Its 50 DMA line ($302) defines near-term support above recent intra-day lows in the $287-288 area. Recently reported Sep '22 quarterly earnings +14% on +18% sales revenues versus the year ago period, below the +25% minimum earnings guideline raising fundamental concerns (C criteria). Annual earnings (A criteria) history has been strong.
>>> FEATURED STOCK ARTICLE : Made Little Progress Following Breakout and Latest Earnings News - 11/16/2022 |
View all notes |
Set NEW NOTE alert |
Company Profile |
SEC
News |
Chart |
Request a new note
C
A
S
I |
GPK
-
NYSE
Graphic Packaging Hldg
CONSUMER NON-DURABLES - Packaging and Containers
|
$22.93
|
-0.05
-0.22% |
$23.18
|
3,473,063
120.13% of 50 DAV
50 DAV is 2,891,000
|
$24.07
-4.74%
|
10/25/2022
|
$22.75
|
PP = $24.17
|
|
MB = $25.38
|
Most Recent Note - 12/1/2022 4:24:09 PM
Y - Still consolidating above its 50 DMA line ($21.65), perched within striking distance of its 52-week high and pivot point. More damaging losses would raise concerns and trigger a technical sell signal. Subsequent gains above the pivot point backed by at least +40% above average volume may trigger a technical buy signal. Fundamentals remain strong.
>>> FEATURED STOCK ARTICLE : Consolidating Above 50-Day Moving Average Still Perched Near High - 11/17/2022 |
View all notes |
Set NEW NOTE alert |
Company Profile |
SEC
News |
Chart |
Request a new note
C
A
S
I |
Symbol/Exchange
Company Name
Industry Group |
PRICE |
CHANGE
(%Change) |
Day High |
Volume
(% DAV)
(% 50 day avg vol) |
52 Wk Hi
% From Hi |
Featured
Date |
Price
Featured |
Pivot Featured |
|
Max Buy |
CBZ
-
NYSE
C B I Z Inc
Comml Svcs-Consulting
|
$49.71
|
+0.06
0.12% |
$50.00
|
154,105
57.93% of 50 DAV
50 DAV is 266,000
|
$50.57
-1.70%
|
10/26/2022
|
$47.83
|
PP = $48.57
|
|
MB = $51.00
|
Most Recent Note - 11/30/2022 5:16:29 PM
Y - Posted a gain with below average volume today as it nearly challenged its 52-week high. Its 50 DMA line ($46.52) and recent low define important near-term support. Recently reported Sep '22 quarterly earnings +24% on +28% sales revenues versus the year ago period.
>>> FEATURED STOCK ARTICLE : Gapped Up and Rebounded Above Pivot Point - 11/18/2022 |
View all notes |
Set NEW NOTE alert |
Company Profile |
SEC
News |
Chart |
Request a new note
C
A
S
I |
ENPH
-
NASDAQ
Enphase Energy Inc
Energy-Solar
|
$314.00
|
-6.59
-2.06% |
$322.33
|
2,216,915
55.84% of 50 DAV
50 DAV is 3,970,000
|
$324.84
-3.34%
|
10/26/2022
|
$301.55
|
PP = $324.94
|
|
MB = $341.19
|
Most Recent Note - 12/1/2022 5:36:58 PM
Y - Pulled back with lighter volume today after a big gain with average volume on the prior session finishing 3 cents off its best-ever close. Perched within close striking distance of its pivot point. Faces no resistance due to overhead supply. Its 50 DMA line ($283.51) defines near-term support above the recent low ($262.60 on 11/07/22). Fundamentals remain strong.
>>> FEATURED STOCK ARTICLE : Perched Near High Still Awaiting Technical Breakout - 11/21/2022 |
View all notes |
Set NEW NOTE alert |
Company Profile |
SEC
News |
Chart |
Request a new note
C
A
S
I |
HRMY
-
NASDAQ
Harmony Biosciences Holdings
Medical-Biomed/Biotech
|
$60.00
|
+0.23
0.38% |
$60.40
|
455,153
97.53% of 50 DAV
50 DAV is 466,700
|
$61.55
-2.52%
|
11/1/2022
|
$55.31
|
PP = $57.23
|
|
MB = $60.09
|
Most Recent Note - 11/30/2022 5:41:50 PM
Y - Posted a solid gain today with average volume for its second best ever close, finishing perched near its all-time high. The 11/17/22 low ($53.06) defines initial support to watch above its 50 DMA line ($51.93).
>>> FEATURED STOCK ARTICLE : Harmony Still Hovering Near All-Time High - 11/28/2022 |
View all notes |
Set NEW NOTE alert |
Company Profile |
SEC
News |
Chart |
Request a new note
C
A
S
I |
CLH
-
NYSE
Clean Harbors Inc
Pollution Control
|
$120.70
|
+0.70
0.58% |
$122.07
|
330,539
76.16% of 50 DAV
50 DAV is 434,000
|
$124.49
-3.04%
|
11/2/2022
|
$121.59
|
PP = $124.59
|
|
MB = $130.82
|
Most Recent Note - 11/30/2022 5:28:22 PM
Y - Gain today for a prompt rebound above the 50 DMA line ($115.91) helped its outlook improve and its color code is changed to yellow. Fundamentals remain strong.
>>> FEATURED STOCK ARTICLE : Volume-Driven Losses Undercut 50-Day Moving Average - 11/29/2022 |
View all notes |
Set NEW NOTE alert |
Company Profile |
SEC
News |
Chart |
Request a new note
C
A
S
I |
NPO
-
NYSE
Enpro Industries Inc
Machinery-Gen Industrial
|
$118.83
|
+0.03
0.03% |
$120.10
|
54,629
55.18% of 50 DAV
50 DAV is 99,000
|
$127.67
-6.92%
|
11/4/2022
|
$119.06
|
PP = $117.73
|
|
MB = $123.62
|
Most Recent Note - 12/1/2022 5:33:44 PM
Y - Posted a small gain today with light volume. Volume was +25% above average on the prior session as it managed a "positive reversal" and rebounded back above the pivot point cited. Fundamentals remain strong. See the latest FSU analysis for more details and a new annotated graph.
>>> FEATURED STOCK ARTICLE : Consolidating Near Old Highs Following Recent Breakout - 12/1/2022 |
View all notes |
Set NEW NOTE alert |
Company Profile |
SEC
News |
Chart |
Request a new note
C
A
S
I |
Symbol/Exchange
Company Name
Industry Group |
PRICE |
CHANGE
(%Change) |
Day High |
Volume
(% DAV)
(% 50 day avg vol) |
52 Wk Hi
% From Hi |
Featured
Date |
Price
Featured |
Pivot Featured |
|
Max Buy |
DGII
-
NASDAQ
Digi International Inc
COMPUTER HARDWARE - Networking and Communication Dev
|
$41.13
|
-1.34
-3.16% |
$42.70
|
238,005
60.10% of 50 DAV
50 DAV is 396,000
|
$43.68
-5.84%
|
11/10/2022
|
$41.82
|
PP = $40.96
|
|
MB = $43.01
|
Most Recent Note - 12/1/2022 5:37:40 PM
Y - Pulled back today with lighter volume after a big gain on the prior session with average volume finishing one cent below its best ever close. Recently wedged above the pivot point cited based on its 10/31/22 high plus 10 cents after forming an advanced "ascending base" pattern. Subsequent gains above the pivot point backed by at least +40% above average volume are needed to confirm a proper technical buy signal. Fundamentals remain strong.
>>> FEATURED STOCK ARTICLE : Finish Below Pivot Point Leaves Disciplined Investors Waiting - 11/10/2022 |
View all notes |
Set NEW NOTE alert |
Company Profile |
SEC
News |
Chart |
Request a new note
C
A
S
I |
GFF
-
NYSE
Griffon Corporation
MATERIALS and CONSTRUCTION - General Building Materials
|
$35.49
|
+0.18
0.51% |
$35.64
|
235,884
63.58% of 50 DAV
50 DAV is 371,000
|
$36.75
-3.43%
|
11/10/2022
|
$34.13
|
PP = $35.02
|
|
MB = $36.77
|
Most Recent Note - 12/1/2022 4:19:37 PM
Y - Posted a 3rd consecutive gain today, perched near its 52-week high. Prior highs in the $34 area define initial support to watch above its 50 DMA line ($32.02). Reported Sep '22 quarterly earnings +230% on +24% sales revenues versus the year ago period.
>>> FEATURED STOCK ARTICLE : Griffon Perched Near 52-Week High After 9-Week Base - 11/11/2022 |
View all notes |
Set NEW NOTE alert |
Company Profile |
SEC
News |
Chart |
Request a new note
C
A
S
I |
ANET
-
NYSE
Arista Networks Inc
Computer-Networking
|
$139.78
|
+0.48
0.34% |
$140.81
|
1,641,012
70.10% of 50 DAV
50 DAV is 2,341,000
|
$148.57
-5.92%
|
11/14/2022
|
$132.05
|
PP = $133.70
|
|
MB = $140.39
|
Most Recent Note - 11/30/2022 5:14:48 PM
Y - Posted a big gain today backed by +17% above average volume and finished at the session high. Subsequent gains and a close above the pivot point must be backed by at least +40% above average volume to trigger a proper technical buy signal. Faces some resistance due to overhead supply up to the $148 level. Fundamentals are strong.
>>> FEATURED STOCK ARTICLE : Finished in Middle of Intra-Day Range After Challenging Pivot Point - 11/14/2022 |
View all notes |
Set NEW NOTE alert |
Company Profile |
SEC
News |
Chart |
Request a new note
C
A
S
I |
CPRX
-
NASDAQ
Catalyst Pharma Inc
Medical-Biomed/Biotech
|
$16.63
|
-0.14
-0.83% |
$16.90
|
1,843,540
79.36% of 50 DAV
50 DAV is 2,323,000
|
$18.39
-9.57%
|
11/22/2022
|
$17.38
|
PP = $16.66
|
|
MB = $17.49
|
Most Recent Note - 11/30/2022 5:39:27 PM
Y - Posted a solid gain today after a streak of 4 consecutive losses. Rallied from a 9-week cup-with-handle base with a big gain backed above average volume noted. Reported Sep '22 quarterly earnings +86% on +59% sales revenues versus the year ago period. Disciplined investors avoid chasing stocks that are extended more than +5% above prior highs or the "max buy" level.
>>> FEATURED STOCK ARTICLE : Breakout From Cup-With-Handle With 90% Above Average Volume - 11/22/2022 |
View all notes |
Set NEW NOTE alert |
Company Profile |
SEC
News |
Chart |
Request a new note
C
A
S
I |
CLFD
-
NASDAQ
Clearfield Inc
TELECOMMUNICATIONS - Cables / Satalite Equipment
|
$125.89
|
-5.73
-4.35% |
$132.22
|
248,641
86.33% of 50 DAV
50 DAV is 288,000
|
$134.90
-6.68%
|
11/23/2022
|
$131.27
|
PP = $130.11
|
|
MB = $136.62
|
Most Recent Note - 12/1/2022 5:34:46 PM
Y - Pulled back today with lighter volume. On the prior session a big gain for a best-ever close with +41% above average volume triggered a new technical buy signal.
>>> FEATURED STOCK ARTICLE : Hit New High But Encountered Distributional Pressure - 11/23/2022 |
View all notes |
Set NEW NOTE alert |
Company Profile |
SEC
News |
Chart |
Request a new note
C
A
S
I |
Symbol/Exchange
Company Name
Industry Group |
PRICE |
CHANGE
(%Change) |
Day High |
Volume
(% DAV)
(% 50 day avg vol) |
52 Wk Hi
% From Hi |
Featured
Date |
Price
Featured |
Pivot Featured |
|
Max Buy |
TITN
-
NASDAQ
Titan Machinery Inc
SPECIALTY RETAIL
|
$42.46
|
-1.57
-3.57% |
$44.35
|
633,437
392.22% of 50 DAV
50 DAV is 161,500
|
$44.29
-4.13%
|
11/30/2022
|
$40.10
|
PP = $38.68
|
|
MB = $40.61
|
Most Recent Note - 12/1/2022 1:04:08 PM
G - Holding its ground today. Finished strong after highlighted in yellow with pivot point cited based on its 11/23/21 high plus 10 cents in the prior mid-day report. Gapped up and rallied for a big gain and new all-time high backed by +821% above average volume triggering a technical buy signal. Quickly got extended more than +5% above the prior high and its color code is changed to green. Fundamentals remain strong after reporting Oct '22 quarterly earnings +91% on +47% sales revenues. Went through a long consolidation below its 200 DMA line since dropped from the Featured Stocks list on 1/26/22.
>>> FEATURED STOCK ARTICLE : Gap Up and Big Volume-Driven Breakout Gain - 11/30/2022 |
View all notes |
Set NEW NOTE alert |
Company Profile |
SEC
News |
Chart |
Request a new note
C
A
S
I |
|
|
|
THESE ARE NOT BUY RECOMMENDATIONS!
Comments contained in the body of this report are technical
opinions only. The material herein has been obtained
from sources believed to be reliable and accurate, however,
its accuracy and completeness cannot be guaranteed.
This site is not an investment advisor, hence it does
not endorse or recommend any securities or other investments.
Any recommendation contained in this report may not
be suitable for all investors and it is not to be deemed
an offer or solicitation on our part with respect to
the purchase or sale of any securities. All trademarks,
service marks and trade names appearing in this report
are the property of their respective owners, and are
likewise used for identification purposes only.
This report is a service available
only to active Paid Premium Members.
You may opt-out of receiving report notifications
at any time. Questions or comments may be submitted
by writing to Premium Membership Services 665 S.E. 10 Street, Suite 201 Deerfield Beach, FL 33441-5634 or by calling 1-800-965-8307
or 954-785-1121.
|
|
|