You are not logged in.
This means you
CAN ONLY VIEW reports that were published prior to Wednesday, April 2, 2025.
You
MUST UPGRADE YOUR MEMBERSHIP if you want to see any current reports.
AFTER MARKET UPDATE - WEDNESDAY, JULY 19TH, 2023
Previous After Market Report Next After Market Report >>>
|
|
|
|
DOW |
+109.28 |
35,061.21 |
+0.31% |
|
Volume |
899,741,259 |
+2% |
|
Volume |
5,188,583,100 |
+7% |
|
NASDAQ |
+4.38 |
14,358.02 |
+0.03% |
|
Advancers |
1,881 |
65% |
|
Advancers |
2,488 |
56% |
|
S&P 500 |
+10.74 |
4,565.72 |
+0.24% |
|
Decliners |
1,005 |
35% |
|
Decliners |
1,937 |
44% |
|
Russell 2000 |
+8.82 |
1,984.89 |
+0.45% |
|
52 Wk Highs |
156 |
|
|
52 Wk Highs |
270 |
|
|
S&P 600 |
+7.40 |
1,270.99 |
+0.59% |
|
52 Wk Lows |
8 |
|
|
52 Wk Lows |
71 |
|
|
 |
Breadth Remained Positive as Major Indices Posted Gains
Kenneth J. Gruneisen - Passed the CAN SLIM® Master's Exam
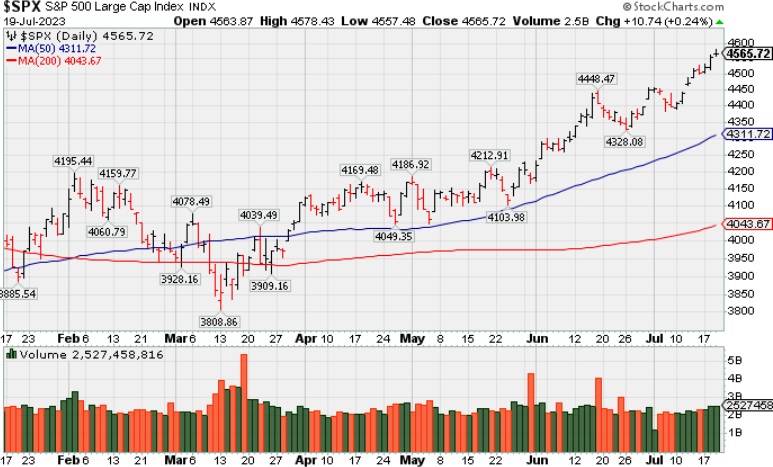
The major indices finished with modest gains and showed a continued aversion to negative territory. The volume totals reported were higher on the NYSE and on the Nasdaq exchange versus the prior session, indicative of increasing institutional buying demand. Breadth was positive as advancers led decliners by almost a 2-1 margin on the NYSE and by a 5-4 margin on the Nasdaq exchange. There were 100 high-ranked companies from the Leaders List that hit a new 52-week high and were listed on the BreakOuts Page, versus the total of 155 on the prior session. New 52-week highs totals solidly outnumbered shrinking new 52-week lows totals on the NYSE and on the Nasdaq exchange. The major indices are in a confirmed uptrend (M criteria). Appropriate new buying efforts may be considered under the fact-based investment system.
PICTURED: The S&P 500 Index hit a new 2023 high with its 7th gain in the span of 8 sessions. It is up +18.9% year-to-date.
Mega cap names showed some hesitation in front of earnings reports after the close from Tesla (TSLA -0.7%) and Netflix (NLFX +0.6%). On the earnings front, Goldman Sachs (GS +1.0%) outperformed despite missing on Q2 EPS estimates. J.B. Hunt (JBHT +3.8%) also posted a sizable gain despite mentioning a freight recession but some improvement in customer destocking.
Northern Trust (NTRS +13.4%), M&T Bank (MTB +2.5%), Western Alliance (WAL +7.8%), and U.S. Bancorp (USB +6.5%) were notable winners following their earnings reports. The real estate (+1.1%) and utilities (+1.0%) sectors saw the largest gains, meanwhile, only three S&P 500 sectors closed with losses.
Treasuries settled with gains. The 2-yr note yield fell one basis point to 4.75% and the 10-yr note yield fell five basis points to 3.74%. The $12 billion 20-yr bond reopening was met with lukewarm demand. |
 Kenneth J. Gruneisen started out as a licensed stockbroker in August 1987, a couple of months prior to the historic stock market crash that took the Dow Jones Industrial Average down -22.6% in a single day. He has published daily fact-based fundamental and technical analysis on high-ranked stocks online for two decades. Through FACTBASEDINVESTING.COM, Kenneth provides educational articles, news, market commentary, and other information regarding proven investment systems that work in good times and bad.
Comments contained in the body of this report are technical opinions only and are not necessarily those of Gruneisen Growth Corp. The material herein has been obtained from sources believed to be reliable and accurate, however, its accuracy and completeness cannot be guaranteed. Our firm, employees, and customers may effect transactions, including transactions contrary to any recommendation herein, or have positions in the securities mentioned herein or options with respect thereto. Any recommendation contained in this report may not be suitable for all investors and it is not to be deemed an offer or solicitation on our part with respect to the purchase or sale of any securities. |
|
 |
Retail, Bank, and Integrated Oil Indexes Rose
Kenneth J. Gruneisen - Passed the CAN SLIM® Master's Exam
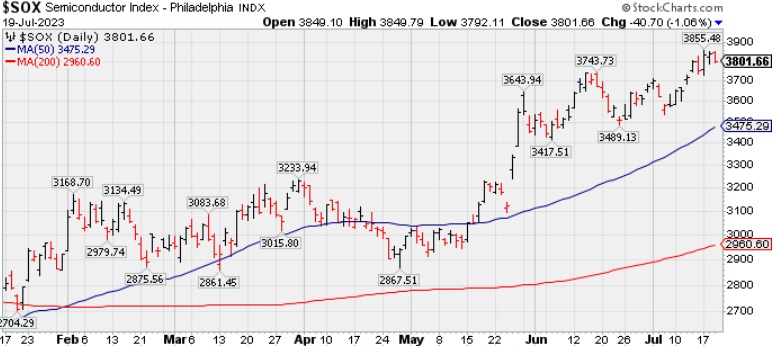
The Bank Index ($BKX +2.62%) outpaced the Broker/Dealer Index ($XBD +0.41%. The Retail Index ($RLX +1.35%) also posted a solid gain. The tech sector was mixed as the Semiconductor Index ($SOX -1.06%) fell while the Networking Index ($NWX +0.52%) and the Biotech Index ($BTK +0.28%) each posted a small gain. The Gold & Silver Index ($XAU +0.07%) and the Oil Services Index ($OSX -0.07%) both were little changed while the Integrated Oil Index ($XOI +0.78%) posted a gain.
PICTURED: The Semiconductor Index ($SOX -1.06%) pulled back from its 2023 high.
| Oil Services |
$OSX |
89.09 |
-0.07 |
-0.07% |
+6.23% |
| Integrated Oil |
$XOI |
1,723.97 |
+13.36 |
+0.78% |
-3.54% |
| Semiconductor |
$SOX |
3,801.66 |
-40.70 |
-1.06% |
+50.14% |
| Networking |
$NWX |
841.40 |
+4.35 |
+0.52% |
+7.42% |
| Broker/Dealer |
$XBD |
507.46 |
+2.05 |
+0.41% |
+12.99% |
| Retail |
$RLX |
3,580.21 |
+47.56 |
+1.35% |
+30.00% |
| Gold & Silver |
$XAU |
129.74 |
+0.09 |
+0.07% |
+7.35% |
| Bank |
$BKX |
87.92 |
+2.25 |
+2.62% |
-12.82% |
| Biotech |
$BTK |
5,386.82 |
+14.86 |
+0.28% |
+2.00% |
|
|
|
 |
Pulled Back From High With Lighter Volume
Kenneth J. Gruneisen - Passed the CAN SLIM® Master's Exam
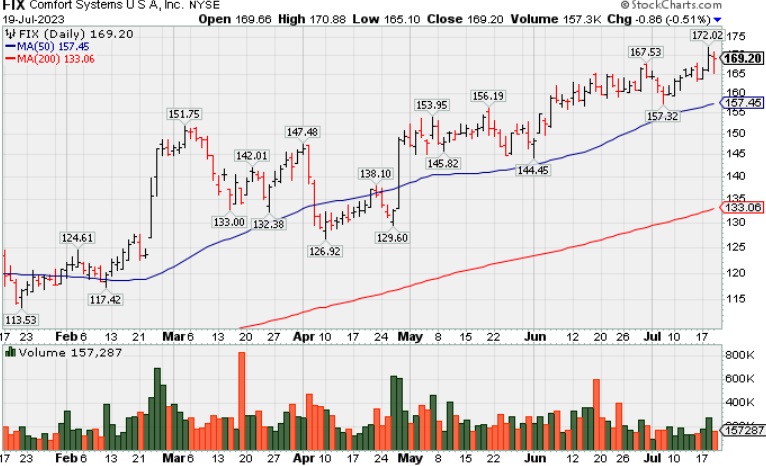
Comfort Systems U S A (FIX -$0.86 to $169.20) pulled back today after a solid gain on the prior session with above-average volume hitting another new all-time high. No resistance remains due to overhead supply. Its 50-day moving average (DMA) line ($157.48) defines important near-term support to watch on pullbacks. Keep in mind it is due to report Jun '23 quarterly results on 7/27/23. Volume and volatility often increase near earnings news.
Its annual earnings history (A criteria) has been strong and steady. It has a 98 Earnings Per Share Rating. Bullish action came after it reported Mar '23 quarterly earnings +66% on +33% sales revenues versus the year-ago period. FIX was highlighted in yellow in the 2/23/23 mid-day report (read here) with a pivot point cited based on its 11/23/22 high plus 10 cents. It was last shown in greater detail on 6/16/23 with an annotated graph under the headline, "'Negative Reversal' Following Recent Volume-Driven Gains".
It hails from the Building - A/C & Heating Products group which is currently ranked 13th on the 197 Industry Groups list. It has a small supply of only 35.8 million shares outstanding (S criteria) which can contribute to greater price volatility in the event of institutional buying or selling. The number of top-rated funds that own its shares rose from 487 in Jun '22 to 622 in Jun '23, a reassuring sign regarding the I criteria.
|
|
|
Color Codes Explained :
Y - Better candidates highlighted by our
staff of experts.
G - Previously featured
in past reports as yellow but may no longer be buyable under the
guidelines.
***Last / Change / Volume data in this table is the closing quote data***
Symbol/Exchange
Company Name
Industry Group |
PRICE |
CHANGE
(%Change) |
Day High |
Volume
(% DAV)
(% 50 day avg vol) |
52 Wk Hi
% From Hi |
Featured
Date |
Price
Featured |
Pivot Featured |
|
Max Buy |
 STRL
-
NASDAQ
STRL
-
NASDAQ
Sterling Infrastructure
Bldg-Heavy Construction
|
$58.66
|
-1.28
-2.14% |
$60.25
|
287,842
92.85% of 50 DAV
50 DAV is 310,000
|
$60.58
-3.17%
|
12/14/2022
|
$32.41
|
PP = $33.72
|
|
MB = $35.41
|
Most Recent Note - 7/18/2023 6:02:57 PM
G - Posted a 4th consecutive gain today hitting a new all-time high, very extended from any sound base. Mar '23 quarterly earnings were below the +25% minimum guideline (C criteria) raising fundamental concerns.
>>> FEATURED STOCK ARTICLE : Streak of Gains Lifts Sterling Infrastructure to New Highs - 7/3/2023 |
View all notes |
Set NEW NOTE alert |
Company Profile |
SEC
News |
Chart |
Request a new note
C
A
S
I |
FIX
-
NYSE
Comfort Systems USA
Bldg-A/C and Heating Prds
|
$169.20
|
-0.86
-0.51% |
$170.88
|
157,287
65.81% of 50 DAV
50 DAV is 239,000
|
$172.02
-1.64%
|
4/27/2023
|
$148.85
|
PP = $152.23
|
|
MB = $159.84
|
 Most Recent Note - 7/19/2023 6:27:35 PM
G - Pulled back today with below-average after hitting a new all-time high on the prior session. No resistance remains due to overhead supply. Its 50 DMA line ($157.48) defines important near-term support to watch on pullbacks. See the latest FSU analysis for more details and a new annotated graph.
>>> FEATURED STOCK ARTICLE : Pulled Back From High With Lighter Volume - 7/19/2023 |
View all notes |
Set NEW NOTE alert |
Company Profile |
SEC
News |
Chart |
Request a new note
C
A
S
I |
KOF
-
NYSE
Coca-Cola Femsa ADR
Beverages-Non-Alcoholic
|
$83.66
|
+0.20
0.24% |
$84.25
|
210,298
123.70% of 50 DAV
50 DAV is 170,000
|
$91.23
-8.30%
|
6/9/2023
|
$88.61
|
PP = $91.33
|
|
MB = $95.90
|
Most Recent Note - 7/13/2023 5:26:07 PM
G - Posted a 3rd consecutive gain today approaching its 50 DMA line following a positive reversal. A rebound above the 50 DMA line ($86.18) is needed for its outlook to improve. Fundamentals remain strong.
>>> FEATURED STOCK ARTICLE : Slumping Below 50-Day Moving Average and Below Prior Low - 7/6/2023 |
View all notes |
Set NEW NOTE alert |
Company Profile |
SEC
News |
Chart |
Request a new note
C
A
S
I |
CLH
-
NYSE
Clean Harbors
Pollution Control
|
$165.54
|
-0.02
-0.01% |
$166.50
|
370,999
98.15% of 50 DAV
50 DAV is 378,000
|
$172.54
-4.06%
|
3/10/2023
|
$136.89
|
PP = $136.74
|
|
MB = $143.58
|
Most Recent Note - 7/18/2023 5:55:58 PM
G - Volume totals have been cooling after a noted "negative reversal" at its all-time high. It is extended from any sound base. Its 50 DMA line ($152.82) defines important near-term support to watch on pullbacks. Fundamentals remain strong. See the latest FSU analysis for more details and a new annotated graph.
>>> FEATURED STOCK ARTICLE : Negative Reversal at High After +26% Rally in 4 Months - 7/18/2023 |
View all notes |
Set NEW NOTE alert |
Company Profile |
SEC
News |
Chart |
Request a new note
C
A
S
I |
SPSC
-
NASDAQ
SPS Commerce
Comp Sftwr-Spec Enterprs
|
$192.71
|
-2.10
-1.08% |
$196.39
|
221,305
115.26% of 50 DAV
50 DAV is 192,000
|
$195.46
-1.41%
|
4/24/2023
|
$150.01
|
PP = $157.56
|
|
MB = $165.44
|
Most Recent Note - 7/18/2023 6:01:40 PM
G - Posted a 6th consecutive gain today, getting very extended from the previously noted base. Due to report Jun '23 quarterly results on 7/27/23.
>>> FEATURED STOCK ARTICLE : Perched Near High Following Noted Volume-Driven Gains - 6/21/2023 |
View all notes |
Set NEW NOTE alert |
Company Profile |
SEC
News |
Chart |
Request a new note
C
A
S
I |
Symbol/Exchange
Company Name
Industry Group |
PRICE |
CHANGE
(%Change) |
Day High |
Volume
(% DAV)
(% 50 day avg vol) |
52 Wk Hi
% From Hi |
Featured
Date |
Price
Featured |
Pivot Featured |
|
Max Buy |
HUBB
-
NYSE
Hubbell
Electrical-Power/Equipmt
|
$337.32
|
+0.01
0.00% |
$337.95
|
279,906
74.44% of 50 DAV
50 DAV is 376,000
|
$337.59
-0.08%
|
4/25/2023
|
$262.85
|
PP = $257.51
|
|
MB = $270.39
|
Most Recent Note - 7/14/2023 12:20:32 PM
G - Still hovering near its all-time high, very extended from the prior base. Its 50 DMA line ($301.72) defines initial support to watch on pullbacks. Fundamentals remain strong.
>>> FEATURED STOCK ARTICLE : Hubbell on Track for 11th Weekly Gain - 6/22/2023 |
View all notes |
Set NEW NOTE alert |
Company Profile |
SEC
News |
Chart |
Request a new note
C
A
S
I |
NVR
-
NYSE
NVR
Bldg-Resident/Comml
|
$6,445.95
|
-20.05
-0.31% |
$6,469.68
|
16,987
73.86% of 50 DAV
50 DAV is 23,000
|
$6,470.87
-0.39%
|
4/25/2023
|
$5,882.18
|
PP = $5,978.25
|
|
MB = $6,277.16
|
Most Recent Note - 7/18/2023 6:00:10 PM
G - Color code is changed to green after posting gains backed by light volume, wedging above its "max buy" level to a new all-time high. Its 50 DMA line ($5,964) defines near-term support watch on pullbacks.
>>> FEATURED STOCK ARTICLE : New High Close for Strong Homebuilder - 6/30/2023 |
View all notes |
Set NEW NOTE alert |
Company Profile |
SEC
News |
Chart |
Request a new note
C
A
S
I |
PHM
-
NYSE
PulteGroup
Bldg-Resident/Comml
|
$81.96
|
-0.06
-0.07% |
$82.19
|
2,433,721
89.90% of 50 DAV
50 DAV is 2,707,000
|
$82.54
-0.70%
|
4/25/2023
|
$65.17
|
PP = $64.01
|
|
MB = $67.21
|
Most Recent Note - 7/14/2023 12:55:01 PM
G - On track for a 6th consecutive gain today with lighter volume. Very extended from any sound base. Reported earnings +28% for the Mar '23 quarter versus the year-ago period. Important support to watch is defined by its 50 DMA line ($72).
>>> FEATURED STOCK ARTICLE : Negative Reversal After Hitting Another New High - 6/26/2023 |
View all notes |
Set NEW NOTE alert |
Company Profile |
SEC
News |
Chart |
Request a new note
C
A
S
I |
AMPH
-
NASDAQ
Amphastar Pharm
Medical-Biomed/Biotech
|
$62.33
|
+1.26
2.06% |
$63.72
|
564,092
121.83% of 50 DAV
50 DAV is 463,000
|
$63.17
-1.33%
|
5/15/2023
|
$43.56
|
PP = $44.15
|
|
MB = $46.36
|
Most Recent Note - 7/18/2023 1:06:15 PM
G - Powering to a new all-time high with today's gap up and big 4th consecutive gain backed by above average volume. It did not form a sound base of sufficient length. Its 50 DMA line ($49.23) defines important support to watch above prior highs in the $44 area. Fundamentals remain strong.
>>> FEATURED STOCK ARTICLE : Hit Another New High With 4th Consecutive Volume-Driven Gain - 6/20/2023 |
View all notes |
Set NEW NOTE alert |
Company Profile |
SEC
News |
Chart |
Request a new note
C
A
S
I |
ANET
-
NYSE
Arista Networks
Computer-Networking
|
$176.26
|
+2.75
1.58% |
$176.66
|
2,405,180
75.37% of 50 DAV
50 DAV is 3,191,000
|
$178.36
-1.18%
|
5/30/2023
|
$176.35
|
PP = $171.54
|
|
MB = $180.12
|
Most Recent Note - 7/17/2023 5:49:16 PM
G - Posted a gain today with below-average volume, approaching prior highs. It faces little near-term resistance due to overhead supply up to the $178 level. Fundamentals remain strong. Its 50 DMA line ($154) defines near-term support above the prior low ($148.32).
>>> FEATURED STOCK ARTICLE : Wedging Higher After Rebounding Above 50-Day Moving Average - 7/12/2023 |
View all notes |
Set NEW NOTE alert |
Company Profile |
SEC
News |
Chart |
Request a new note
C
A
S
I |
Symbol/Exchange
Company Name
Industry Group |
PRICE |
CHANGE
(%Change) |
Day High |
Volume
(% DAV)
(% 50 day avg vol) |
52 Wk Hi
% From Hi |
Featured
Date |
Price
Featured |
Pivot Featured |
|
Max Buy |
PANW
-
NASDAQ
Palo Alto Networks
Computer Sftwr-Security
|
$246.00
|
-2.34
-0.94% |
$250.25
|
3,219,988
48.34% of 50 DAV
50 DAV is 6,661,000
|
$258.88
-4.98%
|
6/5/2023
|
$228.35
|
PP = $213.73
|
|
MB = $224.42
|
Most Recent Note - 7/17/2023 5:52:38 PM
G - Posted a 3rd gain today with lighter volume and it remains perched near its all-time high. Its 50 DMA line ($223.48) and prior high ($213) define near-term support to watch. Fundamentals remain strong.
>>> FEATURED STOCK ARTICLE : Strength Continues for Network Security Leader - 6/27/2023 |
View all notes |
Set NEW NOTE alert |
Company Profile |
SEC
News |
Chart |
Request a new note
C
A
S
I |
LSCC
-
NASDAQ
Lattice Semiconductor
Elec-Semicondctor Fablss
|
$93.28
|
-3.51
-3.63% |
$97.48
|
1,512,880
64.79% of 50 DAV
50 DAV is 2,335,000
|
$98.18
-4.99%
|
6/13/2023
|
$91.73
|
PP = $96.92
|
|
MB = $101.77
|
Most Recent Note - 7/19/2023 6:30:08 PM
Y - Pulled back today with below average volume. It is perched within close striking distance of its 52-week high and pivot point. Its 50 DMA line ($86.87) defines near-term support to watch. Subsequent gains above the pivot point backed by at least +40% above average volume may trigger a technical buy signal. Due to report Jun '23 quarterly results on 7/31/23.
>>> FEATURED STOCK ARTICLE : Perched Near Pivot Point After Best-Ever Close - 7/17/2023 |
View all notes |
Set NEW NOTE alert |
Company Profile |
SEC
News |
Chart |
Request a new note
C
A
S
I |
XPEL
-
NASDAQ
XPEL
Auto/Truck-Replace Parts
|
$82.55
|
-0.14
-0.17% |
$83.15
|
79,448
58.85% of 50 DAV
50 DAV is 135,000
|
$87.46
-5.61%
|
6/28/2023
|
$83.14
|
PP = $87.11
|
|
MB = $91.47
|
Most Recent Note - 7/13/2023 5:28:26 PM
Y - Pulled back today with below-average volume. Perched near the pivot point cited based on its 8/15/23 high plus 10 cents. Within close striking distance of its 52-week high after an orderly 10-month base. Reported Mar '23 quarterly earnings +46% on +19% sales revenues versus the year ago period, its 3rd quarterly comparison above the +25% minimum earnings guideline (C criteria), helping it better match the winning models of the fact-based investment system.
>>> FEATURED STOCK ARTICLE : XPEL Returns to Featured Stocks List After Long Consolidation - 6/28/2023 |
View all notes |
Set NEW NOTE alert |
Company Profile |
SEC
News |
Chart |
Request a new note
C
A
S
I |
FTNT
-
NASDAQ
Fortinet
Computer Sftwr-Security
|
$78.69
|
-1.55
-1.93% |
$81.24
|
5,980,568
110.28% of 50 DAV
50 DAV is 5,423,000
|
$80.60
-2.37%
|
7/10/2023
|
$78.29
|
PP = $74.45
|
|
MB = $78.17
|
Most Recent Note - 7/18/2023 6:06:41 PM
G - Color code is changed to green after rising above its "max buy" level. It is perched at its all-time high, stubbornly holding its ground after recent gains. Fundamentals remain strong.
>>> FEATURED STOCK ARTICLE : Fortinet Powered to New All-Time High - 7/10/2023 |
View all notes |
Set NEW NOTE alert |
Company Profile |
SEC
News |
Chart |
Request a new note
C
A
S
I |
PII
-
NYSE
Polaris
Leisure-Products
|
$135.35
|
+3.25
2.46% |
$135.83
|
926,587
173.52% of 50 DAV
50 DAV is 534,000
|
$132.72
1.98%
|
7/11/2023
|
$126.92
|
PP = $123.97
|
|
MB = $130.17
|
Most Recent Note - 7/18/2023 6:09:18 PM
G - Color code is changed to green after rallying above its "max buy" level with today's volume-driven gain adding to a recent spurt higher. On pullbacks, the prior highs define initial support to watch above its 50 DMA line.
>>> FEATURED STOCK ARTICLE : Volume-Driven Breakout for Polaris - 7/11/2023 |
View all notes |
Set NEW NOTE alert |
Company Profile |
SEC
News |
Chart |
Request a new note
C
A
S
I |
Symbol/Exchange
Company Name
Industry Group |
PRICE |
CHANGE
(%Change) |
Day High |
Volume
(% DAV)
(% 50 day avg vol) |
52 Wk Hi
% From Hi |
Featured
Date |
Price
Featured |
Pivot Featured |
|
Max Buy |
ALGM
-
NASDAQ
Allegro MicroSystems
Elec-Semicondctor Fablss
|
$52.17
|
-0.55
-1.04% |
$53.05
|
1,474,559
100.17% of 50 DAV
50 DAV is 1,472,000
|
$52.85
-1.29%
|
7/13/2023
|
$49.86
|
PP = $48.82
|
|
MB = $51.26
|
Most Recent Note - 7/17/2023 5:46:31 PM
Y - Posted a gain with average volume for a best-ever close. It was highlighted in yellow with pivot point cited based on its 4/03/23 high plus 10 cents in the 7/13/23 mid-day report.
>>> FEATURED STOCK ARTICLE : Volume Heavy Behind Considerable Breakout Gain - 7/13/2023 |
View all notes |
Set NEW NOTE alert |
Company Profile |
SEC
News |
Chart |
Request a new note
C
A
S
I |
ESQ
-
NASDAQ
Esquire Finl Hldgs
Finance-Commercial Loans
|
$48.26
|
-0.33
-0.68% |
$49.24
|
33,278
107.35% of 50 DAV
50 DAV is 31,000
|
$48.63
-0.76%
|
7/14/2023
|
$45.80
|
PP = $48.23
|
|
MB = $50.64
|
Most Recent Note - 7/17/2023 5:50:43 PM
Y - Posted a volume-driven gain today challenging its 52-week high. Subsequent gains above the pivot point backed by at least +40% above average volume are needed to trigger a proper technical buy signal.
>>> FEATURED STOCK ARTICLE : Esquire Perched Near Prior Highs - 7/14/2023 |
View all notes |
Set NEW NOTE alert |
Company Profile |
SEC
News |
Chart |
Request a new note
C
A
S
I |
|
|
|
THESE ARE NOT BUY RECOMMENDATIONS!
Comments contained in the body of this report are technical
opinions only. The material herein has been obtained
from sources believed to be reliable and accurate, however,
its accuracy and completeness cannot be guaranteed.
This site is not an investment advisor, hence it does
not endorse or recommend any securities or other investments.
Any recommendation contained in this report may not
be suitable for all investors and it is not to be deemed
an offer or solicitation on our part with respect to
the purchase or sale of any securities. All trademarks,
service marks and trade names appearing in this report
are the property of their respective owners, and are
likewise used for identification purposes only.
This report is a service available
only to active Paid Premium Members.
You may opt-out of receiving report notifications
at any time. Questions or comments may be submitted
by writing to Premium Membership Services 665 S.E. 10 Street, Suite 201 Deerfield Beach, FL 33441-5634 or by calling 1-800-965-8307
or 954-785-1121.
|
|
|