You are not logged in.
This means you
CAN ONLY VIEW reports that were published prior to Saturday, April 19, 2025.
You
MUST UPGRADE YOUR MEMBERSHIP if you want to see any current reports.
AFTER MARKET UPDATE - THURSDAY, JULY 20TH, 2023
Previous After Market Report Next After Market Report >>>
|
|
|
|
DOW |
+163.97 |
35,225.18 |
+0.47% |
|
Volume |
827,207,969 |
-8% |
|
Volume |
5,155,855,900 |
-1% |
|
NASDAQ |
-294.71 |
14,063.31 |
-2.05% |
|
Advancers |
1,166 |
41% |
|
Advancers |
1,516 |
34% |
|
S&P 500 |
-30.85 |
4,534.87 |
-0.68% |
|
Decliners |
1,661 |
59% |
|
Decliners |
2,899 |
66% |
|
Russell 2000 |
-17.73 |
1,967.16 |
-0.89% |
|
52 Wk Highs |
92 |
|
|
52 Wk Highs |
88 |
|
|
S&P 600 |
-10.02 |
1,260.97 |
-0.79% |
|
52 Wk Lows |
10 |
|
|
52 Wk Lows |
75 |
|
|
 |
Nasdaq Composite Fell as Dow Industrials Posted 9th Straight Gain
Kenneth J. Gruneisen - Passed the CAN SLIM® Master's Exam
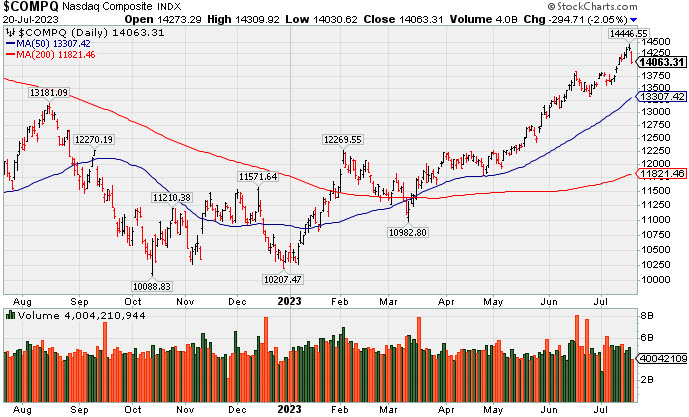
The Nasdaq Composite Index fell -2.05% while there was a -0.7% decline for the market-cap weighted S&P 500 Index. The Dow Jones Industrial Average (+0.47%), meanwhile, logged its ninth consecutive winning session. The volume totals reported were lighter on the NYSE and on the Nasdaq exchange versus the prior session. Breadth was negative as decliners led advancers by a 4-3 margin on the NYSE and by almost a 2-1 margin on the Nasdaq exchange. Leadership thinned as there were 55 high-ranked companies from the Leaders List that hit a new 52-week high and were listed on the BreakOuts Page, versus the total of 100 on the prior session. New 52-week highs solidly outnumbered new 52-week lows on the NYSE, but new highs held only a narrow lead over new lows and on the Nasdaq exchange. The major indices are in a confirmed uptrend (M criteria). Appropriate new buying efforts may be considered under the fact-based investment system.
PICTURED: The Nasdaq Composite Index pulled back. It is up +34.4% year-to-date.
Weekly initial jobless claims came in at the lowest level (228,000) since Mid-May. The Dow was boosted by gains in Johnson & Johnson (JNJ +6.1%), IBM (IBM +2.1%), and Travelers (TRV +1.8%) following their earnings reports. Tesla (TSLA -9.7%) and Netflix (NLFX -8.4%) both fell following their better than expected Q2 earnings results. Taiwan Semiconductor Manufacturing Co. (TSM -5.1%) also fell after cautioning about a continued inventory adjustment. The PHLX Semiconductor Index (SOX) declined 3.6%. Amazon.com (AMZN -4.0%) also slumped and created pressure on the S&P 500 consumer discretionary sector (-3.4%). Weak homebuilders included D.R. Horton (DHI -1.9%) which had a "negative reversal" and was a notable loser after reporting above-consensus earnings. The utilities (+1.9%) and health care (+1.7%) sectors, meanwhile, were top gainers .
The 2-yr note yield rose nine basis points to 4.84% and the 10-yr note yield rose 11 basis points to 3.85%.
|
 Kenneth J. Gruneisen started out as a licensed stockbroker in August 1987, a couple of months prior to the historic stock market crash that took the Dow Jones Industrial Average down -22.6% in a single day. He has published daily fact-based fundamental and technical analysis on high-ranked stocks online for two decades. Through FACTBASEDINVESTING.COM, Kenneth provides educational articles, news, market commentary, and other information regarding proven investment systems that work in good times and bad.
Comments contained in the body of this report are technical opinions only and are not necessarily those of Gruneisen Growth Corp. The material herein has been obtained from sources believed to be reliable and accurate, however, its accuracy and completeness cannot be guaranteed. Our firm, employees, and customers may effect transactions, including transactions contrary to any recommendation herein, or have positions in the securities mentioned herein or options with respect thereto. Any recommendation contained in this report may not be suitable for all investors and it is not to be deemed an offer or solicitation on our part with respect to the purchase or sale of any securities. |
|
 |
Retail, Semiconductor, and Gold & Silver Indexes Led Decliners
Kenneth J. Gruneisen - Passed the CAN SLIM® Master's Exam
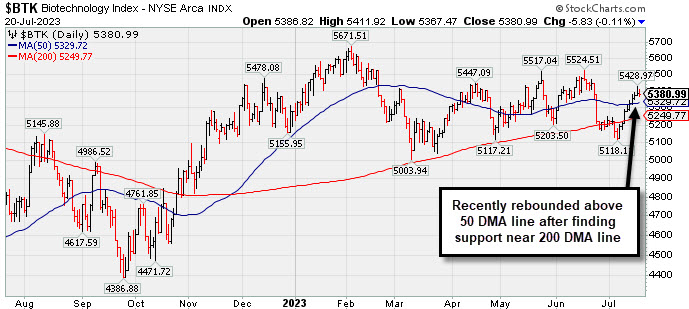
The Bank Index ($BKX +0.69%) and the Broker/Dealer Index ($XBD +1.01% both posted gains while the Retail Index ($RLX -2.56%) suffered a larger loss. The tech sector was led lower by the Semiconductor Index ($SOX -3.62%) while the Networking Index ($NWX -0.91%) suffered a smaller loss and the Biotech Index ($BTK -0.11%) ended slightly in the red. Commodity-linked groups were mixed as the Gold & Silver Index ($XAU -2.34%) slumped while the Oil Services Index ($OSX +0.24%) inched higher and the Integrated Oil Index ($XOI +1.36%) posted a larger gain.
PICTURED: The Biotech Index ($BTK -0.11%) pulled back after a streak of 8 consecutive gains while rebounding above its 200-day and 50-day moving average (DMA) lines.
| Oil Services |
$OSX |
89.30 |
+0.21 |
+0.24% |
+6.48% |
| Integrated Oil |
$XOI |
1,747.45 |
+23.48 |
+1.36% |
-2.23% |
| Semiconductor |
$SOX |
3,663.85 |
-137.81 |
-3.62% |
+44.70% |
| Networking |
$NWX |
833.78 |
-7.62 |
-0.91% |
+6.44% |
| Broker/Dealer |
$XBD |
512.60 |
+5.14 |
+1.01% |
+14.13% |
| Retail |
$RLX |
3,488.58 |
-91.63 |
-2.56% |
+26.67% |
| Gold & Silver |
$XAU |
126.71 |
-3.03 |
-2.34% |
+4.84% |
| Bank |
$BKX |
88.53 |
+0.61 |
+0.69% |
-12.22% |
| Biotech |
$BTK |
5,380.99 |
-5.84 |
-0.11% |
+1.89% |
|
|
|
 |
6th Straight Gain for Amphastar
Kenneth J. Gruneisen - Passed the CAN SLIM® Master's Exam
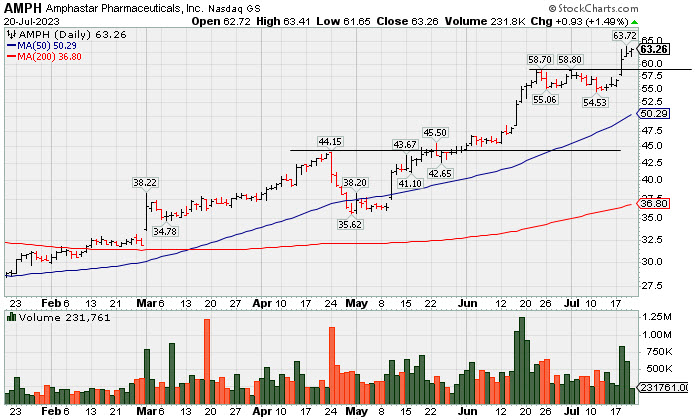
Amphastar Pharm (AMPH +$0.92 or +1.48% to $63.25) is perched at its all-time high today following 6 consecutive gains. It is extended from any sound base of sufficient length. Its 50-day moving average (DMA) line ($50.28) defines important support to watch above prior highs in the $44 area. Fundamentals remain strong.
It hails from the Medical-Biomed/Biotech group which is currently ranked 59th on the 197 Industry Groyups list (L cvriteria). It has a 99 Earnings Per Share Rating, well above the 80+ minimum guideline for buy candidates. Three of the 4 latest quarterly comparisons through Mar '23 versus the year-ago periods have been strong and well above the +25% minimum earnings guideline (C criteria). Annual earnings history (A criteria) has been strong.
The number of top-rated funds owning its shares reported fell from 454 in Jun '22 to 429 in Jun '23, not a reassuring sign concerning the I criteria. Its current Up/Down Volume Ratio of 2.5, however, is an unbiased indication its shares have been under accumulation over the past 50 days.
|
|
|
Color Codes Explained :
Y - Better candidates highlighted by our
staff of experts.
G - Previously featured
in past reports as yellow but may no longer be buyable under the
guidelines.
***Last / Change / Volume data in this table is the closing quote data***
|
|
|
THESE ARE NOT BUY RECOMMENDATIONS!
Comments contained in the body of this report are technical
opinions only. The material herein has been obtained
from sources believed to be reliable and accurate, however,
its accuracy and completeness cannot be guaranteed.
This site is not an investment advisor, hence it does
not endorse or recommend any securities or other investments.
Any recommendation contained in this report may not
be suitable for all investors and it is not to be deemed
an offer or solicitation on our part with respect to
the purchase or sale of any securities. All trademarks,
service marks and trade names appearing in this report
are the property of their respective owners, and are
likewise used for identification purposes only.
This report is a service available
only to active Paid Premium Members.
You may opt-out of receiving report notifications
at any time. Questions or comments may be submitted
by writing to Premium Membership Services 665 S.E. 10 Street, Suite 201 Deerfield Beach, FL 33441-5634 or by calling 1-800-965-8307
or 954-785-1121.
|
|
|