You are not logged in.
This means you
CAN ONLY VIEW reports that were published prior to Thursday, March 13, 2025.
You
MUST UPGRADE YOUR MEMBERSHIP if you want to see any current reports.
AFTER MARKET UPDATE - TUESDAY, JUNE 20TH, 2023
Previous After Market Report Next After Market Report >>>
|
|
|
|
DOW |
-245.25 |
34,053.87 |
-0.72% |
|
Volume |
1,033,116,994 |
-66% |
|
Volume |
5,268,557,300 |
-36% |
|
NASDAQ |
-22.28 |
13,667.29 |
-0.16% |
|
Advancers |
925 |
32% |
|
Advancers |
1,643 |
36% |
|
S&P 500 |
-20.88 |
4,388.71 |
-0.47% |
|
Decliners |
1,987 |
68% |
|
Decliners |
2,884 |
64% |
|
Russell 2000 |
-8.77 |
1,866.70 |
-0.47% |
|
52 Wk Highs |
62 |
|
|
52 Wk Highs |
93 |
|
|
S&P 600 |
-5.20 |
1,199.60 |
-0.43% |
|
52 Wk Lows |
18 |
|
|
52 Wk Lows |
100 |
|
|
 |
Major Indices Edged Lower With Lighter Volume Totals
Kenneth J. Gruneisen - Passed the CAN SLIM® Master's Exam
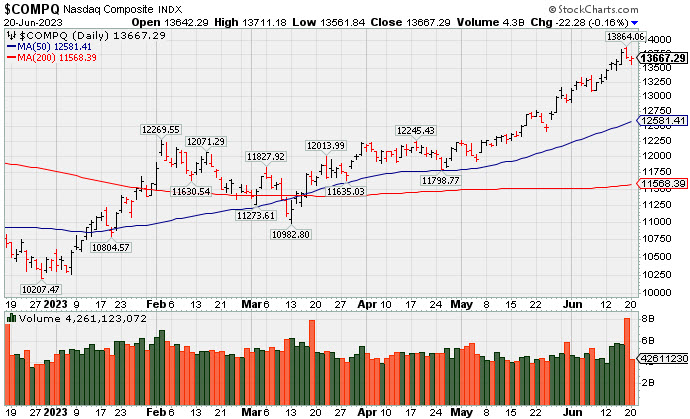
The Dow fell 245 points (-0.7%) and the S&P 500 slid -0.5%, meanwhile the Nasdaq Composite dipped only -0.2%. Volume totals reported were lighter on the NYSE and on the Nasdaq exchange versus the prior session, down from Friday's totals which were inflated by options expirations. Breadth was negative with decliners leading advancers by a 2-1 margin on the NYSE and 7-4 on the Nasdaq exchange. There were 38 high-ranked companies from the Leaders List that hit a new 52-week high and were listed on the BreakOuts Page, versus the total of 87 on the prior session. New 52-week highs totals contracted but still outnumbered new 52-week lows on the NYSE, but new lows outnumbered new highs on the Nasdaq exchange. The major indices are in a confirmed uptrend (M criteria). Appropriate new buying efforts may be considered under the fact-based investment system.
PICTURED: The Nasdaq Composite Index ended lower for a 2nd consecutive session, retreating from its 2023 high.
Ten of 11 sectors ended lower as U.S. equities fell on Tuesday. Sentiment cooled surrounding the recent rally and as investors digested continued hawkish signals from the Federal Reserve (Fed). The Energy sector led the laggards, down 2.3%.
Treasuries strengthened today after better-than-expected housing market data was released. Investors also await Fed Chair Jerome Powell’s semi-annual report to Congress that begins tomorrow. The yield on the 10-year note was down five basis points (0.05%) to 3.72%, and the 30-year bond yield dipped four basis points (0.04%) to 3.81%. Meanwhile, the yield on the two-year note, which is more sensitive to changes in monetary policy, declined four basis points (0.04%) to 4.68%.
On the data front today, both housing starts and building permits data beat expectations. Housing starts rose by the fastest monthly pace since 2016, surging 21.7% month-over-month in May to an annualized rate of 1.63 million, outpacing expectations for a 0.1% decline. Meanwhile, building permits climbed 5.2% month-over-month in May to an annualized rate of 1.49 million.
In commodities, West Texas Intermediate (WTI) crude fell 1.8% to $70.50/barrel as demand concerns brought on by softness in economic data continue to plague the oil market. Gold prices declined 1.1% to $1936.60/ounce amid today’s dollar strength.
|
 Kenneth J. Gruneisen started out as a licensed stockbroker in August 1987, a couple of months prior to the historic stock market crash that took the Dow Jones Industrial Average down -22.6% in a single day. He has published daily fact-based fundamental and technical analysis on high-ranked stocks online for two decades. Through FACTBASEDINVESTING.COM, Kenneth provides educational articles, news, market commentary, and other information regarding proven investment systems that work in good times and bad.
Comments contained in the body of this report are technical opinions only and are not necessarily those of Gruneisen Growth Corp. The material herein has been obtained from sources believed to be reliable and accurate, however, its accuracy and completeness cannot be guaranteed. Our firm, employees, and customers may effect transactions, including transactions contrary to any recommendation herein, or have positions in the securities mentioned herein or options with respect thereto. Any recommendation contained in this report may not be suitable for all investors and it is not to be deemed an offer or solicitation on our part with respect to the purchase or sale of any securities. |
|
 |
Financial, Tech, and Commodity-Linked Groups Sank
Kenneth J. Gruneisen - Passed the CAN SLIM® Master's Exam
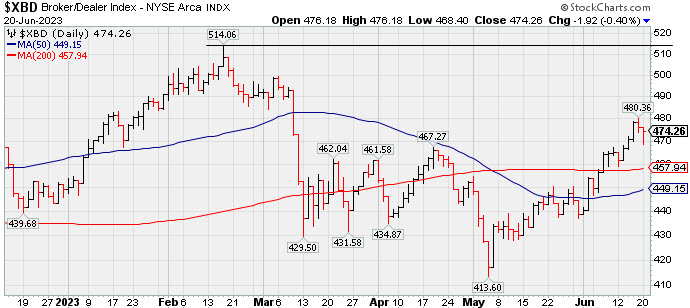
The Bank ($BKX -1.42%) and Broker/Dealer ($XBD -1.25%) both lost ground while the Retail ($RLX -0.13%) suffered a smaller loss. The Semiconductor ($SOX -1.21%), Biotech ($BTK -0.96%) and the Networking ($NWX -1.45%) each lost ground. The Gold & Silver ($XAU -3.53%) was a standout decliner while the Integrated Oil ($XOI -2.57%) and the Oil Services ($OSX -2.66%) also lost ground.
PICTURED: The Broker/Dealer ($XBD -1.25%) finished a 2nd consecutive session lower but recently has been making progress above its 50-day and 200-day moving average (DMA) lines.
| Oil Services |
$OSX |
74.96 |
-2.05 |
-2.66% |
-10.62% |
| Integrated Oil |
$XOI |
1,623.62 |
-42.78 |
-2.57% |
-9.16% |
| Semiconductor |
$SOX |
3,628.70 |
-44.45 |
-1.21% |
+43.31% |
| Networking |
$NWX |
829.49 |
-12.22 |
-1.45% |
+5.90% |
| Broker/Dealer |
$XBD |
470.25 |
-5.93 |
-1.25% |
+4.70% |
| Retail |
$RLX |
3,351.03 |
-4.27 |
-0.13% |
+21.68% |
| Gold & Silver |
$XAU |
119.87 |
-4.38 |
-3.53% |
-0.82% |
| Bank |
$BKX |
80.49 |
-1.16 |
-1.42% |
-20.19% |
| Biotech |
$BTK |
5,416.49 |
-52.36 |
-0.96% |
+2.56% |
|
|
|
 |
Hit Another New High With 4th Consecutive Volume-Driven Gain
Kenneth J. Gruneisen - Passed the CAN SLIM® Master's Exam
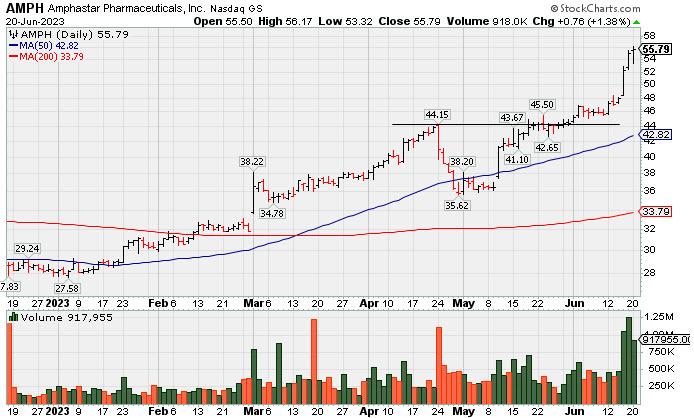
Amphastar Pharm (AMPH +$0.76 or +1.38% to $55.79) hit yet another new high with today's 4th consecutive gain backed by above average volume, getting very extended from any sound base. Prior highs in the $44 area define initial support to watch above its 50-day moving average (DMA) line ($42.82) on pullbacks. Fundamentals remain strong.
AMPH was highlighted in yellow with pivot point cited based on its 4/24/23 high in the 5/15/23 mid-day report (read here) and it was coverned in greater detail that evening with an annotated graph under then headline "Weak Finish After Early Gain When Perched Near All-Time High". It slumped below its 50 DMA line with a streak of volume-driven losses but then halted its slide. A gap up and considerable volume-driven gain on 5/10/23 helped its outlook improve, then additional volume-driven gains repaired all technical damage and boosted it into new high territory.
It hails from the Medical-Biomed/Biotech group which is currently ranked 15th on the 197 Industry Groyups list (L cvriteria). It has a 99 Earnings Per Share Rating, well above the 80+ minimum guideline for buy candidates. Three of the 4 latest quarterly comparisons through Mar '23 versus the year-ago periods have been strong and well above the +25% minimum earnings guideline (C criteria). Annual earnings history (A criteria) has been strong.
The number of top-rated funds owning its shares reported fell from 454 in Jun '22 to 435 in Mar '23, not a reassuring sign concerning the I criteria. Its current Up/Down Volume Ratio of 1.6, however, is an unbiased indication its shares have been under accumulation over the past 50 days.
|
|
|
Color Codes Explained :
Y - Better candidates highlighted by our
staff of experts.
G - Previously featured
in past reports as yellow but may no longer be buyable under the
guidelines.
***Last / Change / Volume data in this table is the closing quote data***
Symbol/Exchange
Company Name
Industry Group |
PRICE |
CHANGE
(%Change) |
Day High |
Volume
(% DAV)
(% 50 day avg vol) |
52 Wk Hi
% From Hi |
Featured
Date |
Price
Featured |
Pivot Featured |
|
Max Buy |
 GPK
-
NYSE
GPK
-
NYSE
Graphic Packaging
Paper and Paper Products
|
$24.66
|
-1.35
-5.19% |
$25.55
|
7,775,463
189.23% of 50 DAV
50 DAV is 4,109,000
|
$27.56
-10.52%
|
10/25/2022
|
$22.75
|
PP = $24.17
|
|
MB = $25.38
|
 Most Recent Note - 6/20/2023 12:21:55 PM
G - Slumping below its 50 DMA line ($25.28) raising concerns with today's 4th volume-driven loss in the span of 5 sessions following a noted "negative reversal" on 6/13/23. Only a prompt rebound above the 50 DMA line would help its outlook improve. It was repeatedly noted - "It did not form a sound new base of sufficient length but quickly recovered after testing its 4/27/23 low. Reported Mar '23 quarterly earnings +60% on +9% sales revenues versus the year-ago period."
>>> FEATURED STOCK ARTICLE : Graphic Packaging Hits New High With 6th Consecutive Gain - 6/8/2023 |
View all notes |
Set NEW NOTE alert |
Company Profile |
SEC
News |
Chart |
Request a new note
C
A
S
I |
STRL
-
NASDAQ
Sterling Infrastructure
Bldg-Heavy Construction
|
$52.61
|
+0.75
1.45% |
$53.00
|
212,344
80.43% of 50 DAV
50 DAV is 264,000
|
$54.44
-3.36%
|
12/14/2022
|
$32.41
|
PP = $33.72
|
|
MB = $35.41
|
Most Recent Note - 6/16/2023 5:52:45 PM
G - Pulled back from its all-time high with today's volume-driven loss. It is very extended from any sound base. Mar '23 quarterly earnings were below the +25% minimum guideline (C criteria) raising fundamental concerns.
>>> FEATURED STOCK ARTICLE : Impressive Streak of Gains for New Highs - 6/7/2023 |
View all notes |
Set NEW NOTE alert |
Company Profile |
SEC
News |
Chart |
Request a new note
C
A
S
I |
FIX
-
NYSE
Comfort Systems USA
Bldg-A/C and Heating Prds
|
$159.70
|
-1.88
-1.16% |
$162.10
|
234,821
84.47% of 50 DAV
50 DAV is 278,000
|
$165.05
-3.24%
|
4/27/2023
|
$148.85
|
PP = $152.23
|
|
MB = $159.84
|
Most Recent Note - 6/16/2023 5:48:49 PM
G - After touching a new all-time high, there was a "negative reversal" today. It is extended from the prior base and no resistance remains due to overhead supply. Prior highs in the $152-156 area define initial support to watch on pullbacks. See the latest FSU analysis for more details and a new annotated graph.
>>> FEATURED STOCK ARTICLE : "Negative Reversal" Following Recent Volume-Driven Gains - 6/16/2023 |
View all notes |
Set NEW NOTE alert |
Company Profile |
SEC
News |
Chart |
Request a new note
C
A
S
I |
KOF
-
NYSE
Coca-Cola Femsa ADR
Beverages-Non-Alcoholic
|
$87.79
|
-0.35
-0.40% |
$89.01
|
105,845
59.13% of 50 DAV
50 DAV is 179,000
|
$91.23
-3.77%
|
6/9/2023
|
$88.61
|
PP = $91.33
|
|
MB = $95.90
|
Most Recent Note - 6/20/2023 5:42:55 PM
Y - Volume totals have been cooling while stubbornly holding its ground perched within striking distance of its 52-week high. Found support near its 50 DMA line ($86) during its recent consolidation. Subsequent gains above the pivot point backed by at least +40% above average volume may trigger a technical buy signal. Fundamentals remain strong.
>>> FEATURED STOCK ARTICLE : Coca-Cola Femsa Posts 7th Consecutive Gain - 6/9/2023 |
View all notes |
Set NEW NOTE alert |
Company Profile |
SEC
News |
Chart |
Request a new note
C
A
S
I |
CLH
-
NYSE
Clean Harbors
Pollution Control
|
$158.19
|
+1.52
0.97% |
$159.19
|
417,531
109.30% of 50 DAV
50 DAV is 382,000
|
$158.72
-0.33%
|
3/10/2023
|
$136.89
|
PP = $136.74
|
|
MB = $143.58
|
Most Recent Note - 6/20/2023 5:44:32 PM
G - Hit another new all-time high today, and it is very extended from any sound base. Its 50 DMA line ($145) defines near-term support to watch on pullbacks. Fundamentals remain strong.
>>> FEATURED STOCK ARTICLE : Extended From Any Sound Base and Hovering Near High - 6/15/2023 |
View all notes |
Set NEW NOTE alert |
Company Profile |
SEC
News |
Chart |
Request a new note
C
A
S
I |
Symbol/Exchange
Company Name
Industry Group |
PRICE |
CHANGE
(%Change) |
Day High |
Volume
(% DAV)
(% 50 day avg vol) |
52 Wk Hi
% From Hi |
Featured
Date |
Price
Featured |
Pivot Featured |
|
Max Buy |
SPSC
-
NASDAQ
SPS Commerce
Comp Sftwr-Spec Enterprs
|
$182.84
|
-1.86
-1.01% |
$185.99
|
224,701
136.18% of 50 DAV
50 DAV is 165,000
|
$185.88
-1.64%
|
4/24/2023
|
$150.01
|
PP = $157.56
|
|
MB = $165.44
|
Most Recent Note - 6/16/2023 1:19:13 PM
G - Hit yet another new 52-week high today while adding to an imrepssive streak of gains, getting very extended from any sound base. Reported Mar '23 quarterly earnings +22% on +20% versus the year-ago period, below the +25% minimum earnings guideline (C criteria) raising some fundamental concerns.
>>> FEATURED STOCK ARTICLE : Pulled Back After Quietly Wedging to New Highs - 5/31/2023 |
View all notes |
Set NEW NOTE alert |
Company Profile |
SEC
News |
Chart |
Request a new note
C
A
S
I |
HUBB
-
NYSE
Hubbell
Electrical-Power/Equipmt
|
$321.06
|
+0.68
0.21% |
$322.14
|
348,348
85.38% of 50 DAV
50 DAV is 408,000
|
$322.89
-0.57%
|
4/25/2023
|
$262.85
|
PP = $257.51
|
|
MB = $270.39
|
Most Recent Note - 6/20/2023 5:36:14 PM
G - Posted a gain today with below-average volume for a best-ever close. Very extended from the prior base. Prior highs in the $263 area define initial support to watch on pullbacks. Fundamentals remain strong.
>>> FEATURED STOCK ARTICLE : Extended From Prior Base and Perched Near High - 6/1/2023 |
View all notes |
Set NEW NOTE alert |
Company Profile |
SEC
News |
Chart |
Request a new note
C
A
S
I |
NVR
-
NYSE
NVR
Bldg-Resident/Comml
|
$5,982.43
|
-7.95
-0.13% |
$6,079.06
|
28,082
117.01% of 50 DAV
50 DAV is 24,000
|
$6,000.00
-0.29%
|
4/25/2023
|
$5,882.18
|
PP = $5,978.25
|
|
MB = $6,277.16
|
Most Recent Note - 6/20/2023 5:40:52 PM
G - There was a "negative reversal" today after hitting a new all-time high, ending near the session low with a loss backed by +17% above-average volume. Its 50 DMA line ($5,781) defines near-term support above the recent low ($5,520 on 6/01/23). Reported Mar '23 quarterly earnings -14% on -3% sales revenues versus the year-ago period, below the +25% minimum earnings guideline (C criteria) raising fundamental concerns, and its color code was changed to green. Prior quarterly comparisons were well above the +25% minimum earnings guideline (C criteria). Annual earnings (A criteria) growth has been very strong.
>>> FEATURED STOCK ARTICLE : Rebounded Above 50 Day Average With Light Volume Gains - 6/6/2023 |
View all notes |
Set NEW NOTE alert |
Company Profile |
SEC
News |
Chart |
Request a new note
C
A
S
I |
PHM
-
NYSE
PulteGroup
Bldg-Resident/Comml
|
$74.88
|
+1.37
1.86% |
$75.18
|
2,266,854
74.52% of 50 DAV
50 DAV is 3,042,000
|
$74.81
0.09%
|
4/25/2023
|
$65.17
|
PP = $64.01
|
|
MB = $67.21
|
Most Recent Note - 6/20/2023 5:34:36 PM
G - Hit yet another new high with today's gain backed by below-average volume, getting more extended from any sound base. Reported earnings +28% for the Mar '23 quarter versus the year-ago period. Important support to watch is defined by its 50 DMA line ($67.06) and recent low.
>>> FEATURED STOCK ARTICLE : Rebounded Above "Max Buy" Level Toward Recent High - 6/2/2023 |
View all notes |
Set NEW NOTE alert |
Company Profile |
SEC
News |
Chart |
Request a new note
C
A
S
I |
COKE
-
NASDAQ
Coca-Cola Consolidated
Beverages-Non-Alcoholic
|
$653.66
|
-2.82
-0.43% |
$663.00
|
40,936
110.64% of 50 DAV
50 DAV is 37,000
|
$694.20
-5.84%
|
5/4/2023
|
$646.66
|
PP = $656.21
|
|
MB = $689.02
|
Most Recent Note - 6/16/2023 5:51:36 PM
Y - Managed a "positive reversal" today for a volume-driven gain. Recent lows in the $625 area define important near-term support above its 50 DMA line ($618). Fundamentals remain strong. See the latest FSU analysis for more details and an annotated graph.
>>> FEATURED STOCK ARTICLE : Fell Below Pivot Point With Recent Volume-Driven Losses - 6/14/2023 |
View all notes |
Set NEW NOTE alert |
Company Profile |
SEC
News |
Chart |
Request a new note
C
A
S
I |
Symbol/Exchange
Company Name
Industry Group |
PRICE |
CHANGE
(%Change) |
Day High |
Volume
(% DAV)
(% 50 day avg vol) |
52 Wk Hi
% From Hi |
Featured
Date |
Price
Featured |
Pivot Featured |
|
Max Buy |
AMPH
-
NASDAQ
Amphastar Pharm
Medical-Biomed/Biotech
|
$55.79
|
+0.76
1.38% |
$56.17
|
794,732
178.99% of 50 DAV
50 DAV is 444,000
|
$55.61
0.32%
|
5/15/2023
|
$43.56
|
PP = $44.15
|
|
MB = $46.36
|
Most Recent Note - 6/20/2023 12:10:30 PM
G - Hit yet another new high with today's 4th consecutive gain backed by above average volume, getting very extended from any sound base. Prior highs in the $44 area define initial support to watch above its 50 DMA line ($42.80) on pullbacks. Fundamentals remain strong.
>>> FEATURED STOCK ARTICLE : Hit Another New High With 4th Consecutive Volume-Driven Gain - 6/20/2023 |
View all notes |
Set NEW NOTE alert |
Company Profile |
SEC
News |
Chart |
Request a new note
C
A
S
I |
ANET
-
NYSE
Arista Networks
Computer-Networking
|
$154.50
|
-3.29
-2.09% |
$159.42
|
4,366,106
129.21% of 50 DAV
50 DAV is 3,379,000
|
$178.36
-13.38%
|
5/30/2023
|
$176.35
|
PP = $171.54
|
|
MB = $180.12
|
Most Recent Note - 6/16/2023 5:50:17 PM
Y - Ended near the session low with today's 2nd volume-driven loss. Stalled after recent gains triggered a technical buy signal. Its 50 DMA line ($154) defines important near-term support to watch. Fundamentals remain strong.
>>> FEATURED STOCK ARTICLE : Rebounding Near Recent High With 3 Consecutive Gains - 6/12/2023 |
View all notes |
Set NEW NOTE alert |
Company Profile |
SEC
News |
Chart |
Request a new note
C
A
S
I |
PANW
-
NASDAQ
Palo Alto Networks
Computer Sftwr-Security
|
$241.60
|
-4.93
-2.00% |
$245.05
|
7,893,055
139.45% of 50 DAV
50 DAV is 5,660,000
|
$247.70
-2.46%
|
6/5/2023
|
$228.35
|
PP = $213.73
|
|
MB = $224.42
|
Most Recent Note - 6/20/2023 12:33:22 PM
G - Pulling back from its all-time high with today's loss following 5 consecutive gains backed by above average volume. Very extended from the prior high ($213) which defines initial support to watch on pullbacks. Fundamentals remain strong.
>>> FEATURED STOCK ARTICLE : Palo Alto Powers to New Highs Again - 6/5/2023 |
View all notes |
Set NEW NOTE alert |
Company Profile |
SEC
News |
Chart |
Request a new note
C
A
S
I |
LSCC
-
NASDAQ
Lattice Semiconductor
Elec-Semicondctor Fablss
|
$87.27
|
-1.39
-1.57% |
$90.19
|
1,555,670
63.34% of 50 DAV
50 DAV is 2,456,000
|
$96.82
-9.86%
|
6/13/2023
|
$91.73
|
PP = $96.92
|
|
MB = $101.77
|
Most Recent Note - 6/20/2023 5:38:50 PM
Y - Consolidating above its 50 DMA line ($84.99) and perched -9.9% off its all-time high. Subsequent gains above the pivot point backed by at least +40% above average volume may trigger a technical buy signal. Reported Mar '23 quarterly earnings +38% on +22% sales revenues versus the year-ago period, its 9th consecutive strong quarterly comparison above the +25% minimum earnings guideline (C criteria). Annual earnings history (A criteria) has been strong.
>>> FEATURED STOCK ARTICLE : Lattice Posts Volume-Driven Gains Approaching Prior High - 6/13/2023 |
View all notes |
Set NEW NOTE alert |
Company Profile |
SEC
News |
Chart |
Request a new note
C
A
S
I |
|
|
|
THESE ARE NOT BUY RECOMMENDATIONS!
Comments contained in the body of this report are technical
opinions only. The material herein has been obtained
from sources believed to be reliable and accurate, however,
its accuracy and completeness cannot be guaranteed.
This site is not an investment advisor, hence it does
not endorse or recommend any securities or other investments.
Any recommendation contained in this report may not
be suitable for all investors and it is not to be deemed
an offer or solicitation on our part with respect to
the purchase or sale of any securities. All trademarks,
service marks and trade names appearing in this report
are the property of their respective owners, and are
likewise used for identification purposes only.
This report is a service available
only to active Paid Premium Members.
You may opt-out of receiving report notifications
at any time. Questions or comments may be submitted
by writing to Premium Membership Services 665 S.E. 10 Street, Suite 201 Deerfield Beach, FL 33441-5634 or by calling 1-800-965-8307
or 954-785-1121.
|
|
|