You are not logged in.
This means you
CAN ONLY VIEW reports that were published prior to Thursday, March 20, 2025.
You
MUST UPGRADE YOUR MEMBERSHIP if you want to see any current reports.
AFTER MARKET UPDATE - FRIDAY, JUNE 9TH, 2023
Previous After Market Report Next After Market Report >>>
|
|
|
|
DOW |
+43.17 |
33,876.78 |
+0.13% |
|
Volume |
832,296,390 |
-1% |
|
Volume |
4,441,847,600 |
+1% |
|
NASDAQ |
+20.62 |
13,259.14 |
+0.16% |
|
Advancers |
1,077 |
38% |
|
Advancers |
1,532 |
35% |
|
S&P 500 |
+4.93 |
4,298.86 |
+0.11% |
|
Decliners |
1,785 |
62% |
|
Decliners |
2,878 |
65% |
|
Russell 2000 |
-15.07 |
1,865.71 |
-0.80% |
|
52 Wk Highs |
68 |
|
|
52 Wk Highs |
119 |
|
|
S&P 600 |
-10.03 |
1,201.43 |
-0.83% |
|
52 Wk Lows |
17 |
|
|
52 Wk Lows |
72 |
|
|
 |
Major Averages Inched Higher but Breadth Was Slightly Negative
Kenneth J. Gruneisen - Passed the CAN SLIM® Master's Exam
The Dow increased by 43 points (0.1%) and the S&P 500 increased by 0.1% while the Nasdaq Composite gained 0.2%. Volume totals reported were mixed, slightly lower on the NYSE and slightly higher on the Nasdaq exchange versus the prior session. Breadth was negative with decliners leading advancers by more than a 3-2 margin on the NYSE and by nearly 2-1 on the Nasdaq exchange. There were 44 high-ranked companies from the Leaders List that hit a new 52-week high and were listed on the BreakOuts Page, versus the total of 45 on the prior session. New 52-week highs totals still outnumbered new 52-week lows totals on the NYSE and on the Nasdaq exchange. The major indices are in a confirmed uptrend (M criteria). Appropriate new buying efforts may be considered under the fact-based investment system.
PICTURED: The Nasdaq Composite Index posted a small gain for a new 2023 high close.
Four of 11 sectors ended higher as U.S. equities rose modestly on Friday. The S&P 500 Index hit an intraday high of 4,300 for the first time since last August. Markets looked ahead to next week’s Consumer Price Index (CPI) release slated for Tuesday and the Federal Reserve’s (Fed) monetary policy announcement on Wednesday. Bond yields also increased ahead of the Fed’s forthcoming interest-rate decision. A quiet day for data releases today, as investors saw no major U.S. economic data reports.
U.S. Treasury yields were flat to higher today. The yield on the benchmark 10-year note rose by three basis points (0.03%) to 3.74%, while the 30-year bond yield remained flat at 3.88%. The yield on the two-year note rose by nine basis points (0.09%) to 4.60%. In commodities, West Texas Intermediate (WTI) crude dipped by more than one percent to $70.32/barrel. Overall, oil prices fell today, as concerns about weak demand growth from China offset Saudi Arabia’s decision to cut production at the Organization of Petroleum Exporting Countries and their allies (OPEC+) meeting last weekend.
|
 Kenneth J. Gruneisen started out as a licensed stockbroker in August 1987, a couple of months prior to the historic stock market crash that took the Dow Jones Industrial Average down -22.6% in a single day. He has published daily fact-based fundamental and technical analysis on high-ranked stocks online for two decades. Through FACTBASEDINVESTING.COM, Kenneth provides educational articles, news, market commentary, and other information regarding proven investment systems that work in good times and bad.
Comments contained in the body of this report are technical opinions only and are not necessarily those of Gruneisen Growth Corp. The material herein has been obtained from sources believed to be reliable and accurate, however, its accuracy and completeness cannot be guaranteed. Our firm, employees, and customers may effect transactions, including transactions contrary to any recommendation herein, or have positions in the securities mentioned herein or options with respect thereto. Any recommendation contained in this report may not be suitable for all investors and it is not to be deemed an offer or solicitation on our part with respect to the purchase or sale of any securities. |
|
 |
Retail, Bank, Tech, and Commodity-Linked Groups Fell
Kenneth J. Gruneisen - Passed the CAN SLIM® Master's Exam
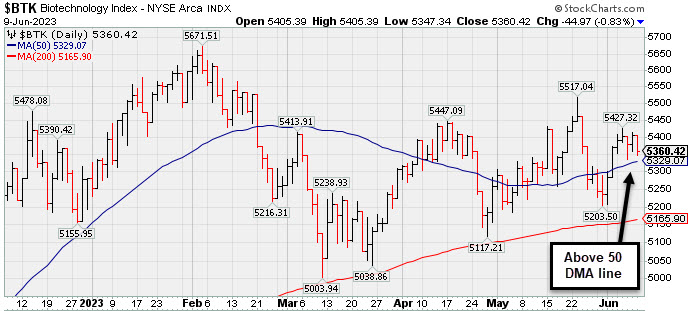
The Retail ($RLX -0.48%) and the Bank ($BKX -0.56%) both edged lower while the Broker/Dealer ($XBD +0.04%) finished flat. The tech sector had a negative bias as the Semiconductor ($SOX +0.30%) posted a small gain while the Biotech ($BTK -0.83%) and the Networking ($NWX -0.61%) both fell. The Gold & Silver $XAU (-1.27%) outpaced the Oil Services ($OSX -0.83%) and the Integrated Oil ($XOI -0.20%) to the downside.
PICTURED: The Biotech ($BTK -0.83%) is consolidating above its 50-day moving average (DMA) line.
| Oil Services |
$OSX |
77.27 |
-0.65 |
-0.83% |
-7.86% |
| Integrated Oil |
$XOI |
1,679.82 |
-3.43 |
-0.20% |
-6.01% |
| Semiconductor |
$SOX |
3,524.97 |
+10.65 |
+0.30% |
+39.21% |
| Networking |
$NWX |
795.28 |
-4.90 |
-0.61% |
+1.53% |
| Broker/Dealer |
$XBD |
464.84 |
+0.19 |
+0.04% |
+3.50% |
| Retail |
$RLX |
3,291.67 |
-15.79 |
-0.48% |
+19.52% |
| Gold & Silver |
$XAU |
123.89 |
-1.60 |
-1.27% |
+2.51% |
| Bank |
$BKX |
82.09 |
-0.47 |
-0.56% |
-18.60% |
| Biotech |
$BTK |
5,360.42 |
-44.97 |
-0.83% |
+1.50% |
|
|
|
 |
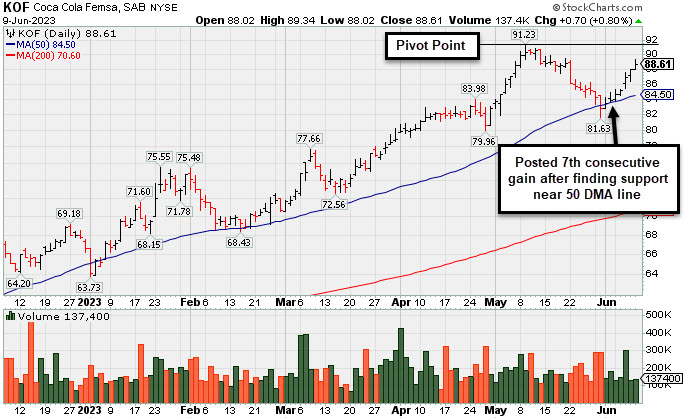
Coca-Cola Femsa Posts 7th Consecutive Gain
Kenneth J. Gruneisen - Passed the CAN SLIM® Master's Exam
Coca Cola Femsa Sab Ads (KOF +0.70 or +0.80% to $88.61) rose today for a 7th consecutive gain after finding support near its 50-day moving average (DMA) line ($85.16). Recent lows in the $81.50 area define the next important support to watch below its 50 DMA line.
KOF was highlighted in yellow with pivot point cited based on its 1/24/23 high plus 10 cents in the 3/07/23 mid-day report (read here). It was last shown in great detail on 5/02/23 with an annotated graph under the headline "Posted Gain Afrer Reporting Strong Mar '23 Quarterly Results". It reported Mar '23 quarterly earnings +53% on +24% sales revenues versus the year-ago period, its 4th quarterly earnings increase above the +25% minimum guideline (C criteria) backed by strong sales revenues growth.. KOF has a 96 Earnings Per Share Rating. Annal earnings had a downturn in FY '20 like many companies during the pandemic.
It hails from the Beverages - Non-Alcoholic group which is currently ranked 28th on the 197 Industry Groups list. There are 857.1 million shares in the public float (S criteria). The number of top-rated funds owning its shares rose from 120 in Mar '22 to 172 in Mar '23, a reassuring sign concerning the I criteria. Its current Up/Down Volume Ratio of 1.7 is an unbiased indication its shares have been under accumulation over the past 50 days.
|
|
|
Color Codes Explained :
Y - Better candidates highlighted by our
staff of experts.
G - Previously featured
in past reports as yellow but may no longer be buyable under the
guidelines.
***Last / Change / Volume data in this table is the closing quote data***
Symbol/Exchange
Company Name
Industry Group |
PRICE |
CHANGE
(%Change) |
Day High |
Volume
(% DAV)
(% 50 day avg vol) |
52 Wk Hi
% From Hi |
Featured
Date |
Price
Featured |
Pivot Featured |
|
Max Buy |
 GPK
-
NYSE
GPK
-
NYSE
Graphic Packaging
Paper and Paper Products
|
$26.52
|
+0.07
0.26% |
$26.71
|
3,016,074
107.26% of 50 DAV
50 DAV is 2,812,000
|
$26.70
-0.67%
|
10/25/2022
|
$22.75
|
PP = $24.17
|
|
MB = $25.38
|
Most Recent Note - 6/8/2023 7:13:35 PM
G - Hit a new all-time high with today's 6th consecutive gain. It did not form a sound new base of sufficient length but quickly recovered after testing its 4/27/23 low last week. Reported Mar '23 quarterly earnings +60% on +9% sales revenues versus the year-ago period. See the latest FSU analysis for more details and a new annotated graph.
>>> FEATURED STOCK ARTICLE : Graphic Packaging Hits New High With 6th Consecutive Gain - 6/8/2023 |
View all notes |
Set NEW NOTE alert |
Company Profile |
SEC
News |
Chart |
Request a new note
C
A
S
I |
STRL
-
NASDAQ
Sterling Infrastructure
Bldg-Heavy Construction
|
$53.49
|
+0.47
0.89% |
$53.97
|
377,693
148.70% of 50 DAV
50 DAV is 254,000
|
$53.53
-0.07%
|
12/14/2022
|
$32.41
|
PP = $33.72
|
|
MB = $35.41
|
Most Recent Note - 6/7/2023 5:19:22 PM
G - Hit yet another new all-time high with today's 14th gain in the span of 15 sessions, very extended from any sound base. Mar '23 quarterly earnings were below the +25% minimum guideline (C criteria). See the latest FSU analysis for more details and a new annotated graph.
>>> FEATURED STOCK ARTICLE : Impressive Streak of Gains for New Highs - 6/7/2023 |
View all notes |
Set NEW NOTE alert |
Company Profile |
SEC
News |
Chart |
Request a new note
C
A
S
I |
FIX
-
NYSE
Comfort Systems USA
Bldg-A/C and Heating Prds
|
$158.04
|
-0.19
-0.12% |
$158.59
|
167,704
60.11% of 50 DAV
50 DAV is 279,000
|
$161.94
-2.41%
|
4/27/2023
|
$148.85
|
PP = $152.23
|
|
MB = $159.84
|
Most Recent Note - 6/6/2023 3:10:24 PM
Y - Hitting a new all-time high and approaching its "max buy" level with today's big gain backed by light volume. No resistance remains due to overhead supply, however, it has made very little headway in recent weeks. It was repeatedly noted - "Subsequent gains and new highs backed by at least +40% above average volume may help reconfirm a technical buy signal."
>>> FEATURED STOCK ARTICLE : Churning Action While Recently Hovering Near All-Time High - 5/12/2023 |
View all notes |
Set NEW NOTE alert |
Company Profile |
SEC
News |
Chart |
Request a new note
C
A
S
I |
KOF
-
NYSE
Coca-Cola Femsa ADR
Beverages-Non-Alcoholic
|
$88.61
|
+0.70
0.80% |
$89.34
|
137,400
70.46% of 50 DAV
50 DAV is 195,000
|
$91.23
-2.87%
|
6/9/2023
|
$88.61
|
PP = $91.33
|
|
MB = $95.90
|
 Most Recent Note - 6/9/2023 5:52:26 PM
Y - Posted a 7th consecutive gain today after finding support near its 50 DMA line ($85.16). Color code is changed to yellow with new pivot point based on its 5/09/23 high plus 10 cents. Recent lows in the $81.50 area define the next important support to watch below its 50 DMA line. Reported Mar '23 quarterly earnings +53% on +24% sales revenues versus the year-ago period. See the latest FSU analysis for more details and a new annotated graph.
>>> FEATURED STOCK ARTICLE : Coca-Cola Femsa Posts 7th Consecutive Gain - 6/9/2023 |
View all notes |
Set NEW NOTE alert |
Company Profile |
SEC
News |
Chart |
Request a new note
C
A
S
I |
CLH
-
NYSE
Clean Harbors
Pollution Control
|
$156.38
|
-0.98
-0.62% |
$157.39
|
448,185
116.71% of 50 DAV
50 DAV is 384,000
|
$158.72
-1.47%
|
3/10/2023
|
$136.89
|
PP = $136.74
|
|
MB = $143.58
|
Most Recent Note - 6/9/2023 12:25:35 PM
G - Perched at its all-time high following 3 consecutive gains. Its 50 DMA line ($142.71) defines near-term support to watch on pullbacks. Reported Mar '23 quarterly earnings +64% on +12% sales revenues versus the year-ago period. Fundamentals remain strong.
>>> FEATURED STOCK ARTICLE : Showed Resilience Near 50-Day Moving Average Following Sell-Off - 5/10/2023 |
View all notes |
Set NEW NOTE alert |
Company Profile |
SEC
News |
Chart |
Request a new note
C
A
S
I |
Symbol/Exchange
Company Name
Industry Group |
PRICE |
CHANGE
(%Change) |
Day High |
Volume
(% DAV)
(% 50 day avg vol) |
52 Wk Hi
% From Hi |
Featured
Date |
Price
Featured |
Pivot Featured |
|
Max Buy |
SPSC
-
NASDAQ
SPS Commerce
Comp Sftwr-Spec Enterprs
|
$172.09
|
+1.55
0.91% |
$173.27
|
143,370
96.87% of 50 DAV
50 DAV is 148,000
|
$171.77
0.19%
|
4/24/2023
|
$150.01
|
PP = $157.56
|
|
MB = $165.44
|
Most Recent Note - 6/6/2023 3:16:49 PM
G - Color code is changed to green while rising above its "max buy" level and hitting a new 52-week high with today's 4th consecutive gain backed by near average volume. Gains above the pivot point were not backed by +40% above average volume, so it did not trigger a proper technical buy signal. Reported Mar '23 quarterly earnings +22% on +20% versus the year-ago period, below the +25% minimum earnings guideline (C criteria) raising some fundamental concerns.
>>> FEATURED STOCK ARTICLE : Pulled Back After Quietly Wedging to New Highs - 5/31/2023 |
View all notes |
Set NEW NOTE alert |
Company Profile |
SEC
News |
Chart |
Request a new note
C
A
S
I |
HUBB
-
NYSE
Hubbell
Electrical-Power/Equipmt
|
$306.86
|
+1.20
0.39% |
$307.04
|
294,211
73.19% of 50 DAV
50 DAV is 402,000
|
$306.63
0.08%
|
4/25/2023
|
$262.85
|
PP = $257.51
|
|
MB = $270.39
|
Most Recent Note - 6/7/2023 5:20:35 PM
G - Gain today with average volume hit yet another new all-time high, getting more extended from the prior base. Prior highs in the $263 area define initial support to watch on pullbacks. Fundamentals remain strong.
>>> FEATURED STOCK ARTICLE : Extended From Prior Base and Perched Near High - 6/1/2023 |
View all notes |
Set NEW NOTE alert |
Company Profile |
SEC
News |
Chart |
Request a new note
C
A
S
I |
NVR
-
NYSE
NVR
Bldg-Resident/Comml
|
$5,817.96
|
+11.80
0.20% |
$5,866.04
|
14,638
60.99% of 50 DAV
50 DAV is 24,000
|
$5,986.96
-2.82%
|
4/25/2023
|
$5,882.18
|
PP = $5,978.25
|
|
MB = $6,277.16
|
Most Recent Note - 6/6/2023 5:16:26 PM
G - Rebounded further above its 50 DMA line ($5,707) with today's light volume gain helping its technical stance. Reported Mar '23 quarterly earnings -14% on -3% sales revenues versus the year-ago period, below the +25% minimum earnings guideline (C criteria) raising fundamental concerns, and its color code was changed to green. Prior quarterly comparisons were well above the +25% minimum earnings guideline (C criteria). Annual earnings (A criteria) growth has been very strong. See the latest FSU analysis for more details and a new annotated graph.
>>> FEATURED STOCK ARTICLE : Rebounded Above 50 Day Average With Light Volume Gains - 6/6/2023 |
View all notes |
Set NEW NOTE alert |
Company Profile |
SEC
News |
Chart |
Request a new note
C
A
S
I |
PHM
-
NYSE
PulteGroup
Bldg-Resident/Comml
|
$71.99
|
+0.78
1.10% |
$72.37
|
2,454,646
84.58% of 50 DAV
50 DAV is 2,902,000
|
$72.89
-1.23%
|
4/25/2023
|
$65.17
|
PP = $64.01
|
|
MB = $67.21
|
Most Recent Note - 6/6/2023 3:13:08 PM
G - Hitting another new high with today's 4th consecutive gain backed by light volume, getting extended from any sound base. Reported earnings +28% for the Mar '23 quarter versus the year-ago period. Important support to watch is its 50 DMA line ($64.31). See the latest FSU analysis for more details and an annotated graph.
>>> FEATURED STOCK ARTICLE : Rebounded Above "Max Buy" Level Toward Recent High - 6/2/2023 |
View all notes |
Set NEW NOTE alert |
Company Profile |
SEC
News |
Chart |
Request a new note
C
A
S
I |
COKE
-
NASDAQ
Coca-Cola Consolidated
Beverages-Non-Alcoholic
|
$666.18
|
-2.59
-0.39% |
$671.30
|
40,926
113.68% of 50 DAV
50 DAV is 36,000
|
$694.20
-4.04%
|
5/4/2023
|
$646.66
|
PP = $656.21
|
|
MB = $689.02
|
Most Recent Note - 6/8/2023 12:48:26 PM
Y - Pulled back below its "max buy" level with recent volume-driven losses. Recent lows in the $625 area define important near-term support above its 50 DMA line. Fundamentals remain strong.
>>> FEATURED STOCK ARTICLE : COKE is Showing Real Strength - 5/4/2023 |
View all notes |
Set NEW NOTE alert |
Company Profile |
SEC
News |
Chart |
Request a new note
C
A
S
I |
Symbol/Exchange
Company Name
Industry Group |
PRICE |
CHANGE
(%Change) |
Day High |
Volume
(% DAV)
(% 50 day avg vol) |
52 Wk Hi
% From Hi |
Featured
Date |
Price
Featured |
Pivot Featured |
|
Max Buy |
AMPH
-
NASDAQ
Amphastar Pharm
Medical-Biomed/Biotech
|
$45.67
|
-0.22
-0.48% |
$46.35
|
310,270
76.99% of 50 DAV
50 DAV is 403,000
|
$46.86
-2.54%
|
5/15/2023
|
$43.56
|
PP = $44.15
|
|
MB = $46.36
|
Most Recent Note - 6/7/2023 5:24:58 PM
Y - Hovering near all-time high and just below "max buy" level stubbornly holding ground. Gain and strong close above the pivot point on 6/02/23 was backed by +55% above average volume clinching a technical buy signal. Fundamentals remain strong.
>>> FEATURED STOCK ARTICLE : Weak Finish After Early Gain When Perched Near All-Time High - 5/15/2023 |
View all notes |
Set NEW NOTE alert |
Company Profile |
SEC
News |
Chart |
Request a new note
C
A
S
I |
ANET
-
NYSE
Arista Networks
Computer-Networking
|
$162.52
|
+0.20
0.12% |
$167.18
|
2,978,127
91.80% of 50 DAV
50 DAV is 3,244,000
|
$178.36
-8.88%
|
5/30/2023
|
$176.35
|
PP = $171.54
|
|
MB = $180.12
|
Most Recent Note - 6/8/2023 7:15:47 PM
Y - Posted a gain today with below average volume. Stalled after recent gains triggered a technical buy signal. Its 50 DMA line ($154) defines important near-term support to watch. Color code was changed to yellow with new pivot point cited based on its 3/23/23 high plus 10 cents in the 5/30/23 mid-day report. Fundamentals remain strong.
>>> FEATURED STOCK ARTICLE : Technical Sell Signal Triggered by Damaging Volume-Driven Loss - 5/3/2023 |
View all notes |
Set NEW NOTE alert |
Company Profile |
SEC
News |
Chart |
Request a new note
C
A
S
I |
PANW
-
NASDAQ
Palo Alto Networks
Computer Sftwr-Security
|
$220.10
|
-2.72
-1.22% |
$224.78
|
4,962,347
115.06% of 50 DAV
50 DAV is 4,313,000
|
$230.18
-4.38%
|
6/5/2023
|
$228.35
|
PP = $213.73
|
|
MB = $224.42
|
Most Recent Note - 6/8/2023 7:16:51 PM
Y - Posted a solid gain today backed by near average volume. The prior high ($213) defines initial support to watch. Fundamentals remain strong.
>>> FEATURED STOCK ARTICLE : Palo Alto Powers to New Highs Again - 6/5/2023 |
View all notes |
Set NEW NOTE alert |
Company Profile |
SEC
News |
Chart |
Request a new note
C
A
S
I |
|
|
|
THESE ARE NOT BUY RECOMMENDATIONS!
Comments contained in the body of this report are technical
opinions only. The material herein has been obtained
from sources believed to be reliable and accurate, however,
its accuracy and completeness cannot be guaranteed.
This site is not an investment advisor, hence it does
not endorse or recommend any securities or other investments.
Any recommendation contained in this report may not
be suitable for all investors and it is not to be deemed
an offer or solicitation on our part with respect to
the purchase or sale of any securities. All trademarks,
service marks and trade names appearing in this report
are the property of their respective owners, and are
likewise used for identification purposes only.
This report is a service available
only to active Paid Premium Members.
You may opt-out of receiving report notifications
at any time. Questions or comments may be submitted
by writing to Premium Membership Services 665 S.E. 10 Street, Suite 201 Deerfield Beach, FL 33441-5634 or by calling 1-800-965-8307
or 954-785-1121.
|
|
|