You are not logged in.
This means you
CAN ONLY VIEW reports that were published prior to Thursday, March 13, 2025.
You
MUST UPGRADE YOUR MEMBERSHIP if you want to see any current reports.
AFTER MARKET UPDATE - FRIDAY, JUNE 16TH, 2023
Previous After Market Report Next After Market Report >>>
|
|
|
|
DOW |
-108.94 |
34,299.12 |
-0.32% |
|
Volume |
3,061,415,400 |
+197% |
|
Volume |
8,208,125,400 |
+43% |
|
NASDAQ |
-93.25 |
13,689.57 |
-0.68% |
|
Advancers |
1,085 |
38% |
|
Advancers |
1,748 |
40% |
|
S&P 500 |
-16.25 |
4,409.59 |
-0.37% |
|
Decliners |
1,778 |
62% |
|
Decliners |
2,671 |
60% |
|
Russell 2000 |
-13.81 |
1,875.47 |
-0.73% |
|
52 Wk Highs |
134 |
|
|
52 Wk Highs |
219 |
|
|
S&P 600 |
-4.94 |
1,204.80 |
-0.41% |
|
52 Wk Lows |
15 |
|
|
52 Wk Lows |
79 |
|
|
 |
Indices Reversed Breaking Recent Winning Streak
Kenneth J. Gruneisen - Passed the CAN SLIM® Master's Exam
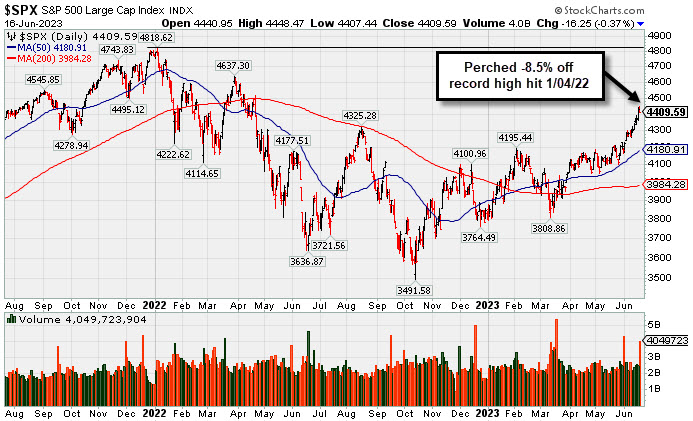
The Dow dropped 108 points (-0.3%) while the Nasdaq Composite declined by -0.7% and the S&P 500 lost -0.4%. Volume totals reported were higher on the NYSE and on the Nasdaq exchange versus the prior session, inflated by options expirations. Breadth was negative with decliners leading advancers by almost a 3-2 margin on the NYSE and on the Nasdaq exchange. There were 87 high-ranked companies from the Leaders List that hit a new 52-week high and were listed on the BreakOuts Page, versus the total of 67 on the prior session. New 52-week highs totals expanded and solidly outnumbered shrinking new 52-week lows totals on the NYSE and on the Nasdaq exchange. The major indices are in a confirmed uptrend (M criteria). Appropriate new buying efforts may be considered under the fact-based investment system.
PICTURED: The S&P 500 Index ended lower on Friday after touching a new 2023 high. The benchmark index rallied +6.9% while posting 5 consecutive weekly gains.
Only three of 11 sectors ended higher on Friday. Traders grappled with the difficult choice of possibly missing out on the rally or dealing with a potentially overbought market. On the data front, the monthly University of Michigan Sentiment Index beat expectations in June, showing marked improvement compared to May. Consumer expectations on inflation also showed more optimism compared to market forecasts; the University of Michigan Expected Change in Prices During the Next Year came in at 3.3% in June, lower than the surveyed expectation of 4.1%.
Treasury yields increased today. The yield on the benchmark 10-year note added five basis points (0.05%) to 3.77%, while the 30-year bond yield added one basis point (0.01%) to 3.85%. The yield on the two-year note, which is more sensitive to changes in Federal Reserve policy, increased by eight basis points (0.08%) to 4.72%. In commodities, West Texas Intermediate (WTI) crude increased to $71.69/barrel finishing the week in positive territory. Market concerns on weakening demand from a softening economy are balanced by optimism on Chinese demand strength and supply cuts from the Organization of the Petroleum Exporting Countries and its allies (OPEC+). |
 Kenneth J. Gruneisen started out as a licensed stockbroker in August 1987, a couple of months prior to the historic stock market crash that took the Dow Jones Industrial Average down -22.6% in a single day. He has published daily fact-based fundamental and technical analysis on high-ranked stocks online for two decades. Through FACTBASEDINVESTING.COM, Kenneth provides educational articles, news, market commentary, and other information regarding proven investment systems that work in good times and bad.
Comments contained in the body of this report are technical opinions only and are not necessarily those of Gruneisen Growth Corp. The material herein has been obtained from sources believed to be reliable and accurate, however, its accuracy and completeness cannot be guaranteed. Our firm, employees, and customers may effect transactions, including transactions contrary to any recommendation herein, or have positions in the securities mentioned herein or options with respect thereto. Any recommendation contained in this report may not be suitable for all investors and it is not to be deemed an offer or solicitation on our part with respect to the purchase or sale of any securities. |
|
 |
Financial, Retail, and Semiconductor Indexes Fell
Kenneth J. Gruneisen - Passed the CAN SLIM® Master's Exam
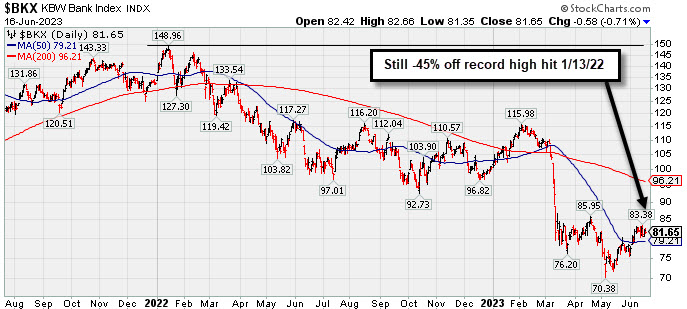
The Gold & Silver ($XAU +0.89%) posted a standout gain on Friday. The Bank ($BKX -0.71%), Broker/Dealer ($XBD -0.43%), and the Retail ($RLX -0.97%) each lost ground and created a drag on the major averages. The Semiconductor ($SOX -0.94%) led the tech sector lower, meanwhile the Biotech ($BTK -0.12%) and the Networking ($NWX +0.09%) both ended little changed. The Integrated Oil ($XOI -0.03%) finished flat while the Oil Services ($OSX -0.49%) edged lower.
PICTURED: The Bank ($BKX -0.71%) finished Friday's session lower but remains above its 50-day moving average (DMA) line. It is still -45% off its record high hit 1/13/22.
| Oil Services |
$OSX |
77.01 |
-0.38 |
-0.49% |
-8.17% |
| Integrated Oil |
$XOI |
1,666.40 |
-0.45 |
-0.03% |
-6.76% |
| Semiconductor |
$SOX |
3,673.14 |
-34.91 |
-0.94% |
+45.06% |
| Networking |
$NWX |
841.72 |
+0.76 |
+0.09% |
+7.46% |
| Broker/Dealer |
$XBD |
476.18 |
-2.05 |
-0.43% |
+6.02% |
| Retail |
$RLX |
3,355.30 |
-32.87 |
-0.97% |
+21.83% |
| Gold & Silver |
$XAU |
124.25 |
+1.10 |
+0.89% |
+2.81% |
| Bank |
$BKX |
81.65 |
-0.58 |
-0.71% |
-19.04% |
| Biotech |
$BTK |
5,468.84 |
-6.39 |
-0.12% |
+3.56% |
|
|
|
 |
"Negative Reversal" Following Recent Volume-Driven Gains
Kenneth J. Gruneisen - Passed the CAN SLIM® Master's Exam
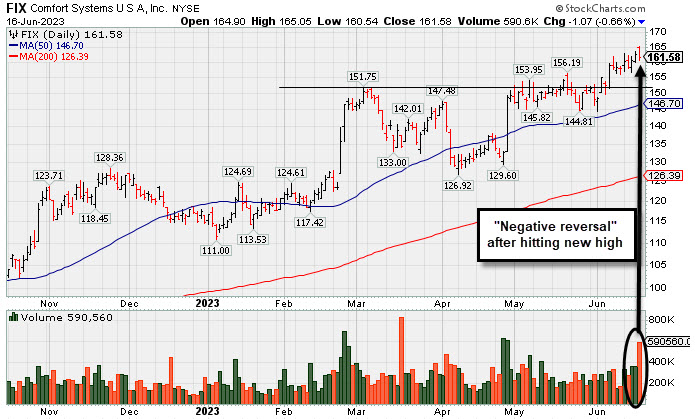
Comfort Systems U S A (FIX -$1.07 or -0.66% to $161.58) had a "negative reversal" after hitting a new all-time high. No resistance remains due to overhead supply. Its current Up/Down Volume Ratio of 1.3 is an unbiased indication its shares have been under accumulation over the past 50 days.
Annual earnings history has been strong and steady. It now has a 98 Earnings Per Share Rating. Bullish action came after it reported Mar '23 quarterly earnings +66% on +33% sales revenues versus the year-ago period. FIX was highlighted in yellow in the 2/23/23 mid-day report (read here) with a pivot point cited based on its 11/23/22 high plus 10 cents. It was last shown in greater detail on 5/12/23 with an annotated graph under the headline, "Churning Action While Recently Hovering Near All-Time High".
It hails from the Building - A/C & Heating Products group which is currently ranked 23rd on the 197 Industry Groups list. It has a small supply of only 35.8 million shares outstanding (S criteria) which can contribute to greater price volatility in the event of institutional buying or selling. The number of top-rated funds that own its shares rose from 487 in Jun '22 to 607 in Mar '23, a reassuring sign regarding the I criteria.
|
|
|
Color Codes Explained :
Y - Better candidates highlighted by our
staff of experts.
G - Previously featured
in past reports as yellow but may no longer be buyable under the
guidelines.
***Last / Change / Volume data in this table is the closing quote data***
Symbol/Exchange
Company Name
Industry Group |
PRICE |
CHANGE
(%Change) |
Day High |
Volume
(% DAV)
(% 50 day avg vol) |
52 Wk Hi
% From Hi |
Featured
Date |
Price
Featured |
Pivot Featured |
|
Max Buy |
 GPK
-
NYSE
GPK
-
NYSE
Graphic Packaging
Paper and Paper Products
|
$26.01
|
-0.16
-0.61% |
$26.22
|
52,991,037
1,707.74% of 50 DAV
50 DAV is 3,103,000
|
$27.56
-5.62%
|
10/25/2022
|
$22.75
|
PP = $24.17
|
|
MB = $25.38
|
Most Recent Note - 6/14/2023 12:00:16 PM
G - Slumping below its prior high in the $26 area with today's loss. There was a "negative reversal" on the prior session for a loss with heavy volume after hitting new all-time highs with 8 consecutive gains. It did not form a sound new base of sufficient length but quickly recovered after testing its 4/27/23 low. Reported Mar '23 quarterly earnings +60% on +9% sales revenues versus the year-ago period.
>>> FEATURED STOCK ARTICLE : Graphic Packaging Hits New High With 6th Consecutive Gain - 6/8/2023 |
View all notes |
Set NEW NOTE alert |
Company Profile |
SEC
News |
Chart |
Request a new note
C
A
S
I |
STRL
-
NASDAQ
Sterling Infrastructure
Bldg-Heavy Construction
|
$51.86
|
-1.11
-2.10% |
$53.03
|
554,249
212.36% of 50 DAV
50 DAV is 261,000
|
$54.44
-4.74%
|
12/14/2022
|
$32.41
|
PP = $33.72
|
|
MB = $35.41
|
 Most Recent Note - 6/16/2023 5:52:45 PM
G - Pulled back from its all-time high with today's volume-driven loss. It is very extended from any sound base. Mar '23 quarterly earnings were below the +25% minimum guideline (C criteria) raising fundamental concerns.
>>> FEATURED STOCK ARTICLE : Impressive Streak of Gains for New Highs - 6/7/2023 |
View all notes |
Set NEW NOTE alert |
Company Profile |
SEC
News |
Chart |
Request a new note
C
A
S
I |
FIX
-
NYSE
Comfort Systems USA
Bldg-A/C and Heating Prds
|
$161.58
|
-1.07
-0.66% |
$165.05
|
602,610
219.93% of 50 DAV
50 DAV is 274,000
|
$163.61
-1.24%
|
4/27/2023
|
$148.85
|
PP = $152.23
|
|
MB = $159.84
|
Most Recent Note - 6/16/2023 5:48:49 PM
G - After touching a new all-time high, there was a "negative reversal" today. It is extended from the prior base and no resistance remains due to overhead supply. Prior highs in the $152-156 area define initial support to watch on pullbacks. See the latest FSU analysis for more details and a new annotated graph.
>>> FEATURED STOCK ARTICLE : "Negative Reversal" Following Recent Volume-Driven Gains - 6/16/2023 |
View all notes |
Set NEW NOTE alert |
Company Profile |
SEC
News |
Chart |
Request a new note
C
A
S
I |
KOF
-
NYSE
Coca-Cola Femsa ADR
Beverages-Non-Alcoholic
|
$88.14
|
-0.20
-0.23% |
$89.25
|
85,334
46.89% of 50 DAV
50 DAV is 182,000
|
$91.23
-3.39%
|
6/9/2023
|
$88.61
|
PP = $91.33
|
|
MB = $95.90
|
Most Recent Note - 6/14/2023 4:26:42 PM
Y - Perched within striking distance of its 52-week high. Found support near its 50 DMA line ($85.63) during its recent consolidation. Subsequent gains above the pivot point backed by at least +40% above average volume may trigger a technical buy signal. Fundamentals remain strong.
>>> FEATURED STOCK ARTICLE : Coca-Cola Femsa Posts 7th Consecutive Gain - 6/9/2023 |
View all notes |
Set NEW NOTE alert |
Company Profile |
SEC
News |
Chart |
Request a new note
C
A
S
I |
CLH
-
NYSE
Clean Harbors
Pollution Control
|
$156.67
|
+0.65
0.42% |
$157.03
|
576,732
152.57% of 50 DAV
50 DAV is 378,000
|
$158.72
-1.29%
|
3/10/2023
|
$136.89
|
PP = $136.74
|
|
MB = $143.58
|
Most Recent Note - 6/15/2023 5:59:17 PM
G - Hovering near its all-time high, extended from any sound base. Its 50 DMA line ($144) defines near-term support to watch on pullbacks. Fundamentals remain strong. See the latest FSU analysis for more details and a new annotated graph.
>>> FEATURED STOCK ARTICLE : Extended From Any Sound Base and Hovering Near High - 6/15/2023 |
View all notes |
Set NEW NOTE alert |
Company Profile |
SEC
News |
Chart |
Request a new note
C
A
S
I |
Symbol/Exchange
Company Name
Industry Group |
PRICE |
CHANGE
(%Change) |
Day High |
Volume
(% DAV)
(% 50 day avg vol) |
52 Wk Hi
% From Hi |
Featured
Date |
Price
Featured |
Pivot Featured |
|
Max Buy |
SPSC
-
NASDAQ
SPS Commerce
Comp Sftwr-Spec Enterprs
|
$184.70
|
+2.68
1.47% |
$185.88
|
632,928
408.34% of 50 DAV
50 DAV is 155,000
|
$182.22
1.36%
|
4/24/2023
|
$150.01
|
PP = $157.56
|
|
MB = $165.44
|
Most Recent Note - 6/16/2023 1:19:13 PM
G - Hit yet another new 52-week high today while adding to an imrepssive streak of gains, getting very extended from any sound base. Reported Mar '23 quarterly earnings +22% on +20% versus the year-ago period, below the +25% minimum earnings guideline (C criteria) raising some fundamental concerns.
>>> FEATURED STOCK ARTICLE : Pulled Back After Quietly Wedging to New Highs - 5/31/2023 |
View all notes |
Set NEW NOTE alert |
Company Profile |
SEC
News |
Chart |
Request a new note
C
A
S
I |
HUBB
-
NYSE
Hubbell
Electrical-Power/Equipmt
|
$320.38
|
-0.64
-0.20% |
$322.89
|
824,091
205.51% of 50 DAV
50 DAV is 401,000
|
$321.82
-0.45%
|
4/25/2023
|
$262.85
|
PP = $257.51
|
|
MB = $270.39
|
Most Recent Note - 6/13/2023 5:15:56 PM
G - Hit yet another new all-time high with today's 6th consecutive gain, getting more extended from the prior base. Prior highs in the $263 area define initial support to watch on pullbacks. Fundamentals remain strong.
>>> FEATURED STOCK ARTICLE : Extended From Prior Base and Perched Near High - 6/1/2023 |
View all notes |
Set NEW NOTE alert |
Company Profile |
SEC
News |
Chart |
Request a new note
C
A
S
I |
NVR
-
NYSE
NVR
Bldg-Resident/Comml
|
$5,990.38
|
+45.42
0.76% |
$6,000.00
|
50,762
220.70% of 50 DAV
50 DAV is 23,000
|
$5,986.96
0.06%
|
4/25/2023
|
$5,882.18
|
PP = $5,978.25
|
|
MB = $6,277.16
|
Most Recent Note - 6/13/2023 5:14:42 PM
G - Posted a 4th consecutive gain today with below-average volume. Its 50 DMA line ($5,747) defines near-term support above the recent low ($5,520 on 6/01/23). Reported Mar '23 quarterly earnings -14% on -3% sales revenues versus the year-ago period, below the +25% minimum earnings guideline (C criteria) raising fundamental concerns, and its color code was changed to green. Prior quarterly comparisons were well above the +25% minimum earnings guideline (C criteria). Annual earnings (A criteria) growth has been very strong.
>>> FEATURED STOCK ARTICLE : Rebounded Above 50 Day Average With Light Volume Gains - 6/6/2023 |
View all notes |
Set NEW NOTE alert |
Company Profile |
SEC
News |
Chart |
Request a new note
C
A
S
I |
PHM
-
NYSE
PulteGroup
Bldg-Resident/Comml
|
$73.51
|
-0.29
-0.39% |
$74.81
|
5,781,197
194.98% of 50 DAV
50 DAV is 2,965,000
|
$74.53
-1.37%
|
4/25/2023
|
$65.17
|
PP = $64.01
|
|
MB = $67.21
|
Most Recent Note - 6/12/2023 6:12:42 PM
G - Hit yet another new high with today's 2nd consecutive gain backed by below average volume, getting more extended from any sound base. Reported earnings +28% for the Mar '23 quarter versus the year-ago period. Important support to watch is defined by its 50 DMA line ($65) and recent low.
>>> FEATURED STOCK ARTICLE : Rebounded Above "Max Buy" Level Toward Recent High - 6/2/2023 |
View all notes |
Set NEW NOTE alert |
Company Profile |
SEC
News |
Chart |
Request a new note
C
A
S
I |
COKE
-
NASDAQ
Coca-Cola Consolidated
Beverages-Non-Alcoholic
|
$656.48
|
+15.66
2.44% |
$658.05
|
71,324
198.12% of 50 DAV
50 DAV is 36,000
|
$694.20
-5.43%
|
5/4/2023
|
$646.66
|
PP = $656.21
|
|
MB = $689.02
|
Most Recent Note - 6/16/2023 5:51:36 PM
Y - Managed a "positive reversal" today for a volume-driven gain. Recent lows in the $625 area define important near-term support above its 50 DMA line ($618). Fundamentals remain strong. See the latest FSU analysis for more details and an annotated graph.
>>> FEATURED STOCK ARTICLE : Fell Below Pivot Point With Recent Volume-Driven Losses - 6/14/2023 |
View all notes |
Set NEW NOTE alert |
Company Profile |
SEC
News |
Chart |
Request a new note
C
A
S
I |
Symbol/Exchange
Company Name
Industry Group |
PRICE |
CHANGE
(%Change) |
Day High |
Volume
(% DAV)
(% 50 day avg vol) |
52 Wk Hi
% From Hi |
Featured
Date |
Price
Featured |
Pivot Featured |
|
Max Buy |
AMPH
-
NASDAQ
Amphastar Pharm
Medical-Biomed/Biotech
|
$55.03
|
+2.80
5.36% |
$55.61
|
1,249,002
293.19% of 50 DAV
50 DAV is 426,000
|
$52.85
4.12%
|
5/15/2023
|
$43.56
|
PP = $44.15
|
|
MB = $46.36
|
Most Recent Note - 6/16/2023 12:07:58 PM
G - Hitting yet another new high with today's 3rd consecutive gain backed by above average volume, getting very extended from any sound base. Prior highs in the $44 area define initial support to watch above its 50 DMA line ($42.47) on pullbacks. Fundamentals remain strong.
>>> FEATURED STOCK ARTICLE : Weak Finish After Early Gain When Perched Near All-Time High - 5/15/2023 |
View all notes |
Set NEW NOTE alert |
Company Profile |
SEC
News |
Chart |
Request a new note
C
A
S
I |
ANET
-
NYSE
Arista Networks
Computer-Networking
|
$157.79
|
-5.68
-3.47% |
$166.22
|
4,497,397
134.98% of 50 DAV
50 DAV is 3,332,000
|
$178.36
-11.53%
|
5/30/2023
|
$176.35
|
PP = $171.54
|
|
MB = $180.12
|
Most Recent Note - 6/16/2023 5:50:17 PM
Y - Ended near the session low with today's 2nd volume-driven loss. Stalled after recent gains triggered a technical buy signal. Its 50 DMA line ($154) defines important near-term support to watch. Fundamentals remain strong.
>>> FEATURED STOCK ARTICLE : Rebounding Near Recent High With 3 Consecutive Gains - 6/12/2023 |
View all notes |
Set NEW NOTE alert |
Company Profile |
SEC
News |
Chart |
Request a new note
C
A
S
I |
PANW
-
NASDAQ
Palo Alto Networks
Computer Sftwr-Security
|
$246.53
|
+2.73
1.12% |
$247.70
|
54,643,158
1,183.52% of 50 DAV
50 DAV is 4,617,000
|
$244.86
0.68%
|
6/5/2023
|
$228.35
|
PP = $213.73
|
|
MB = $224.42
|
Most Recent Note - 6/16/2023 1:11:17 PM
G - Hit yet another new all-time high today following 4 consecutive gains backed by above average volume. Very extended from the prior high ($213) which defines initial support to watch on pullbacks. Fundamentals remain strong.
>>> FEATURED STOCK ARTICLE : Palo Alto Powers to New Highs Again - 6/5/2023 |
View all notes |
Set NEW NOTE alert |
Company Profile |
SEC
News |
Chart |
Request a new note
C
A
S
I |
LSCC
-
NASDAQ
Lattice Semiconductor
Elec-Semicondctor Fablss
|
$88.66
|
-0.99
-1.10% |
$91.13
|
2,996,911
123.69% of 50 DAV
50 DAV is 2,423,000
|
$96.82
-8.43%
|
6/13/2023
|
$91.73
|
PP = $96.92
|
|
MB = $101.77
|
Most Recent Note - 6/13/2023 12:39:52 PM
Y - Color code is changed to yellow with pivot point cited based on its 3/23/23 high plus 10 cents. Gapped up today approaching prior highs after rebounding above its 50 DMA line ($85.23) on the prior session with a volume-driven gain. Subsequent gains above the pivot point backed by at least +40% above average volume may trigger a technical buy signal. Reported Mar '23 quarterly earnings +38% on +22% sales revenues versus the year-ago period, its 9th consecutive strong quarterly comparison above the +25% minimum earnings guideline (C criteria). Annual earnings history (A criteria) has been strong.
>>> FEATURED STOCK ARTICLE : Lattice Posts Volume-Driven Gains Approaching Prior High - 6/13/2023 |
View all notes |
Set NEW NOTE alert |
Company Profile |
SEC
News |
Chart |
Request a new note
C
A
S
I |
|
|
|
THESE ARE NOT BUY RECOMMENDATIONS!
Comments contained in the body of this report are technical
opinions only. The material herein has been obtained
from sources believed to be reliable and accurate, however,
its accuracy and completeness cannot be guaranteed.
This site is not an investment advisor, hence it does
not endorse or recommend any securities or other investments.
Any recommendation contained in this report may not
be suitable for all investors and it is not to be deemed
an offer or solicitation on our part with respect to
the purchase or sale of any securities. All trademarks,
service marks and trade names appearing in this report
are the property of their respective owners, and are
likewise used for identification purposes only.
This report is a service available
only to active Paid Premium Members.
You may opt-out of receiving report notifications
at any time. Questions or comments may be submitted
by writing to Premium Membership Services 665 S.E. 10 Street, Suite 201 Deerfield Beach, FL 33441-5634 or by calling 1-800-965-8307
or 954-785-1121.
|
|
|