You are not logged in.
This means you
CAN ONLY VIEW reports that were published prior to Thursday, March 13, 2025.
You
MUST UPGRADE YOUR MEMBERSHIP if you want to see any current reports.
AFTER MARKET UPDATE - WEDNESDAY, JUNE 21ST, 2023
Previous After Market Report Next After Market Report >>>
|
|
|
|
DOW |
-102.35 |
33,951.52 |
-0.30% |
|
Volume |
934,163,690 |
-10% |
|
Volume |
5,236,770,800 |
-1% |
|
NASDAQ |
-165.10 |
13,502.20 |
-1.21% |
|
Advancers |
1,436 |
51% |
|
Advancers |
1,853 |
42% |
|
S&P 500 |
-23.02 |
4,365.69 |
-0.52% |
|
Decliners |
1,403 |
49% |
|
Decliners |
2,560 |
58% |
|
Russell 2000 |
-3.68 |
1,863.01 |
-0.20% |
|
52 Wk Highs |
90 |
|
|
52 Wk Highs |
95 |
|
|
S&P 600 |
-1.64 |
1,197.96 |
-0.14% |
|
52 Wk Lows |
25 |
|
|
52 Wk Lows |
132 |
|
|
 |
Major Indices Fell Although Leadership Improved
Kenneth J. Gruneisen - Passed the CAN SLIM® Master's Exam
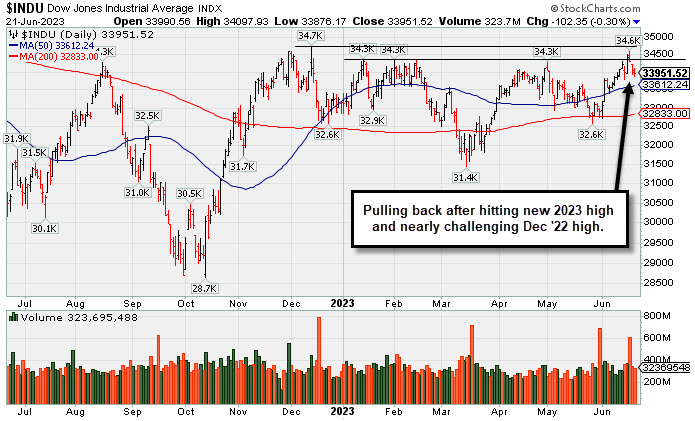
The Dow dropped 102 points (-0.3%) and S&P 500 fell -0.5%, while the Nasdaq Composite declined by -1.2%. Volume totals reported were lighter on the NYSE and on the Nasdaq exchange versus the prior session. Advancers narrowly outnumbered decliners on the NYSE but decliners led advancers by more than a 5-4 margin on the Nasdaq exchange. There were 54 high-ranked companies from the Leaders List that hit a new 52-week high and were listed on the BreakOuts Page, versus the total of 38 on the prior session. New 52-week highs totals outnumbered new 52-week lows on the NYSE, but new lows outnumbered new highs for the 2nd consecutive session on the Nasdaq exchange. The major indices are in a confirmed uptrend (M criteria). Appropriate new buying efforts may be considered under the fact-based investment system.
PICTURED: The Dow Jones Industrial Average is pulling back after hitting a new 2023 high and nearly challenging its Dec '22 high.
Six of 11 sectors rose while the major averages finished lower on Wednesday. The Federal Reserve (Fed) Chair Jerome Powell reaffirmed the Fed’s determination to fight inflation. The message points to a stronger possibility of further interest rate hikes, contradicting some market participants’ bets on an end of rate hikes. Technology companies led the decline.
On the data front, the Mortgage Bankers Association released the weekly Mortgage Market Index, showing that mortgage applications increased 0.5% last week following the strong housing starts monthly change in May. Treasury yields remained relatively flat today. The yield on the benchmark 10-year note remained flat at 3.72%, while the 30-year bond yield also remained flat at 3.81%. The yield on the two-year note, which is more sensitive to changes in Fed policy, increased by two basis points (0.02%) to 4.70%. In commodities, West Texas Intermediate (WTI) crude increased to $72.64/barrel as analysts predict a drawdown in U.S. crude oil inventories.
|
 Kenneth J. Gruneisen started out as a licensed stockbroker in August 1987, a couple of months prior to the historic stock market crash that took the Dow Jones Industrial Average down -22.6% in a single day. He has published daily fact-based fundamental and technical analysis on high-ranked stocks online for two decades. Through FACTBASEDINVESTING.COM, Kenneth provides educational articles, news, market commentary, and other information regarding proven investment systems that work in good times and bad.
Comments contained in the body of this report are technical opinions only and are not necessarily those of Gruneisen Growth Corp. The material herein has been obtained from sources believed to be reliable and accurate, however, its accuracy and completeness cannot be guaranteed. Our firm, employees, and customers may effect transactions, including transactions contrary to any recommendation herein, or have positions in the securities mentioned herein or options with respect thereto. Any recommendation contained in this report may not be suitable for all investors and it is not to be deemed an offer or solicitation on our part with respect to the purchase or sale of any securities. |
|
 |
Energy-Linked Groups Posted Standout Gains
Kenneth J. Gruneisen - Passed the CAN SLIM® Master's Exam
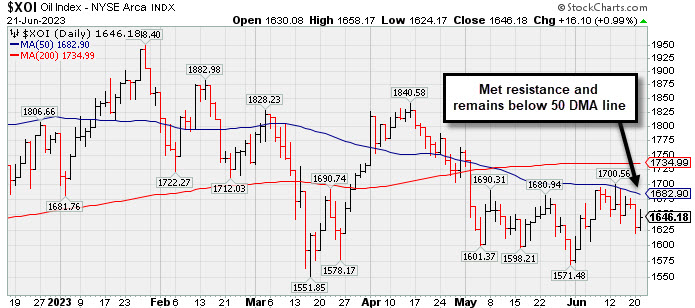
The Bank Index ($BKX -0.63%), Broker/Dealer Index ($XBD -0.37%), and the Retail Index ($RLX -0.40%) each suffered a small loss. The Semiconductor Index ($SOX -2.68%) led the tech sector lower while the Networking Index ($NWX -1.70%) followed and the Biotech Index ($BTK -0.16%) also inched lower. The energy-linked groups were standout gainers as the Integrated Oil Index ($XOI +0.99%) and the Oil Services Index ($OSX +1.06%) each rose, meanwhile the Gold & Silver Index ($XAU -0.30%) lost a little ground.
PICTURED: The Integrated Oil Index ($XOI +0.99%) met resistance and remains below its 50-day moving average (DMA) line.
| Oil Services |
$OSX |
76.70 |
+0.80 |
+1.06% |
-8.54% |
| Integrated Oil |
$XOI |
1,646.18 |
+16.10 |
+0.99% |
-7.89% |
| Semiconductor |
$SOX |
3,549.73 |
-97.84 |
-2.68% |
+40.19% |
| Networking |
$NWX |
814.58 |
-14.12 |
-1.70% |
+3.99% |
| Broker/Dealer |
$XBD |
472.51 |
-1.75 |
-0.37% |
+5.21% |
| Retail |
$RLX |
3,341.27 |
-13.26 |
-0.40% |
+21.32% |
| Gold & Silver |
$XAU |
119.27 |
-0.36 |
-0.30% |
-1.32% |
| Bank |
$BKX |
80.31 |
-0.51 |
-0.63% |
-20.37% |
| Biotech |
$BTK |
5,434.34 |
-8.71 |
-0.16% |
+2.90% |
|
|
|
 |
Perched Near High Following Noted Volume-Driven Gains
Kenneth J. Gruneisen - Passed the CAN SLIM® Master's Exam
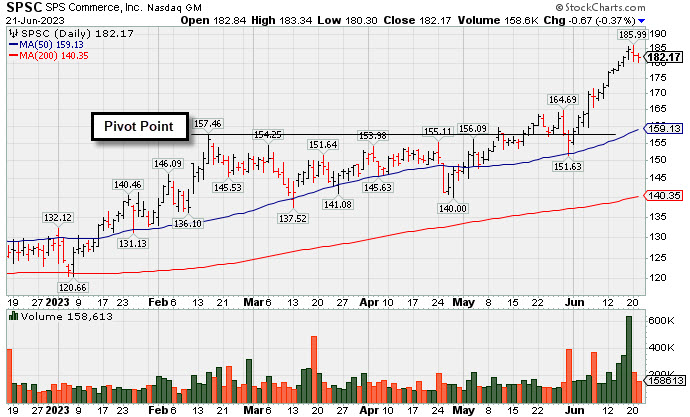
SPS Commerce (SPSC -$0.67 or -0.37% to $182.17) pulled back slightly with lighter volume, stubbornly holding its ground near its 52-week high following an impressive streak of gains. It is extended from the previousl noted base.
Recently it reported Mar '23 quarterly earnings +22% on +20% versus the year-ago period, below the +25% minimum earnings guideline (C criteria) raising some fundamental concerns. Two of the 4 latest quarterly comparisons were above the +25% minimum earnings guideline (C criteria). Annual earnings (A criteria) history has been strong and it still has an Earnings Per Share Rating of 98.
SPSC was highlighted in yellow in the 4/24/23 mid-day report with new pivot point cited based on its 2/15/23 high plus 10 cents. It was last shown in this FSU section in greater detail on 5/31/23 with an annotated graph under the headline, "Pulled Back After Quietly Wedging to New Highs".
SPSC hails from the Computer Software - Spec Enterprise group which is currently ranked 6th on the 197 Industry Groups list (L criteria). The number of top-rated funds owning its shares rose from 562 in Sep '22 to 586 in Mar '23, a reassuring sign concerning the I criteria. Its current Up/Down Volume Ratio of 2.0 is an unbiased indication its shares have been under accumulation over the past 50 days. It has a Timeliness Rating of A and Sponsorship Rating of B. The small supply of 36.5 million shares outstanding (S criteria) can contribute to greater price volatility in the event of institutional buying or selling. A 2:1 split impacted share price on 8/23/19. Charts courtesy of www.stockcharts.com
|
|
|
Color Codes Explained :
Y - Better candidates highlighted by our
staff of experts.
G - Previously featured
in past reports as yellow but may no longer be buyable under the
guidelines.
***Last / Change / Volume data in this table is the closing quote data***
Symbol/Exchange
Company Name
Industry Group |
PRICE |
CHANGE
(%Change) |
Day High |
Volume
(% DAV)
(% 50 day avg vol) |
52 Wk Hi
% From Hi |
Featured
Date |
Price
Featured |
Pivot Featured |
|
Max Buy |
 GPK
-
NYSE
GPK
-
NYSE
Graphic Packaging
Paper and Paper Products
|
$24.41
|
-0.25
-1.01% |
$24.75
|
5,213,645
126.88% of 50 DAV
50 DAV is 4,109,000
|
$27.56
-11.43%
|
10/25/2022
|
$22.75
|
PP = $24.17
|
|
MB = $25.38
|
Most Recent Note - 6/20/2023 12:21:55 PM
G - Slumping below its 50 DMA line ($25.28) raising concerns with today's 4th volume-driven loss in the span of 5 sessions following a noted "negative reversal" on 6/13/23. Only a prompt rebound above the 50 DMA line would help its outlook improve. It was repeatedly noted - "It did not form a sound new base of sufficient length but quickly recovered after testing its 4/27/23 low. Reported Mar '23 quarterly earnings +60% on +9% sales revenues versus the year-ago period."
>>> FEATURED STOCK ARTICLE : Graphic Packaging Hits New High With 6th Consecutive Gain - 6/8/2023 |
View all notes |
Set NEW NOTE alert |
Company Profile |
SEC
News |
Chart |
Request a new note
C
A
S
I |
STRL
-
NASDAQ
Sterling Infrastructure
Bldg-Heavy Construction
|
$51.81
|
-0.80
-1.52% |
$52.68
|
491,114
186.03% of 50 DAV
50 DAV is 264,000
|
$54.44
-4.83%
|
12/14/2022
|
$32.41
|
PP = $33.72
|
|
MB = $35.41
|
 Most Recent Note - 6/21/2023 1:17:39 PM
G - Holding its ground stubbornly near its all-time high, extended from any sound base. Mar '23 quarterly earnings were below the +25% minimum guideline (C criteria) raising fundamental concerns.
>>> FEATURED STOCK ARTICLE : Impressive Streak of Gains for New Highs - 6/7/2023 |
View all notes |
Set NEW NOTE alert |
Company Profile |
SEC
News |
Chart |
Request a new note
C
A
S
I |
FIX
-
NYSE
Comfort Systems USA
Bldg-A/C and Heating Prds
|
$164.35
|
+4.65
2.91% |
$164.86
|
242,750
87.32% of 50 DAV
50 DAV is 278,000
|
$165.05
-0.42%
|
4/27/2023
|
$148.85
|
PP = $152.23
|
|
MB = $159.84
|
Most Recent Note - 6/21/2023 7:09:49 PM
G - Posted a gain today with below-average volume for a best-ever close. It is extended from the prior base and no resistance remains due to overhead supply. Prior highs in the $152-156 area define initial support to watch above its 50 DMA line ($148).
>>> FEATURED STOCK ARTICLE : "Negative Reversal" Following Recent Volume-Driven Gains - 6/16/2023 |
View all notes |
Set NEW NOTE alert |
Company Profile |
SEC
News |
Chart |
Request a new note
C
A
S
I |
KOF
-
NYSE
Coca-Cola Femsa ADR
Beverages-Non-Alcoholic
|
$88.37
|
+0.58
0.66% |
$88.69
|
84,478
47.19% of 50 DAV
50 DAV is 179,000
|
$91.23
-3.13%
|
6/9/2023
|
$88.61
|
PP = $91.33
|
|
MB = $95.90
|
Most Recent Note - 6/20/2023 5:42:55 PM
Y - Volume totals have been cooling while stubbornly holding its ground perched within striking distance of its 52-week high. Found support near its 50 DMA line ($86) during its recent consolidation. Subsequent gains above the pivot point backed by at least +40% above average volume may trigger a technical buy signal. Fundamentals remain strong.
>>> FEATURED STOCK ARTICLE : Coca-Cola Femsa Posts 7th Consecutive Gain - 6/9/2023 |
View all notes |
Set NEW NOTE alert |
Company Profile |
SEC
News |
Chart |
Request a new note
C
A
S
I |
CLH
-
NYSE
Clean Harbors
Pollution Control
|
$159.54
|
+1.35
0.85% |
$160.50
|
341,607
89.43% of 50 DAV
50 DAV is 382,000
|
$158.72
0.52%
|
3/10/2023
|
$136.89
|
PP = $136.74
|
|
MB = $143.58
|
Most Recent Note - 6/20/2023 5:44:32 PM
G - Hit another new all-time high today, and it is very extended from any sound base. Its 50 DMA line ($145) defines near-term support to watch on pullbacks. Fundamentals remain strong.
>>> FEATURED STOCK ARTICLE : Extended From Any Sound Base and Hovering Near High - 6/15/2023 |
View all notes |
Set NEW NOTE alert |
Company Profile |
SEC
News |
Chart |
Request a new note
C
A
S
I |
Symbol/Exchange
Company Name
Industry Group |
PRICE |
CHANGE
(%Change) |
Day High |
Volume
(% DAV)
(% 50 day avg vol) |
52 Wk Hi
% From Hi |
Featured
Date |
Price
Featured |
Pivot Featured |
|
Max Buy |
SPSC
-
NASDAQ
SPS Commerce
Comp Sftwr-Spec Enterprs
|
$182.17
|
-0.67
-0.37% |
$183.34
|
158,613
96.13% of 50 DAV
50 DAV is 165,000
|
$185.88
-2.00%
|
4/24/2023
|
$150.01
|
PP = $157.56
|
|
MB = $165.44
|
Most Recent Note - 6/21/2023 7:12:30 PM
G - Pulled back slightly with lighter volume, stubbornly holding its ground near its 52-week high following an impressive streak of volume-driven gains, extended from the previously noted base. Reported Mar '23 quarterly earnings +22% on +20% versus the year-ago period, below the +25% minimum earnings guideline (C criteria) raising some fundamental concerns. See the latest FSU analysis for more details and a new annotated graph.
>>> FEATURED STOCK ARTICLE : Perched Near High Following Noted Volume-Driven Gains - 6/21/2023 |
View all notes |
Set NEW NOTE alert |
Company Profile |
SEC
News |
Chart |
Request a new note
C
A
S
I |
HUBB
-
NYSE
Hubbell
Electrical-Power/Equipmt
|
$322.77
|
+1.71
0.53% |
$326.62
|
295,656
72.46% of 50 DAV
50 DAV is 408,000
|
$322.89
-0.04%
|
4/25/2023
|
$262.85
|
PP = $257.51
|
|
MB = $270.39
|
Most Recent Note - 6/20/2023 5:36:14 PM
G - Posted a gain today with below-average volume for a best-ever close. Very extended from the prior base. Prior highs in the $263 area define initial support to watch on pullbacks. Fundamentals remain strong.
>>> FEATURED STOCK ARTICLE : Extended From Prior Base and Perched Near High - 6/1/2023 |
View all notes |
Set NEW NOTE alert |
Company Profile |
SEC
News |
Chart |
Request a new note
C
A
S
I |
NVR
-
NYSE
NVR
Bldg-Resident/Comml
|
$6,025.40
|
+42.97
0.72% |
$6,030.16
|
14,564
60.68% of 50 DAV
50 DAV is 24,000
|
$6,000.00
0.42%
|
4/25/2023
|
$5,882.18
|
PP = $5,978.25
|
|
MB = $6,277.16
|
Most Recent Note - 6/20/2023 5:40:52 PM
G - There was a "negative reversal" today after hitting a new all-time high, ending near the session low with a loss backed by +17% above-average volume. Its 50 DMA line ($5,781) defines near-term support above the recent low ($5,520 on 6/01/23). Reported Mar '23 quarterly earnings -14% on -3% sales revenues versus the year-ago period, below the +25% minimum earnings guideline (C criteria) raising fundamental concerns, and its color code was changed to green. Prior quarterly comparisons were well above the +25% minimum earnings guideline (C criteria). Annual earnings (A criteria) growth has been very strong.
>>> FEATURED STOCK ARTICLE : Rebounded Above 50 Day Average With Light Volume Gains - 6/6/2023 |
View all notes |
Set NEW NOTE alert |
Company Profile |
SEC
News |
Chart |
Request a new note
C
A
S
I |
PHM
-
NYSE
PulteGroup
Bldg-Resident/Comml
|
$75.75
|
+0.87
1.16% |
$75.93
|
2,380,309
78.25% of 50 DAV
50 DAV is 3,042,000
|
$74.81
1.26%
|
4/25/2023
|
$65.17
|
PP = $64.01
|
|
MB = $67.21
|
Most Recent Note - 6/20/2023 5:34:36 PM
G - Hit yet another new high with today's gain backed by below-average volume, getting more extended from any sound base. Reported earnings +28% for the Mar '23 quarter versus the year-ago period. Important support to watch is defined by its 50 DMA line ($67.06) and recent low.
>>> FEATURED STOCK ARTICLE : Rebounded Above "Max Buy" Level Toward Recent High - 6/2/2023 |
View all notes |
Set NEW NOTE alert |
Company Profile |
SEC
News |
Chart |
Request a new note
C
A
S
I |
COKE
-
NASDAQ
Coca-Cola Consolidated
Beverages-Non-Alcoholic
|
$664.00
|
+10.34
1.58% |
$664.00
|
33,631
90.89% of 50 DAV
50 DAV is 37,000
|
$694.20
-4.35%
|
5/4/2023
|
$646.66
|
PP = $656.21
|
|
MB = $689.02
|
Most Recent Note - 6/21/2023 7:16:46 PM
Y - Posted a small gain today with below-average volume. Recent lows in the $625 area define important near-term support above its 50 DMA line ($623). Fundamentals remain strong.
>>> FEATURED STOCK ARTICLE : Fell Below Pivot Point With Recent Volume-Driven Losses - 6/14/2023 |
View all notes |
Set NEW NOTE alert |
Company Profile |
SEC
News |
Chart |
Request a new note
C
A
S
I |
Symbol/Exchange
Company Name
Industry Group |
PRICE |
CHANGE
(%Change) |
Day High |
Volume
(% DAV)
(% 50 day avg vol) |
52 Wk Hi
% From Hi |
Featured
Date |
Price
Featured |
Pivot Featured |
|
Max Buy |
AMPH
-
NASDAQ
Amphastar Pharm
Medical-Biomed/Biotech
|
$56.36
|
+0.57
1.02% |
$56.61
|
463,706
104.44% of 50 DAV
50 DAV is 444,000
|
$55.61
1.35%
|
5/15/2023
|
$43.56
|
PP = $44.15
|
|
MB = $46.36
|
Most Recent Note - 6/20/2023 12:10:30 PM
G - Hit yet another new high with today's 4th consecutive gain backed by above average volume, getting very extended from any sound base. Prior highs in the $44 area define initial support to watch above its 50 DMA line ($42.80) on pullbacks. Fundamentals remain strong.
>>> FEATURED STOCK ARTICLE : Hit Another New High With 4th Consecutive Volume-Driven Gain - 6/20/2023 |
View all notes |
Set NEW NOTE alert |
Company Profile |
SEC
News |
Chart |
Request a new note
C
A
S
I |
ANET
-
NYSE
Arista Networks
Computer-Networking
|
$151.51
|
-2.99
-1.94% |
$154.27
|
3,308,555
97.92% of 50 DAV
50 DAV is 3,379,000
|
$178.36
-15.05%
|
5/30/2023
|
$176.35
|
PP = $171.54
|
|
MB = $180.12
|
Most Recent Note - 6/21/2023 7:15:08 PM
G - Color code is changed to green after slumping below its 50 DMA line ($153.62) with near-average volume behind today's 4th consecutive loss. Only a prompt rebound above the 50 DMA line would help its outlook improve. Fundamentals remain strong.
>>> FEATURED STOCK ARTICLE : Rebounding Near Recent High With 3 Consecutive Gains - 6/12/2023 |
View all notes |
Set NEW NOTE alert |
Company Profile |
SEC
News |
Chart |
Request a new note
C
A
S
I |
PANW
-
NASDAQ
Palo Alto Networks
Computer Sftwr-Security
|
$238.92
|
-2.68
-1.11% |
$242.43
|
5,027,139
88.82% of 50 DAV
50 DAV is 5,660,000
|
$247.70
-3.54%
|
6/5/2023
|
$228.35
|
PP = $213.73
|
|
MB = $224.42
|
Most Recent Note - 6/20/2023 12:33:22 PM
G - Pulling back from its all-time high with today's loss following 5 consecutive gains backed by above average volume. Very extended from the prior high ($213) which defines initial support to watch on pullbacks. Fundamentals remain strong.
>>> FEATURED STOCK ARTICLE : Palo Alto Powers to New Highs Again - 6/5/2023 |
View all notes |
Set NEW NOTE alert |
Company Profile |
SEC
News |
Chart |
Request a new note
C
A
S
I |
LSCC
-
NASDAQ
Lattice Semiconductor
Elec-Semicondctor Fablss
|
$85.24
|
-2.03
-2.33% |
$87.60
|
1,343,245
54.69% of 50 DAV
50 DAV is 2,456,000
|
$96.82
-11.96%
|
6/13/2023
|
$91.73
|
PP = $96.92
|
|
MB = $101.77
|
Most Recent Note - 6/21/2023 7:19:06 PM
Y - Pulled back with light volume behind today's 4th consecutive loss testing its 50 DMA line ($84.86) and ending -12% off its all-time high. More damaging losses would raise concerns. Subsequent gains above the pivot point backed by at least +40% above average volume may trigger a technical buy signal. Reported Mar '23 quarterly earnings +38% on +22% sales revenues versus the year-ago period, its 9th consecutive strong quarterly comparison above the +25% minimum earnings guideline (C criteria). Annual earnings history (A criteria) has been strong.
>>> FEATURED STOCK ARTICLE : Lattice Posts Volume-Driven Gains Approaching Prior High - 6/13/2023 |
View all notes |
Set NEW NOTE alert |
Company Profile |
SEC
News |
Chart |
Request a new note
C
A
S
I |
|
|
|
THESE ARE NOT BUY RECOMMENDATIONS!
Comments contained in the body of this report are technical
opinions only. The material herein has been obtained
from sources believed to be reliable and accurate, however,
its accuracy and completeness cannot be guaranteed.
This site is not an investment advisor, hence it does
not endorse or recommend any securities or other investments.
Any recommendation contained in this report may not
be suitable for all investors and it is not to be deemed
an offer or solicitation on our part with respect to
the purchase or sale of any securities. All trademarks,
service marks and trade names appearing in this report
are the property of their respective owners, and are
likewise used for identification purposes only.
This report is a service available
only to active Paid Premium Members.
You may opt-out of receiving report notifications
at any time. Questions or comments may be submitted
by writing to Premium Membership Services 665 S.E. 10 Street, Suite 201 Deerfield Beach, FL 33441-5634 or by calling 1-800-965-8307
or 954-785-1121.
|
|
|