You are not logged in.
This means you
CAN ONLY VIEW reports that were published prior to Thursday, April 17, 2025.
You
MUST UPGRADE YOUR MEMBERSHIP if you want to see any current reports.
AFTER MARKET UPDATE - THURSDAY, JUNE 8TH, 2023
Previous After Market Report Next After Market Report >>>
|
|
|
|
DOW |
+168.59 |
33,833.61 |
+0.50% |
|
Volume |
837,088,147 |
-18% |
|
Volume |
4,406,580,000 |
-17% |
|
NASDAQ |
+133.63 |
13,238.52 |
+1.02% |
|
Advancers |
1,405 |
49% |
|
Advancers |
2,255 |
51% |
|
S&P 500 |
+26.41 |
4,293.93 |
+0.62% |
|
Decliners |
1,488 |
51% |
|
Decliners |
2,140 |
49% |
|
Russell 2000 |
-7.67 |
1,880.78 |
-0.41% |
|
52 Wk Highs |
85 |
|
|
52 Wk Highs |
86 |
|
|
S&P 600 |
-7.70 |
1,211.46 |
-0.63% |
|
52 Wk Lows |
17 |
|
|
52 Wk Lows |
62 |
|
|
 |
Major Indices Rose But Small Caps Sputtered Lower
Kenneth J. Gruneisen - Passed the CAN SLIM® Master's Exam
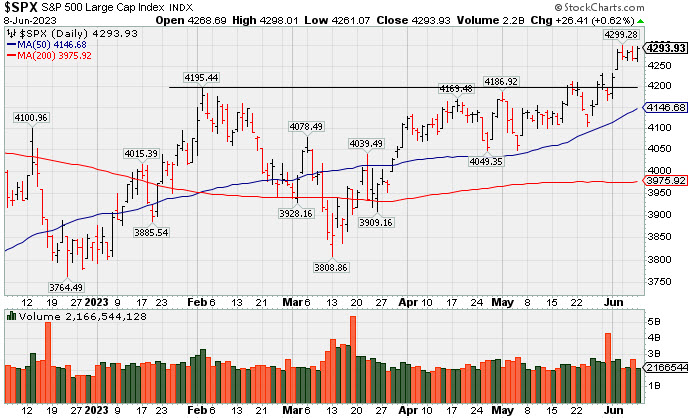
The Dow increased 168 points (0.5%) and S&P 500 rose 0.6% while the Nasdaq Composite gained 1.0%. Volume totals reported were lower on the NYSE and on the Nasdaq exchange versus the prior session. Breadth was fairly even with decliners leading advancers by a narrow margin on the NYSE and advancers leading decliners just slightly on the Nasdaq exchange. There were 45 high-ranked companies from the Leaders List that hit a new 52-week high and were listed on the BreakOuts Page, versus the total of 110 on the prior session. New 52-week highs totals contracted but still outnumbered new 52-week lows totals on the NYSE and on the Nasdaq exchange. The major indices are in a confirmed uptrend (M criteria). Appropriate new buying efforts may be considered under the fact-based investment system.
PICTURED: The S&P 500 Index posted a gain with lighter volume for a new 2023 high close. The benchmark index is up +11.8% year-to-date.
Seven of 11 sectors finished in positive territory U.S. equities rose on Thursday led by technology stocks moving higher. Bond yields declined along with the dollar. Market movements were in part driven by new data releases providing new insights on the labor market today. Weekly initial jobless claims surged 12% higher to 261,000, outpacing the anticipated 235,000 new claims. On the other hand, continuing claims declined and came in below the anticipated level. The weekly data can be choppy, however, a four-week moving average of initial claims still showed an increase beating expectations. The resilient labor market seems to be showing signs of cooling, adding to market anticipation that the Federal Reserve (Fed) may pause hiking rates next week.
Treasury yields moved lower. The yield on the benchmark 10-year note dropped eight basis points (0.08%) to 3.71%, while the 30-year bond yield decreased six basis points (0.06%) to 3.88%. The yield on the two-year note, which is more sensitive to changes in Fed policy, decreased by five basis points (0.05%) to 4.51%. In commodities, West Texas Intermediate (WTI) crude dropped to $70.97/barrel. False reporting had indicated that the U.S. and Iran may be nearing a deal on oil exports. However, the White House announced the information as false ahead of a drop in oil prices.
|
 Kenneth J. Gruneisen started out as a licensed stockbroker in August 1987, a couple of months prior to the historic stock market crash that took the Dow Jones Industrial Average down -22.6% in a single day. He has published daily fact-based fundamental and technical analysis on high-ranked stocks online for two decades. Through FACTBASEDINVESTING.COM, Kenneth provides educational articles, news, market commentary, and other information regarding proven investment systems that work in good times and bad.
Comments contained in the body of this report are technical opinions only and are not necessarily those of Gruneisen Growth Corp. The material herein has been obtained from sources believed to be reliable and accurate, however, its accuracy and completeness cannot be guaranteed. Our firm, employees, and customers may effect transactions, including transactions contrary to any recommendation herein, or have positions in the securities mentioned herein or options with respect thereto. Any recommendation contained in this report may not be suitable for all investors and it is not to be deemed an offer or solicitation on our part with respect to the purchase or sale of any securities. |
|
 |
Retail, Tech, and Gold & Silver Indexes Rose
Kenneth J. Gruneisen - Passed the CAN SLIM® Master's Exam
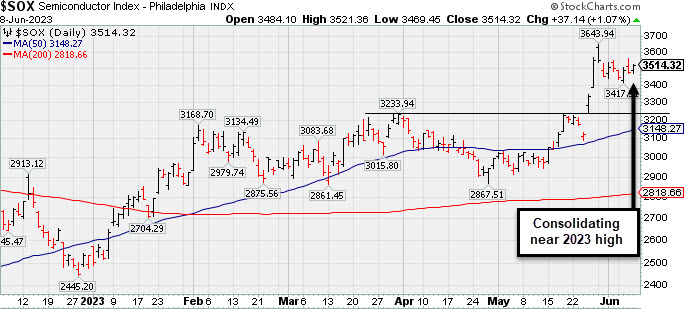
The Retail ($RLX +1.50%) posted a solid gain while the Broker/Dealer ($XBD +0.11%) posted small gain and the Bank ($BKX -0.46%) edged lower. The tech sector had a positive bias as the Semiconductor ($SOX +1.07%) and Biotech ($BTK +0.46%) both outpaced the Networking ($NWX +0.18%). The Gold & Silver $XAU (+1.17%) posted a solid gain while the Oil Services ($OSX +0.10%) inched higher but the Integrated Oil ($XOI -0.39%) edged lower.
PICTURED: The Semiconductor ($SOX +1.07%) posted a solid gain on Thursday, consolidating near its 2023 high.
| Oil Services |
$OSX |
77.91 |
+0.08 |
+0.10% |
-7.09% |
| Integrated Oil |
$XOI |
1,683.26 |
-6.67 |
-0.39% |
-5.82% |
| Semiconductor |
$SOX |
3,514.32 |
+37.14 |
+1.07% |
+38.79% |
| Networking |
$NWX |
800.18 |
+1.40 |
+0.18% |
+2.15% |
| Broker/Dealer |
$XBD |
464.66 |
+0.53 |
+0.11% |
+3.46% |
| Retail |
$RLX |
3,307.46 |
+48.85 |
+1.50% |
+20.10% |
| Gold & Silver |
$XAU |
125.49 |
+1.45 |
+1.17% |
+3.83% |
| Bank |
$BKX |
82.56 |
-0.37 |
-0.45% |
-18.14% |
| Biotech |
$BTK |
5,405.39 |
+24.83 |
+0.46% |
+2.35% |
|
|
|
 |
Graphic Packaging Hits New High With 6th Consecutive Gain
Kenneth J. Gruneisen - Passed the CAN SLIM® Master's Exam
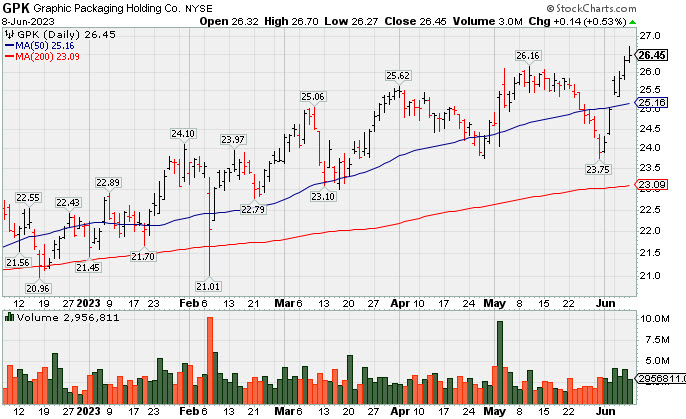
Graphic Packaging Hldg (GPK +$0.14 or +0.53% to $26.45) hit a new all-time high with today's 6th consecutive gain. It did not form a sound new base of sufficient length but quickly recovered after testing its 4/27/23 low last week.
GPK was last shown in this FSU section on 4/10/23 with an annotated graph under the headline, "Packaging Firm Due to Report Earnings News". It was highlighted in yellow with pivot point cited based on its 9/12/22 high plus 10 cents in the 10/25/22 mid-day report (read here). It has an 98 Earnings Per Share Rating. It reported Mar '23 quarterly earnings +60% on +9% sales revenues versus the year ago period. The past 5 quarterly comparisons were well above the +25% minimum earnings guideline (C criteria). Its annual earnings history has been good, meeting the fact-based investment system's fundamental guidelines (A criteria).
The Paper & Paper Products group is ranked 188th on the 197 Industry Groups list and it has a E (6) Group Relative Strength Rating, not reassuring concerning the L criteria. The number of top-rated funds owning its shares rose from 596 in Sep '21 to 825 in Mar '23, a reassuring sign concerning the I criteria. Its current Up/Down Volume Ratio of 1.3 is an unbiased indication its shares have been under accumulation over the past 50 days.
|
|
|
Color Codes Explained :
Y - Better candidates highlighted by our
staff of experts.
G - Previously featured
in past reports as yellow but may no longer be buyable under the
guidelines.
***Last / Change / Volume data in this table is the closing quote data***
Symbol/Exchange
Company Name
Industry Group |
PRICE |
CHANGE
(%Change) |
Day High |
Volume
(% DAV)
(% 50 day avg vol) |
52 Wk Hi
% From Hi |
Featured
Date |
Price
Featured |
Pivot Featured |
|
Max Buy |
 GPK
-
NYSE
GPK
-
NYSE
Graphic Packaging
Paper and Paper Products
|
$26.45
|
+0.14
0.51% |
$26.70
|
1,803,537
64.05% of 50 DAV
50 DAV is 2,816,000
|
$26.44
0.02%
|
10/25/2022
|
$22.75
|
PP = $24.17
|
|
MB = $25.38
|
Most Recent Note - 6/6/2023 3:24:17 PM
G - Rebounded above its 50 DMA line ($25.11) and it is perched within close striking distance of its all-time high with today's 4th consecutive gain. It has not formed a sound new base of sufficient length. Quickly recovered after testing its 4/27/23 low last week. Reported Mar '23 quarterly earnings +60% on +9% sales revenues versus the year-ago period.
>>> FEATURED STOCK ARTICLE : Packaging Firm Due to Report Earnings News - 5/1/2023 |
View all notes |
Set NEW NOTE alert |
Company Profile |
SEC
News |
Chart |
Request a new note
C
A
S
I |
STRL
-
NASDAQ
Sterling Infrastructure
Bldg-Heavy Construction
|
$53.23
|
-0.13
-0.24% |
$53.46
|
216,391
86.56% of 50 DAV
50 DAV is 250,000
|
$53.53
-0.56%
|
12/14/2022
|
$32.41
|
PP = $33.72
|
|
MB = $35.41
|
Most Recent Note - 6/7/2023 5:19:22 PM
G - Hit yet another new all-time high with today's 14th gain in the span of 15 sessions, very extended from any sound base. Mar '23 quarterly earnings were below the +25% minimum guideline (C criteria). See the latest FSU analysis for more details and a new annotated graph.
>>> FEATURED STOCK ARTICLE : Impressive Streak of Gains for New Highs - 6/7/2023 |
View all notes |
Set NEW NOTE alert |
Company Profile |
SEC
News |
Chart |
Request a new note
C
A
S
I |
FIX
-
NYSE
Comfort Systems USA
Bldg-A/C and Heating Prds
|
$158.93
|
+0.78
0.49% |
$159.72
|
86,455
30.77% of 50 DAV
50 DAV is 281,000
|
$161.94
-1.86%
|
4/27/2023
|
$148.85
|
PP = $152.23
|
|
MB = $159.84
|
Most Recent Note - 6/6/2023 3:10:24 PM
Y - Hitting a new all-time high and approaching its "max buy" level with today's big gain backed by light volume. No resistance remains due to overhead supply, however, it has made very little headway in recent weeks. It was repeatedly noted - "Subsequent gains and new highs backed by at least +40% above average volume may help reconfirm a technical buy signal."
>>> FEATURED STOCK ARTICLE : Churning Action While Recently Hovering Near All-Time High - 5/12/2023 |
View all notes |
Set NEW NOTE alert |
Company Profile |
SEC
News |
Chart |
Request a new note
C
A
S
I |
KOF
-
NYSE
Coca-Cola Femsa ADR
Beverages-Non-Alcoholic
|
$87.54
|
+0.66
0.76% |
$87.89
|
91,407
46.40% of 50 DAV
50 DAV is 197,000
|
$91.23
-4.04%
|
3/7/2023
|
$76.63
|
PP = $77.11
|
|
MB = $80.97
|
Most Recent Note - 6/7/2023 12:28:24 PM
G - On track today for a 5th consecutive gain after finding support near its 50 DMA line ($84.79). Recent lows in the $81.50 area define the next important support to watch below its 50 DMA line. Reported Mar '23 quarterly earnings +53% on +24% sales revenues versus the year-ago period.
>>> FEATURED STOCK ARTICLE : Posted Gain Afrer Reporting Strong Mar '23 Quarterly Results - 5/2/2023 |
View all notes |
Set NEW NOTE alert |
Company Profile |
SEC
News |
Chart |
Request a new note
C
A
S
I |
CLH
-
NYSE
Clean Harbors
Pollution Control
|
$158.43
|
+2.35
1.51% |
$158.50
|
241,898
63.32% of 50 DAV
50 DAV is 382,000
|
$156.47
1.25%
|
3/10/2023
|
$136.89
|
PP = $136.74
|
|
MB = $143.58
|
Most Recent Note - 6/6/2023 3:20:35 PM
G - Hitting yet another new all-time high with today's big gain backed by below average volume. Its 50 DMA line ($141) defines near-term support to watch on pullbacks. Reported Mar '23 quarterly earnings +64% on +12% sales revenues versus the year-ago period. Fundamentals remain strong.
>>> FEATURED STOCK ARTICLE : Showed Resilience Near 50-Day Moving Average Following Sell-Off - 5/10/2023 |
View all notes |
Set NEW NOTE alert |
Company Profile |
SEC
News |
Chart |
Request a new note
C
A
S
I |
Symbol/Exchange
Company Name
Industry Group |
PRICE |
CHANGE
(%Change) |
Day High |
Volume
(% DAV)
(% 50 day avg vol) |
52 Wk Hi
% From Hi |
Featured
Date |
Price
Featured |
Pivot Featured |
|
Max Buy |
SPSC
-
NASDAQ
SPS Commerce
Comp Sftwr-Spec Enterprs
|
$171.05
|
+1.77
1.05% |
$171.13
|
75,532
51.04% of 50 DAV
50 DAV is 148,000
|
$171.77
-0.42%
|
4/24/2023
|
$150.01
|
PP = $157.56
|
|
MB = $165.44
|
Most Recent Note - 6/6/2023 3:16:49 PM
G - Color code is changed to green while rising above its "max buy" level and hitting a new 52-week high with today's 4th consecutive gain backed by near average volume. Gains above the pivot point were not backed by +40% above average volume, so it did not trigger a proper technical buy signal. Reported Mar '23 quarterly earnings +22% on +20% versus the year-ago period, below the +25% minimum earnings guideline (C criteria) raising some fundamental concerns.
>>> FEATURED STOCK ARTICLE : Pulled Back After Quietly Wedging to New Highs - 5/31/2023 |
View all notes |
Set NEW NOTE alert |
Company Profile |
SEC
News |
Chart |
Request a new note
C
A
S
I |
HUBB
-
NYSE
Hubbell
Electrical-Power/Equipmt
|
$305.97
|
+1.47
0.48% |
$306.41
|
166,164
41.44% of 50 DAV
50 DAV is 401,000
|
$305.48
0.16%
|
4/25/2023
|
$262.85
|
PP = $257.51
|
|
MB = $270.39
|
Most Recent Note - 6/7/2023 5:20:35 PM
G - Gain today with average volume hit yet another new all-time high, getting more extended from the prior base. Prior highs in the $263 area define initial support to watch on pullbacks. Fundamentals remain strong.
>>> FEATURED STOCK ARTICLE : Extended From Prior Base and Perched Near High - 6/1/2023 |
View all notes |
Set NEW NOTE alert |
Company Profile |
SEC
News |
Chart |
Request a new note
C
A
S
I |
NVR
-
NYSE
NVR
Bldg-Resident/Comml
|
$5,800.00
|
+28.88
0.50% |
$5,829.39
|
7,938
34.51% of 50 DAV
50 DAV is 23,000
|
$5,986.96
-3.12%
|
4/25/2023
|
$5,882.18
|
PP = $5,978.25
|
|
MB = $6,277.16
|
Most Recent Note - 6/6/2023 5:16:26 PM
G - Rebounded further above its 50 DMA line ($5,707) with today's light volume gain helping its technical stance. Reported Mar '23 quarterly earnings -14% on -3% sales revenues versus the year-ago period, below the +25% minimum earnings guideline (C criteria) raising fundamental concerns, and its color code was changed to green. Prior quarterly comparisons were well above the +25% minimum earnings guideline (C criteria). Annual earnings (A criteria) growth has been very strong. See the latest FSU analysis for more details and a new annotated graph.
>>> FEATURED STOCK ARTICLE : Rebounded Above 50 Day Average With Light Volume Gains - 6/6/2023 |
View all notes |
Set NEW NOTE alert |
Company Profile |
SEC
News |
Chart |
Request a new note
C
A
S
I |
PHM
-
NYSE
PulteGroup
Bldg-Resident/Comml
|
$71.40
|
-0.18
-0.24% |
$71.86
|
1,042,767
36.09% of 50 DAV
50 DAV is 2,889,000
|
$72.89
-2.05%
|
4/25/2023
|
$65.17
|
PP = $64.01
|
|
MB = $67.21
|
Most Recent Note - 6/6/2023 3:13:08 PM
G - Hitting another new high with today's 4th consecutive gain backed by light volume, getting extended from any sound base. Reported earnings +28% for the Mar '23 quarter versus the year-ago period. Important support to watch is its 50 DMA line ($64.31). See the latest FSU analysis for more details and an annotated graph.
>>> FEATURED STOCK ARTICLE : Rebounded Above "Max Buy" Level Toward Recent High - 6/2/2023 |
View all notes |
Set NEW NOTE alert |
Company Profile |
SEC
News |
Chart |
Request a new note
C
A
S
I |
COKE
-
NASDAQ
Coca-Cola Consolidated
Beverages-Non-Alcoholic
|
$667.03
|
+1.36
0.20% |
$675.00
|
38,598
110.28% of 50 DAV
50 DAV is 35,000
|
$694.20
-3.91%
|
5/4/2023
|
$646.66
|
PP = $656.21
|
|
MB = $689.02
|
 Most Recent Note - 6/8/2023 12:48:26 PM
Y - Pulled back below its "max buy" level with recent volume-driven losses. Recent lows in the $625 area define important near-term support above its 50 DMA line. Fundamentals remain strong.
>>> FEATURED STOCK ARTICLE : COKE is Showing Real Strength - 5/4/2023 |
View all notes |
Set NEW NOTE alert |
Company Profile |
SEC
News |
Chart |
Request a new note
C
A
S
I |
Symbol/Exchange
Company Name
Industry Group |
PRICE |
CHANGE
(%Change) |
Day High |
Volume
(% DAV)
(% 50 day avg vol) |
52 Wk Hi
% From Hi |
Featured
Date |
Price
Featured |
Pivot Featured |
|
Max Buy |
AMPH
-
NASDAQ
Amphastar Pharm
Medical-Biomed/Biotech
|
$46.18
|
+0.27
0.59% |
$46.60
|
164,319
41.08% of 50 DAV
50 DAV is 400,000
|
$46.86
-1.45%
|
5/15/2023
|
$43.56
|
PP = $44.15
|
|
MB = $46.36
|
Most Recent Note - 6/7/2023 5:24:58 PM
Y - Hovering near all-time high and just below "max buy" level stubbornly holding ground. Gain and strong close above the pivot point on 6/02/23 was backed by +55% above average volume clinching a technical buy signal. Fundamentals remain strong.
>>> FEATURED STOCK ARTICLE : Weak Finish After Early Gain When Perched Near All-Time High - 5/15/2023 |
View all notes |
Set NEW NOTE alert |
Company Profile |
SEC
News |
Chart |
Request a new note
C
A
S
I |
ANET
-
NYSE
Arista Networks
Computer-Networking
|
$162.39
|
+6.80
4.37% |
$162.49
|
1,749,466
53.62% of 50 DAV
50 DAV is 3,263,000
|
$178.36
-8.95%
|
5/30/2023
|
$176.35
|
PP = $171.54
|
|
MB = $180.12
|
Most Recent Note - 6/7/2023 5:28:44 PM
Y - Ended near the session low as it suffered a 3rd loss with average volume in the span of 4 sessions. Stalled after recent gains triggered a technical buy signal. Its 50 DMA line ($154) defines important near-term support to watch. Color code was changed to yellow with new pivot point cited based on its 3/23/23 high plus 10 cents in the 5/30/23 mid-day report. Fundamentals remain strong.
>>> FEATURED STOCK ARTICLE : Technical Sell Signal Triggered by Damaging Volume-Driven Loss - 5/3/2023 |
View all notes |
Set NEW NOTE alert |
Company Profile |
SEC
News |
Chart |
Request a new note
C
A
S
I |
PANW
-
NASDAQ
Palo Alto Networks
Computer Sftwr-Security
|
$222.21
|
+5.96
2.76% |
$223.04
|
3,273,089
76.85% of 50 DAV
50 DAV is 4,259,000
|
$230.18
-3.46%
|
6/5/2023
|
$228.35
|
PP = $213.73
|
|
MB = $224.42
|
Most Recent Note - 6/7/2023 5:16:35 PM
Y - Pulled back for a 2nd consecutive loss today backed by higher volume following an impressive streak of 8 straight volume-driven gains. The prior high ($213) defines initial support to watch. Fundamentals remain strong.
>>> FEATURED STOCK ARTICLE : Palo Alto Powers to New Highs Again - 6/5/2023 |
View all notes |
Set NEW NOTE alert |
Company Profile |
SEC
News |
Chart |
Request a new note
C
A
S
I |
|
|
|
THESE ARE NOT BUY RECOMMENDATIONS!
Comments contained in the body of this report are technical
opinions only. The material herein has been obtained
from sources believed to be reliable and accurate, however,
its accuracy and completeness cannot be guaranteed.
This site is not an investment advisor, hence it does
not endorse or recommend any securities or other investments.
Any recommendation contained in this report may not
be suitable for all investors and it is not to be deemed
an offer or solicitation on our part with respect to
the purchase or sale of any securities. All trademarks,
service marks and trade names appearing in this report
are the property of their respective owners, and are
likewise used for identification purposes only.
This report is a service available
only to active Paid Premium Members.
You may opt-out of receiving report notifications
at any time. Questions or comments may be submitted
by writing to Premium Membership Services 665 S.E. 10 Street, Suite 201 Deerfield Beach, FL 33441-5634 or by calling 1-800-965-8307
or 954-785-1121.
|
|
|