***Last / Change / Volume data in this table is the closing quote data***
Symbol/Exchange
Company Name
Industry Group |
PRICE |
CHANGE
(%Change) |
Day High |
Volume
(% DAV)
(% 50 day avg vol) |
52 Wk Hi
% From Hi |
Featured
Date |
Price
Featured |
Pivot Featured |
|
Max Buy |
 SIVB
-
NASDAQ
SIVB
-
NASDAQ
S V B Financial Group
BANKING - Regional - Pacific Banks
|
$572.93
|
+8.30
1.47% |
$573.51
|
487,817
86.95% of 50 DAV
50 DAV is 561,000
|
$586.78
-2.36%
|
4/23/2021
|
$579.70
|
PP = $577.16
|
|
MB = $606.02
|
Most Recent Note - 4/29/2021 5:57:46 PM
Y - Posted another small gain today with below average volume, wedging higher. Confirming volume-driven gains are needed to help clinch a convincing technical buy signal. Bullish action came after it reported earnings +293% on +64% sales revenues for the Mar '21 quarter versus the year ago period, its 3rd strong comparison. Completed a new Public Offering on 3/24/21.
>>> FEATURED STOCK ARTICLE : Hit New High But Closed Below Pivot Point - 4/23/2021 |
View all notes |
Set NEW NOTE alert |
Company Profile |
SEC
News |
Chart |
Request a new note
C
A
S
I |
CROX
-
NASDAQ
Crocs Inc
CONSUMER NON-DURABLES - Textile - Apparel Footwear
|
$103.70
|
+5.57
5.68% |
$104.00
|
2,066,838
153.21% of 50 DAV
50 DAV is 1,349,000
|
$102.85
0.83%
|
4/27/2021
|
$99.81
|
PP = $86.50
|
|
MB = $90.83
|
 Most Recent Note - 5/4/2021 5:46:16 PM
G - Hit another new all-time high with today's volume-driven gain, getting very extended from the latest base. Prior highs in the $86 area define initial support to watch on pullbacks.
>>> FEATURED STOCK ARTICLE : Powerful "Breakaway Gap" for CROX - 4/27/2021 |
View all notes |
Set NEW NOTE alert |
Company Profile |
SEC
News |
Chart |
Request a new note
C
A
S
I |
CRL
-
NYSE
Charles River Labs Intl
DRUGS - Biotechnology
|
$338.96
|
+7.01
2.11% |
$343.47
|
652,947
216.93% of 50 DAV
50 DAV is 301,000
|
$337.48
0.44%
|
12/17/2020
|
$247.06
|
PP = $257.98
|
|
MB = $270.88
|
Most Recent Note - 5/4/2021 12:15:21 PM
G - Hitting another new all-time high with today's gain, extended from any sound base. Its 50 DMA line ($300) acted as support throughout its ongoing ascent. Reported Mar '21 quarterly earnings +38% on +17%v sales revenues versus the year ago period. Two of the past 3 quarterly comparisons have been above the +25% minimum earnings guideline (C criteria).
>>> FEATURED STOCK ARTICLE : Perched at Record High After Rally From 50-Day Moving Average - 4/9/2021 |
View all notes |
Set NEW NOTE alert |
Company Profile |
SEC
News |
Chart |
Request a new note
C
A
S
I |
CAMT
-
NASDAQ
Camtek Ltd
ELECTRONICS - Scientific and Technical Instrum
|
$31.78
|
-1.88
-5.59% |
$33.39
|
358,816
116.50% of 50 DAV
50 DAV is 308,000
|
$36.14
-12.06%
|
4/28/2021
|
$35.03
|
PP = $35.34
|
|
MB = $37.11
|
Most Recent Note - 5/4/2021 5:44:58 PM
Y - Volume was higher behind today's 4th consecutive loss, action indicative of distributional pressure. Subsequent gains and a strong close above the pivot point backed by at least +40% above average volume are needed to trigger a technical buy signal. Completed a new Public Offering on 11/19/20. Found prompt support near its 50 DMA line ($30.66) during recent consolidations. Reported earnings +267% on +90% sales revenues for the Mar '21 quarter versus the year ago period, its 3rd strong quarterly comparison well above the +25% minimum guideline and showing impressive sequential acceleration. This Israeli Electronics firm has a strong annual earnings (A criteria) history.
>>> FEATURED STOCK ARTICLE : Earnings Acceleration and Perched at High After Ascending Base - 4/28/2021 |
View all notes |
Set NEW NOTE alert |
Company Profile |
SEC
News |
Chart |
Request a new note
C
A
S
I |
BRKS
-
NASDAQ
Brooks Automation
ELECTRONICS - Semiconductor Equipment and Mate
|
$92.51
|
-5.45
-5.56% |
$96.06
|
1,116,417
148.66% of 50 DAV
50 DAV is 751,000
|
$108.72
-14.91%
|
4/5/2021
|
$99.31
|
PP = $91.88
|
|
MB = $96.47
|
Most Recent Note - 5/4/2021 5:41:59 PM
Y - Volume was above average behind today's 4th consecutive loss. Color code is changed to yellow while testing support near prior highs in the $91 area and its 50 DMA line ($89.92). More damaging losses would raise concerns and trigger technical sell signals.
>>> FEATURED STOCK ARTICLE : Extended From Base and Consolidating After Recent Rally - 4/30/2021 |
View all notes |
Set NEW NOTE alert |
Company Profile |
SEC
News |
Chart |
Request a new note
C
A
S
I |
Symbol/Exchange
Company Name
Industry Group |
PRICE |
CHANGE
(%Change) |
Day High |
Volume
(% DAV)
(% 50 day avg vol) |
52 Wk Hi
% From Hi |
Featured
Date |
Price
Featured |
Pivot Featured |
|
Max Buy |
ENTG
-
NASDAQ
Entegris Inc
ELECTRONICS - Semiconductor Equipment and Mate
|
$108.89
|
-2.47
-2.22% |
$111.61
|
1,259,587
136.04% of 50 DAV
50 DAV is 925,900
|
$126.41
-13.86%
|
4/1/2021
|
$118.42
|
PP = $110.37
|
|
MB = $115.89
|
Most Recent Note - 5/4/2021 5:50:12 PM
G - Color code is changed to green after a volume-driven loss today, slumping below the prior high in the $110 area and closing below its 50 DMA line ($109.54). Only a prompt rebound would help its outlook improve.
>>> FEATURED STOCK ARTICLE : Negated Recent Breakout and Sputtering Near Prior High - 4/22/2021 |
View all notes |
Set NEW NOTE alert |
Company Profile |
SEC
News |
Chart |
Request a new note
C
A
S
I |
OPY
-
NYSE
Oppenheimer Holdings Inc
FINANCIAL SERVICES - Investment Brokerage - Regiona
|
$48.99
|
-1.76
-3.47% |
$51.03
|
191,446
151.94% of 50 DAV
50 DAV is 126,000
|
$52.45
-6.60%
|
2/25/2021
|
$38.95
|
PP = $38.11
|
|
MB = $40.02
|
Most Recent Note - 5/4/2021 12:40:38 PM
G - Powered higher in recent weeks and it is very extended from any sound base. Bullish action came after it reported Mar '21 quarterly earnings +402% on +59% sales revenues versus the year ago period. Prior high in the $44 area defines initial support to watch above its 50 DMA line ($42.67).
>>> FEATURED STOCK ARTICLE : Negative Reversal After 7 Consecutive Gains - 4/20/2021 |
View all notes |
Set NEW NOTE alert |
Company Profile |
SEC
News |
Chart |
Request a new note
C
A
S
I |
LAD
-
NYSE
Lithia Motors Inc Cl A
SPECIALTY RETAIL - Auto Dealerships
|
$390.04
|
-0.18
-0.05% |
$390.18
|
180,787
59.47% of 50 DAV
50 DAV is 304,000
|
$417.98
-6.68%
|
4/21/2021
|
$377.00
|
PP = $418.08
|
|
MB = $438.98
|
Most Recent Note - 5/4/2021 5:52:09 PM
Y - Volume totals have been cooling while consolidating in an orderly fashion near its 50 DMA line ($386). Subsequent gains above the pivot point backed by at least +40% above average volume may trigger a technical buy signal.
>>> FEATURED STOCK ARTICLE : Building a Base With Rebound Above 50-Day Moving Average - 4/21/2021 |
View all notes |
Set NEW NOTE alert |
Company Profile |
SEC
News |
Chart |
Request a new note
C
A
S
I |
CLFD
-
NASDAQ
Clearfield Inc
TELECOMMUNICATIONS - Cables / Satalite Equipment
|
$36.09
|
+0.43
1.21% |
$36.36
|
172,056
121.17% of 50 DAV
50 DAV is 142,000
|
$40.26
-10.36%
|
4/26/2021
|
$39.68
|
PP = $38.85
|
|
MB = $40.79
|
Most Recent Note - 5/3/2021 6:17:41 PM
Y - Posted a gain today, halting a streak of 4 consecutive losses. More damaging losses would raise greater concerns while it is sputtering back below the prior high. Fundamentals remain strong after it reported Mar '21 quarterly earnings +440% on +45% sales revenues versus the year ago period, continuing its strong earnings track record.
>>> FEATURED STOCK ARTICLE : Rallied Straight Up From Bottom of 10-Week Base - 4/26/2021 |
View all notes |
Set NEW NOTE alert |
Company Profile |
SEC
News |
Chart |
Request a new note
C
A
S
I |
EDUC
-
NASDAQ
Educational Development
WHOLESALE - Basic Materials Wholesale
|
$17.75
|
-0.07
-0.39% |
$17.79
|
6,048
23.26% of 50 DAV
50 DAV is 26,000
|
$20.00
-11.25%
|
3/10/2021
|
$17.89
|
PP = $20.10
|
|
MB = $21.11
|
Most Recent Note - 5/4/2021 5:47:42 PM
Y - Volume totals have been cooling while consolidating above its 50 DMA line ($17.32) which defines important near-term support. Met stubborn resistance in the $19-20 area. Subsequent gains above the pivot point backed by at least +40% above average volume are needed to trigger a proper technical buy signal.
>>> FEATURED STOCK ARTICLE : Finding Support During Consolidation Above 50-Day Moving Average - 4/16/2021 |
View all notes |
Set NEW NOTE alert |
Company Profile |
SEC
News |
Chart |
Request a new note
C
A
S
I |
Symbol/Exchange
Company Name
Industry Group |
PRICE |
CHANGE
(%Change) |
Day High |
Volume
(% DAV)
(% 50 day avg vol) |
52 Wk Hi
% From Hi |
Featured
Date |
Price
Featured |
Pivot Featured |
|
Max Buy |
SMPL
-
NASDAQ
Simply Good Foods Co
Food-Confectionery
|
$33.86
|
-0.31
-0.91% |
$34.02
|
240,946
34.13% of 50 DAV
50 DAV is 706,000
|
$35.34
-4.19%
|
12/28/2020
|
$30.40
|
PP = $31.44
|
|
MB = $33.01
|
Most Recent Note - 4/30/2021 5:41:18 PM
G - Perched at its all-time high with volume totals cooling. Reported Feb '21 quarterly earnings +9% on +2% sales revenues versus the year ago period, below the +25% minimum earnings guideline (C criteria), raising fundamental concerns. Found prompt support near its 50 DMA line ($31.66) but its current Relative Strength Rating is 79, one notch below the 80+ minimum guideline for buy candidates.
>>> FEATURED STOCK ARTICLE : Perched Near High But Fundamental Concerns Were Raised - 4/14/2021 |
View all notes |
Set NEW NOTE alert |
Company Profile |
SEC
News |
Chart |
Request a new note
C
A
S
I |
IBP
-
NYSE
Installed Building Prod
DIVERSIFIED SERVICES - Business/Management Services
|
$139.59
|
+1.94
1.41% |
$139.82
|
232,789
104.39% of 50 DAV
50 DAV is 223,000
|
$137.96
1.18%
|
4/19/2021
|
$131.15
|
PP = $130.21
|
|
MB = $136.72
|
Most Recent Note - 4/29/2021 5:52:16 PM
Y - Hit a new all-time high with today's gain backed by higher (but below average) volume. A volume-driven gain and strong close above its pivot point on 4/23/21 helped clinch a convincing technical buy signal. Reported earnings +34% on +10% sales revenues for the Dec '20 quarter versus the year-ago period. Three of the past 4 consecutive quarterly comparisons were above the +25% minimum earnings guideline (C criteria). Annual earnings (A criteria) history has been strong.
>>> FEATURED STOCK ARTICLE : Steady Streak of Gains Into New High Territory - 4/19/2021 |
View all notes |
Set NEW NOTE alert |
Company Profile |
SEC
News |
Chart |
Request a new note
C
A
S
I |
QRVO
-
NASDAQ
"Qorvo, Inc"
ELECTRONICS - Semiconductor - Integrated Cir
|
$182.41
|
-2.13
-1.15% |
$183.72
|
1,357,824
120.63% of 50 DAV
50 DAV is 1,125,600
|
$201.68
-9.55%
|
4/1/2021
|
$190.48
|
PP = $191.92
|
|
MB = $201.52
|
Most Recent Note - 4/30/2021 5:34:24 PM
Y - Gapped down today for a big volume-driven loss after again edging higher with gains backed by lighter than average volume. Its 50 DMA line ($182.72) acted as support when it stalled after recently wedging up to new highs from a 9-week base. Its Relative Strength Rating is 73, below the 80+ minimum for buy candidates. See the latest FSU analysis for more details and an annotated graph.
>>> FEATURED STOCK ARTICLE : Quiet Gain For Best Ever Close - 4/29/2021 |
View all notes |
Set NEW NOTE alert |
Company Profile |
SEC
News |
Chart |
Request a new note
C
A
S
I |
YETI
-
NYSE
Yeti Holdings Inc
Leisure-Products
|
$87.57
|
+0.40
0.46% |
$88.20
|
1,257,612
98.33% of 50 DAV
50 DAV is 1,279,000
|
$89.70
-2.37%
|
4/6/2021
|
$76.95
|
PP = $79.42
|
|
MB = $83.39
|
Most Recent Note - 4/30/2021 5:42:45 PM
G - Pulled back today with higher volume after quietly hovering near its all-time high this week, extended from the latest base. Prior highs in the $80 area define initial support to watch on pullbacks.
>>> FEATURED STOCK ARTICLE : Hovering Near Record High Following Volume-Driven Gains - 5/3/2021 |
View all notes |
Set NEW NOTE alert |
Company Profile |
SEC
News |
Chart |
Request a new note
C
A
S
I |
DT
-
NYSE
Dynatrace Inc
Computer Sftwr-Enterprse
|
$48.77
|
-2.05
-4.03% |
$50.12
|
1,759,089
89.23% of 50 DAV
50 DAV is 1,971,400
|
$56.94
-14.35%
|
4/26/2021
|
$54.43
|
PP = $57.04
|
|
MB = $59.89
|
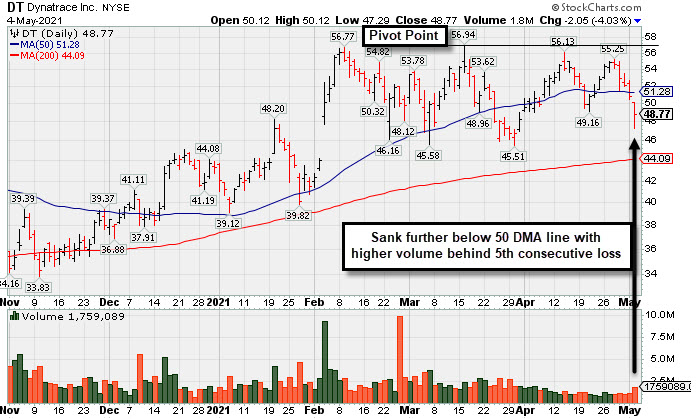
Most Recent Note - 5/4/2021 5:38:56 PM
Volume was higher (near average) behind today's 5th consecutive loss while sinking further below its 50 DMA line raising greater concerns. It will be dropped from the Featured Stocks list tonight. A rebound above the 50 DMA line and subsequent gains above the pivot point backed by at least +40% above average volume are needed to trigger a new (or add-on) technical buy signal. Recent lows in the $45 area define important near-term support to watch on pullbacks. Its Relative Strength Rating is 63, well below the 80+ minimum guideline for buy candidates. See the latest FSU analysis for more details and a new annotated graph.
>>> FEATURED STOCK ARTICLE : Relative Strength Fades With 5th Consecutive Loss - 5/4/2021 |
View all notes |
Set NEW NOTE alert |
Company Profile |
SEC
News |
Chart |
Request a new note
C
A
S
I |
Symbol/Exchange
Company Name
Industry Group |
PRICE |
CHANGE
(%Change) |
Day High |
Volume
(% DAV)
(% 50 day avg vol) |
52 Wk Hi
% From Hi |
Featured
Date |
Price
Featured |
Pivot Featured |
|
Max Buy |
MRBK
-
NASDAQ
Meridian Corp
Banks-Northeast
|
$26.18
|
-0.14
-0.53% |
$26.80
|
19,267
50.70% of 50 DAV
50 DAV is 38,000
|
$27.96
-6.37%
|
2/22/2021
|
$25.58
|
PP = $26.10
|
|
MB = $27.41
|
Most Recent Note - 4/29/2021 12:33:25 PM
Y - Consolidating above its 50 DMA line ($25.71) and perched within striking distance of its 52-week high. Reported Mar '21 earnings +323% on +93% sales revenues versus the year ago period, continuing its strong earnings track record. Recent low ($24.01 on 4/21/21) defines important near-term support where any violation may trigger a worrisome technical sell signal. Its Relative Strength Rating is right at the 80 minimum guideline.
>>> FEATURED STOCK ARTICLE : Encountering Distributional Pressure - 4/12/2021 |
View all notes |
Set NEW NOTE alert |
Company Profile |
SEC
News |
Chart |
Request a new note
C
A
S
I |