You are not logged in.
This means you
CAN ONLY VIEW reports that were published prior to Tuesday, February 11, 2025.
You
MUST UPGRADE YOUR MEMBERSHIP if you want to see any current reports.
AFTER MARKET UPDATE - MONDAY, MAY 3RD, 2021
Previous After Market Report Next After Market Report >>>
|
|
|
|
DOW |
+238.38 |
34,113.23 |
+0.70% |
|
Volume |
888,515,564 |
-26% |
|
Volume |
4,622,201,500 |
-2% |
|
NASDAQ |
-70.36 |
13,892.32 |
-0.50% |
|
Advancers |
2,252 |
68% |
|
Advancers |
2,264 |
54% |
|
S&P 500 |
+11.51 |
4,192.68 |
+0.28% |
|
Decliners |
1,037 |
32% |
|
Decliners |
1,912 |
46% |
|
Russell 2000 |
+11.00 |
2,277.45 |
+0.49% |
|
52 Wk Highs |
374 |
|
|
52 Wk Highs |
204 |
|
|
S&P 600 |
+15.42 |
1,360.96 |
+1.15% |
|
52 Wk Lows |
18 |
|
|
52 Wk Lows |
56 |
|
|
 |
Nasdaq Composite Index Erased Early Gain to Close Lower
Kenneth J. Gruneisen - Passed the CAN SLIM® Master's Exam
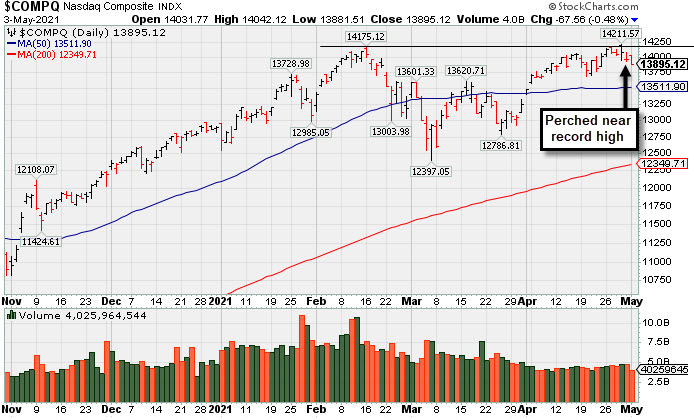
The S&P 500 rose 0.3%, extending upward momentum from April during which the index saw its best monthly performance since November (+5.2%). The Dow climbed 238 points. The Nasdaq Composite erased early morning gains, however, slipping 0.5% as worries surrounding chip production seemed to pressure tech-related shares. The volume totals reported were lighter than the prior session on the NYSE and on the Nasdaq exchange. Breadth was positive as advancers led decliners by more than a 2-1 margin on the NYSE and on the Nasdaq exchange. There were 76 high-ranked companies from the Leaders List that hit new 52-week highs and were listed on the BreakOuts Page, versus the total of 27 on the prior session. New 52-week highs totals expanded and solidly outnumbered new 52-week lows on both the NYSE and the Nasdaq exchange. The major indices (M criteria) are in a confirmed uptrend. Investors are reminded to always make buying and selling decisions on case-by-case basis under the strict criteria and rules of the fact-based investment system.
PICTURED: The Nasdaq Composite Index is perched near its new record high.
U.S. stocks finished mixed on Monday as Wall Street assessed the latest economic data updates and corporate earnings results. On the data front, a report from the Institute for Supply Management (ISM) showed that U.S. manufacturing activity expanded at a slower-than-expected pace, weighed down by ongoing supply chain bottlenecks. Additionally, the ISM’s measure of prices paid for materials surged to the highest level since July 2008 amid input shortages. Treasuries advanced, with the yield on the 10-year note down three basis points to 1.60%. In commodities, WTI crude gained 1.4% to $64.46/barrel amid a weaker dollar and news the European Union planned to lift summer travel restrictions.
Six of 11 S&P 500 sectors closed in positive territory, with the more cyclical and value-oriented groups outperforming. In earnings, Berkshire Hathaway (BRKB +1.60%) rose after the conglomerate posted a 20% jump in first quarter operating income compared to a year ago and disclosed $6.6 billion in share repurchases during the reporting period. Estée Lauder (EL -7.93%) fell following a mixed quarter, with sales impacted by a continuation of people working from home. In other corporate news, Moderna (MRNA +4.03%) rose after agreeing to partner with international organization Gavi to supply as many as 500 million doses of its COVID-19 vaccine. |
 Kenneth J. Gruneisen started out as a licensed stockbroker in August 1987, a couple of months prior to the historic stock market crash that took the Dow Jones Industrial Average down -22.6% in a single day. He has published daily fact-based fundamental and technical analysis on high-ranked stocks online for two decades. Through FACTBASEDINVESTING.COM, Kenneth provides educational articles, news, market commentary, and other information regarding proven investment systems that work in good times and bad.
Comments contained in the body of this report are technical opinions only and are not necessarily those of Gruneisen Growth Corp. The material herein has been obtained from sources believed to be reliable and accurate, however, its accuracy and completeness cannot be guaranteed. Our firm, employees, and customers may effect transactions, including transactions contrary to any recommendation herein, or have positions in the securities mentioned herein or options with respect thereto. Any recommendation contained in this report may not be suitable for all investors and it is not to be deemed an offer or solicitation on our part with respect to the purchase or sale of any securities. |
|
 |
Commodity-Linked Groups Led Gainers
Kenneth J. Gruneisen - Passed the CAN SLIM® Master's Exam
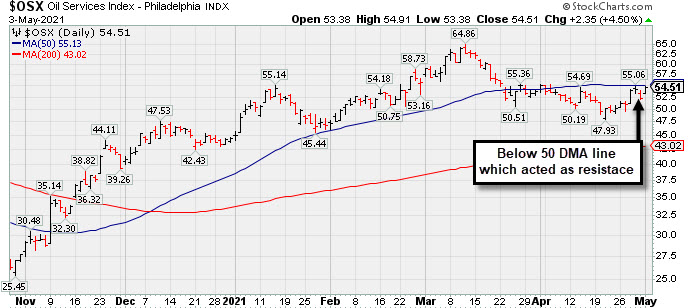
Commodity-linked groups posted standout gains as the Gold & Silver Index ($XAU +4.63%), Oil Services Index ($OSX +4.50%), and Integrated Oil Index ($XOI +2.88%) outpaced other groups. The Retail Index ($RLX -0.65%) and Semiconductor Index ($SOX -1.15%) both edged lower while the Biotech Index ($BTK +0.02%) finished flat and the Networking Index ($NWX +0.32%) eked out a small gain. The Broker/Dealer Index ($XBD +0.14%) and Bank Index ($BKX +0.15%) were little changed.
PICTURED: The Oil Services Index ($OSX +4.50%) is consolidating below its 50-day moving average (DMA) line which has acted as resistance.
| Oil Services |
$OSX |
54.51 |
+2.35 |
+4.50% |
+22.96% |
| Integrated Oil |
$XOI |
1,049.27 |
+29.42 |
+2.88% |
+32.40% |
| Semiconductor |
$SOX |
3,073.38 |
-35.62 |
-1.15% |
+9.94% |
| Networking |
$NWX |
801.28 |
+2.57 |
+0.32% |
+11.74% |
| Broker/Dealer |
$XBD |
461.29 |
+0.62 |
+0.14% |
+22.16% |
| Retail |
$RLX |
3,951.82 |
-25.96 |
-0.65% |
+10.90% |
| Gold & Silver |
$XAU |
148.71 |
+6.58 |
+4.63% |
+3.14% |
| Bank |
$BKX |
127.45 |
+0.20 |
+0.15% |
+30.17% |
| Biotech |
$BTK |
5,613.62 |
+1.20 |
+0.02% |
-2.19% |
|
|
|
 |
Hovering Near Record High Following Volume-Driven Gains
Kenneth J. Gruneisen - Passed the CAN SLIM® Master's Exam
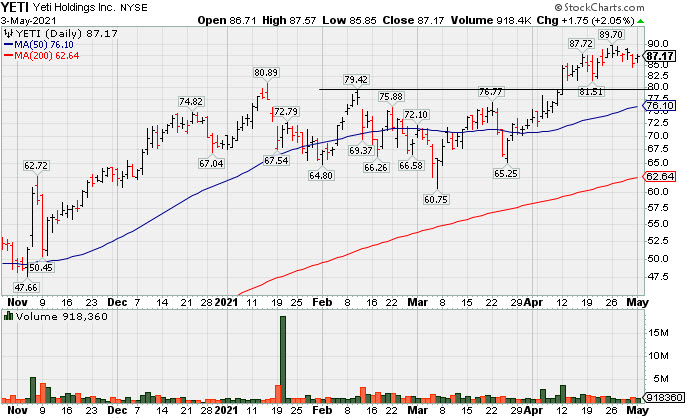
Yeti Holdings Inc (YETI +$1.75 or +2.05% to $87.17) has been quietly hovering near its all-time high, extended from the latest base. Prior highs in the $80 area define initial support to watch above its 50-day moving average (DMA) line ($76.10).
YETI was highlighted in yellow in the 4/06/21 mid-day report (read here) with a new pivot point cited based on its 2/10/21 high while working on a "double bottom" base. It rallied decisively higher since last shown in this FSU section with an annotated graph on 4/07/21 under the headline, "YETI Perched Within Striking Distance of High".
Its Earnings Per Share Rating is 79. It reported Dec '20 quarterly earnings +72% on +26% sales revenues versus the year ago period, its 6th consecutive quarterly earnings increase above the +25% minimum earnings guideline (C criteria) of the fact-based investment system. Its limited annual earnings (A criteria) history was previously noted as a concern. The Leisure-Products group currently has a B (70) Group Relative Strength rating (L criteria) and has been moving up.
There is a small supply of only 87.2 million shares outstanding (S criteria). The number of top-rated funds owning its shares rose from 310 in Dec '19 to 608 in Mar '21, a reassuring sign concerning the I criteria. Its current Up/Down Volume Ratio of 1.7 is an unbiased indication its shares have been under accumulation over the past 50 days. It completed Secondary Offerings on 5/12/20, 2/20/20, 11/08/19 and 5/08/19 after its $18 IPO on 10/25/18.
|
|
|
Color Codes Explained :
Y - Better candidates highlighted by our
staff of experts.
G - Previously featured
in past reports as yellow but may no longer be buyable under the
guidelines.
***Last / Change / Volume data in this table is the closing quote data***
Symbol/Exchange
Company Name
Industry Group |
PRICE |
CHANGE
(%Change) |
Day High |
Volume
(% DAV)
(% 50 day avg vol) |
52 Wk Hi
% From Hi |
Featured
Date |
Price
Featured |
Pivot Featured |
|
Max Buy |
 SIVB
-
NASDAQ
SIVB
-
NASDAQ
S V B Financial Group
BANKING - Regional - Pacific Banks
|
$564.63
|
-7.20
-1.26% |
$580.11
|
340,549
60.81% of 50 DAV
50 DAV is 560,000
|
$586.78
-3.77%
|
4/23/2021
|
$579.70
|
PP = $577.16
|
|
MB = $606.02
|
Most Recent Note - 4/29/2021 5:57:46 PM
Y - Posted another small gain today with below average volume, wedging higher. Confirming volume-driven gains are needed to help clinch a convincing technical buy signal. Bullish action came after it reported earnings +293% on +64% sales revenues for the Mar '21 quarter versus the year ago period, its 3rd strong comparison. Completed a new Public Offering on 3/24/21.
>>> FEATURED STOCK ARTICLE : Hit New High But Closed Below Pivot Point - 4/23/2021 |
View all notes |
Set NEW NOTE alert |
Company Profile |
SEC
News |
Chart |
Request a new note
C
A
S
I |
CROX
-
NASDAQ
Crocs Inc
CONSUMER NON-DURABLES - Textile - Apparel Footwear
|
$98.13
|
-1.99
-1.99% |
$101.41
|
1,334,041
99.93% of 50 DAV
50 DAV is 1,335,000
|
$102.85
-4.59%
|
4/27/2021
|
$99.81
|
PP = $86.50
|
|
MB = $90.83
|
 Most Recent Note - 5/3/2021 6:12:03 PM
G - Hovering near its all-time high, extended from the latest base following volume-driven gains. Prior highs in the $86 area define initial support to watch on pullbacks.
>>> FEATURED STOCK ARTICLE : Powerful "Breakaway Gap" for CROX - 4/27/2021 |
View all notes |
Set NEW NOTE alert |
Company Profile |
SEC
News |
Chart |
Request a new note
C
A
S
I |
CRL
-
NYSE
Charles River Labs Intl
DRUGS - Biotechnology
|
$331.95
|
-0.50
-0.15% |
$337.15
|
417,515
138.25% of 50 DAV
50 DAV is 302,000
|
$337.48
-1.64%
|
12/17/2020
|
$247.06
|
PP = $257.98
|
|
MB = $270.88
|
Most Recent Note - 4/30/2021 5:39:57 PM
G - Stubbornly holding its ground in a tight range near its all-time high with volume totals cooling. Its 50 DMA line ($298) acted as support throughout its ongoing ascent. Due to report Mar '21 quarterly results on 5/04/21. Volume and volatility often increase near earnings news. Dec '20 quarterly earnings rose +19% on +14% sales revenues versus the year ago period, below the +25% minimum earnings guideline (C criteria), raising fundamental concerns.
>>> FEATURED STOCK ARTICLE : Perched at Record High After Rally From 50-Day Moving Average - 4/9/2021 |
View all notes |
Set NEW NOTE alert |
Company Profile |
SEC
News |
Chart |
Request a new note
C
A
S
I |
CAMT
-
NASDAQ
Camtek Ltd
ELECTRONICS - Scientific and Technical Instrum
|
$33.66
|
-0.40
-1.17% |
$34.75
|
190,494
62.05% of 50 DAV
50 DAV is 307,000
|
$36.14
-6.86%
|
4/28/2021
|
$35.03
|
PP = $35.34
|
|
MB = $37.11
|
Most Recent Note - 4/28/2021 5:00:17 PM
Y - Color code was changed to yellow with pivot point cited based on its 4/13/21 high plus 10 cents. After forming an advanced "ascending base" pattern it touched a new all-time high with today's 4th consecutive gain backed by above average volume. Subsequent gains and a strong close above the pivot point backed by at least +40% above average volume may trigger a technical buy signal. Completed a new Public Offering on 11/19/20. Found prompt support near its 50 DMA line ($30.31) during recent consolidations. Reported earnings +267% on +90% sales revenues for the Mar '21 quarter versus the year ago period, its 3rd strong quarterly comparison well above the +25% minimum guideline and showing impressive sequential acceleration. This Israeli Electronics firm has a strong annual earnings (A criteria) history. See the latest FSU analysis for more details and a new annotated graph.
>>> FEATURED STOCK ARTICLE : Earnings Acceleration and Perched at High After Ascending Base - 4/28/2021 |
View all notes |
Set NEW NOTE alert |
Company Profile |
SEC
News |
Chart |
Request a new note
C
A
S
I |
BRKS
-
NASDAQ
Brooks Automation
ELECTRONICS - Semiconductor Equipment and Mate
|
$97.96
|
-3.37
-3.33% |
$103.99
|
658,492
88.15% of 50 DAV
50 DAV is 747,000
|
$108.72
-9.90%
|
4/5/2021
|
$99.31
|
PP = $91.88
|
|
MB = $96.47
|
Most Recent Note - 5/3/2021 6:10:24 PM
G - Pulled back toward its "max buy" level with lighter volume behind today's 3rd consecutive loss. Prior highs in the $91 area define initial support to watch above its 50 DMA line ($89.69).
>>> FEATURED STOCK ARTICLE : Extended From Base and Consolidating After Recent Rally - 4/30/2021 |
View all notes |
Set NEW NOTE alert |
Company Profile |
SEC
News |
Chart |
Request a new note
C
A
S
I |
Symbol/Exchange
Company Name
Industry Group |
PRICE |
CHANGE
(%Change) |
Day High |
Volume
(% DAV)
(% 50 day avg vol) |
52 Wk Hi
% From Hi |
Featured
Date |
Price
Featured |
Pivot Featured |
|
Max Buy |
ENTG
-
NASDAQ
Entegris Inc
ELECTRONICS - Semiconductor Equipment and Mate
|
$111.36
|
-1.22
-1.08% |
$114.93
|
1,160,718
124.67% of 50 DAV
50 DAV is 931,000
|
$126.41
-11.91%
|
4/1/2021
|
$118.42
|
PP = $110.37
|
|
MB = $115.89
|
Most Recent Note - 4/27/2021 5:35:58 PM
Y - Recently found support while consolidating near the prior high in the $110 area which defines support to watch above its 50 DMA line ($108.73). More damaging losses would raise concerns and trigger technical sell signals.
>>> FEATURED STOCK ARTICLE : Negated Recent Breakout and Sputtering Near Prior High - 4/22/2021 |
View all notes |
Set NEW NOTE alert |
Company Profile |
SEC
News |
Chart |
Request a new note
C
A
S
I |
OPY
-
NYSE
Oppenheimer Holdings Inc
FINANCIAL SERVICES - Investment Brokerage - Regiona
|
$50.75
|
-0.42
-0.82% |
$52.45
|
140,041
112.03% of 50 DAV
50 DAV is 125,000
|
$51.62
-1.69%
|
2/25/2021
|
$38.95
|
PP = $38.11
|
|
MB = $40.02
|
Most Recent Note - 4/30/2021 1:02:16 PM
G - Powering higher today with a 4th consecutive gain, getting very extended from any sound base. Bullish action came after it reported Mar '21 quarterly earnings +402% on +59% sales revenues versus the year ago period. Prior high in the $44 area defines initial support to watch above its 50 DMA line ($42.16).
>>> FEATURED STOCK ARTICLE : Negative Reversal After 7 Consecutive Gains - 4/20/2021 |
View all notes |
Set NEW NOTE alert |
Company Profile |
SEC
News |
Chart |
Request a new note
C
A
S
I |
LAD
-
NYSE
Lithia Motors Inc Cl A
SPECIALTY RETAIL - Auto Dealerships
|
$390.22
|
+5.84
1.52% |
$395.64
|
188,742
62.09% of 50 DAV
50 DAV is 304,000
|
$417.98
-6.64%
|
4/21/2021
|
$377.00
|
PP = $418.08
|
|
MB = $438.98
|
Most Recent Note - 4/27/2021 5:32:23 PM
Y - Posted a gain today with +19% above average volume. Stubbornly held its ground and wedged higher since highlighted in yellow in the 4/21/21 mid-day report with a pivot point cited based on its 3/17/21 high plus 10 cents. Subsequent gains above the pivot point backed by at least +40% above average volume may trigger a technical buy signal.
>>> FEATURED STOCK ARTICLE : Building a Base With Rebound Above 50-Day Moving Average - 4/21/2021 |
View all notes |
Set NEW NOTE alert |
Company Profile |
SEC
News |
Chart |
Request a new note
C
A
S
I |
CLFD
-
NASDAQ
Clearfield Inc
TELECOMMUNICATIONS - Cables / Satalite Equipment
|
$35.66
|
+1.31
3.81% |
$35.81
|
109,685
77.24% of 50 DAV
50 DAV is 142,000
|
$40.26
-11.43%
|
4/26/2021
|
$39.68
|
PP = $38.85
|
|
MB = $40.79
|
Most Recent Note - 5/3/2021 6:17:41 PM
Y - Posted a gain today, halting a streak of 4 consecutive losses. More damaging losses would raise greater concerns while it is sputtering back below the prior high. Fundamentals remain strong after it reported Mar '21 quarterly earnings +440% on +45% sales revenues versus the year ago period, continuing its strong earnings track record.
>>> FEATURED STOCK ARTICLE : Rallied Straight Up From Bottom of 10-Week Base - 4/26/2021 |
View all notes |
Set NEW NOTE alert |
Company Profile |
SEC
News |
Chart |
Request a new note
C
A
S
I |
EDUC
-
NASDAQ
Educational Development
WHOLESALE - Basic Materials Wholesale
|
$17.82
|
+0.04
0.22% |
$18.20
|
7,194
27.67% of 50 DAV
50 DAV is 26,000
|
$20.00
-10.90%
|
3/10/2021
|
$17.89
|
PP = $20.10
|
|
MB = $21.11
|
Most Recent Note - 4/27/2021 12:26:38 PM
Y - Tallying a big volume-driven gain today after 3 gains backed by light volume. Volume totals cooled while consolidating above its 50 DMA line ($17.14) which defines important near-term support. Met stubborn resistance in the $19-20 area. Subsequent gains above the pivot point backed by at least +40% above average volume are needed to trigger a proper technical buy signal.
>>> FEATURED STOCK ARTICLE : Finding Support During Consolidation Above 50-Day Moving Average - 4/16/2021 |
View all notes |
Set NEW NOTE alert |
Company Profile |
SEC
News |
Chart |
Request a new note
C
A
S
I |
Symbol/Exchange
Company Name
Industry Group |
PRICE |
CHANGE
(%Change) |
Day High |
Volume
(% DAV)
(% 50 day avg vol) |
52 Wk Hi
% From Hi |
Featured
Date |
Price
Featured |
Pivot Featured |
|
Max Buy |
SMPL
-
NASDAQ
Simply Good Foods Co
Food-Confectionery
|
$34.17
|
-0.38
-1.10% |
$34.98
|
350,958
49.78% of 50 DAV
50 DAV is 705,000
|
$35.34
-3.31%
|
12/28/2020
|
$30.40
|
PP = $31.44
|
|
MB = $33.01
|
Most Recent Note - 4/30/2021 5:41:18 PM
G - Perched at its all-time high with volume totals cooling. Reported Feb '21 quarterly earnings +9% on +2% sales revenues versus the year ago period, below the +25% minimum earnings guideline (C criteria), raising fundamental concerns. Found prompt support near its 50 DMA line ($31.66) but its current Relative Strength Rating is 79, one notch below the 80+ minimum guideline for buy candidates.
>>> FEATURED STOCK ARTICLE : Perched Near High But Fundamental Concerns Were Raised - 4/14/2021 |
View all notes |
Set NEW NOTE alert |
Company Profile |
SEC
News |
Chart |
Request a new note
C
A
S
I |
IBP
-
NYSE
Installed Building Prod
DIVERSIFIED SERVICES - Business/Management Services
|
$137.65
|
+3.00
2.23% |
$137.96
|
187,277
83.61% of 50 DAV
50 DAV is 224,000
|
$136.39
0.92%
|
4/19/2021
|
$131.15
|
PP = $130.21
|
|
MB = $136.72
|
Most Recent Note - 4/29/2021 5:52:16 PM
Y - Hit a new all-time high with today's gain backed by higher (but below average) volume. A volume-driven gain and strong close above its pivot point on 4/23/21 helped clinch a convincing technical buy signal. Reported earnings +34% on +10% sales revenues for the Dec '20 quarter versus the year-ago period. Three of the past 4 consecutive quarterly comparisons were above the +25% minimum earnings guideline (C criteria). Annual earnings (A criteria) history has been strong.
>>> FEATURED STOCK ARTICLE : Steady Streak of Gains Into New High Territory - 4/19/2021 |
View all notes |
Set NEW NOTE alert |
Company Profile |
SEC
News |
Chart |
Request a new note
C
A
S
I |
QRVO
-
NASDAQ
"Qorvo, Inc"
ELECTRONICS - Semiconductor - Integrated Cir
|
$184.54
|
-3.63
-1.93% |
$190.06
|
1,035,454
91.00% of 50 DAV
50 DAV is 1,137,900
|
$201.68
-8.50%
|
4/1/2021
|
$190.48
|
PP = $191.92
|
|
MB = $201.52
|
Most Recent Note - 4/30/2021 5:34:24 PM
Y - Gapped down today for a big volume-driven loss after again edging higher with gains backed by lighter than average volume. Its 50 DMA line ($182.72) acted as support when it stalled after recently wedging up to new highs from a 9-week base. Its Relative Strength Rating is 73, below the 80+ minimum for buy candidates. See the latest FSU analysis for more details and an annotated graph.
>>> FEATURED STOCK ARTICLE : Quiet Gain For Best Ever Close - 4/29/2021 |
View all notes |
Set NEW NOTE alert |
Company Profile |
SEC
News |
Chart |
Request a new note
C
A
S
I |
YETI
-
NYSE
Yeti Holdings Inc
Leisure-Products
|
$87.17
|
+1.75
2.05% |
$87.57
|
914,925
70.27% of 50 DAV
50 DAV is 1,302,000
|
$89.70
-2.82%
|
4/6/2021
|
$76.95
|
PP = $79.42
|
|
MB = $83.39
|
Most Recent Note - 4/30/2021 5:42:45 PM
G - Pulled back today with higher volume after quietly hovering near its all-time high this week, extended from the latest base. Prior highs in the $80 area define initial support to watch on pullbacks.
>>> FEATURED STOCK ARTICLE : Hovering Near Record High Following Volume-Driven Gains - 5/3/2021 |
View all notes |
Set NEW NOTE alert |
Company Profile |
SEC
News |
Chart |
Request a new note
C
A
S
I |
DT
-
NYSE
Dynatrace Inc
Computer Sftwr-Enterprse
|
$50.82
|
-1.22
-2.34% |
$52.71
|
1,090,102
54.67% of 50 DAV
50 DAV is 1,993,900
|
$56.94
-10.75%
|
4/26/2021
|
$54.43
|
PP = $57.04
|
|
MB = $59.89
|
Most Recent Note - 5/3/2021 6:14:34 PM
G - Pulled back today for a 4th consecutive loss on below average volume, but it closed below its 50 DMA line ($51.32) again raising concerns and its color code is changed to green. A rebound and subsequent gains above the pivot point backed by at least +40% above average volume are needed to trigger a new (or add-on) technical buy signal. Recent lows in the $45 area define important near-term support to watch on pullbacks. Its Relative Strength Rating is 70, below the 80+ minimum guideline for buy candidates, however it is perched only -10.7% off its all-time high. Fundamentals remain strong after it reported Dec '20 earnings +70% on +28% sales revenues versus the year ago period.
>>> FEATURED STOCK ARTICLE : Gap Up Rebounding Further Above 50-Day Moving Average - 4/8/2021 |
View all notes |
Set NEW NOTE alert |
Company Profile |
SEC
News |
Chart |
Request a new note
C
A
S
I |
Symbol/Exchange
Company Name
Industry Group |
PRICE |
CHANGE
(%Change) |
Day High |
Volume
(% DAV)
(% 50 day avg vol) |
52 Wk Hi
% From Hi |
Featured
Date |
Price
Featured |
Pivot Featured |
|
Max Buy |
MRBK
-
NASDAQ
Meridian Corp
Banks-Northeast
|
$26.32
|
-0.08
-0.30% |
$26.54
|
20,452
52.44% of 50 DAV
50 DAV is 39,000
|
$27.96
-5.87%
|
2/22/2021
|
$25.58
|
PP = $26.10
|
|
MB = $27.41
|
Most Recent Note - 4/29/2021 12:33:25 PM
Y - Consolidating above its 50 DMA line ($25.71) and perched within striking distance of its 52-week high. Reported Mar '21 earnings +323% on +93% sales revenues versus the year ago period, continuing its strong earnings track record. Recent low ($24.01 on 4/21/21) defines important near-term support where any violation may trigger a worrisome technical sell signal. Its Relative Strength Rating is right at the 80 minimum guideline.
>>> FEATURED STOCK ARTICLE : Encountering Distributional Pressure - 4/12/2021 |
View all notes |
Set NEW NOTE alert |
Company Profile |
SEC
News |
Chart |
Request a new note
C
A
S
I |
|
|
|
THESE ARE NOT BUY RECOMMENDATIONS!
Comments contained in the body of this report are technical
opinions only. The material herein has been obtained
from sources believed to be reliable and accurate, however,
its accuracy and completeness cannot be guaranteed.
This site is not an investment advisor, hence it does
not endorse or recommend any securities or other investments.
Any recommendation contained in this report may not
be suitable for all investors and it is not to be deemed
an offer or solicitation on our part with respect to
the purchase or sale of any securities. All trademarks,
service marks and trade names appearing in this report
are the property of their respective owners, and are
likewise used for identification purposes only.
This report is a service available
only to active Paid Premium Members.
You may opt-out of receiving report notifications
at any time. Questions or comments may be submitted
by writing to Premium Membership Services 665 S.E. 10 Street, Suite 201 Deerfield Beach, FL 33441-5634 or by calling 1-800-965-8307
or 954-785-1121.
|
|
|