You are not logged in.
This means you
CAN ONLY VIEW reports that were published prior to Thursday, March 20, 2025.
You
MUST UPGRADE YOUR MEMBERSHIP if you want to see any current reports.
AFTER MARKET UPDATE - THURSDAY, APRIL 8TH, 2021
Previous After Market Report Next After Market Report >>>
|
|
|
|
DOW |
+57.31 |
33,503.57 |
+0.17% |
|
Volume |
850,634,220 |
+6% |
|
Volume |
4,122,337,600 |
+2% |
|
NASDAQ |
+140.35 |
13,829.19 |
+1.03% |
|
Advancers |
2,054 |
63% |
|
Advancers |
2,771 |
67% |
|
S&P 500 |
+17.22 |
4,097.17 |
+0.42% |
|
Decliners |
1,207 |
37% |
|
Decliners |
1,342 |
33% |
|
Russell 2000 |
+19.54 |
2,242.60 |
+0.88% |
|
52 Wk Highs |
245 |
|
|
52 Wk Highs |
159 |
|
|
S&P 600 |
+6.82 |
1,332.13 |
+0.51% |
|
52 Wk Lows |
9 |
|
|
52 Wk Lows |
27 |
|
|
 |
Major Indices Showed Resilience After Early Weakness
Kenneth J. Gruneisen - Passed the CAN SLIM® Master's Exam
The Dow reversed early session losses, rising 57 points. The S&P 500 closed at another record high, gaining 0.4%. The Nasdaq Composite outperformed, rising 1% as Tech and growth-oriented stocks outperformed their value counterparts. The volume totals were higher than the prior session on the NYSE and on the Nasdaq exchange. Advancers led decliners by a 5-3 margin on the NYSE and by more than 2-1 on the Nasdaq exchange. Leadership improved slightly as there were 26 high-ranked companies from the Leaders List that hit new 52-week highs and were listed on the BreakOuts Page, versus the total of 22 on the prior session. New 52-week highs totals expanded and solidly outnumbered new 52-week lows on the NYSE on the Nasdaq exchange. The major indices (M criteria) are in a confirmed uptrend. Investors are reminded to always make buying and selling decisions on case-by-case basis under the strict criteria and rules of the fact-based investment system.
PICTURED: The Dow Jones Industrial Average is hovering near its record high.
U.S. stocks finished higher on Thursday, as comments from Fed Chair Jerome Powell helped buoy risk sentiment. During an International Monetary Fund panel discussion, the Fed chief reiterated expectations for transitory price pressures in the coming months and reassured investors that the central bank has tools to curb inflation that are “materially above levels we’re comfortable with.” Powell also welcomed the strong March jobs report, but said officials still needed to see significant improvement before pulling back their accommodative policy stance. His comments echoed the dovish takeaways from the Federal Reserve’s March meeting minutes released on Wednesday.
Treasuries advanced, with the yield on the 10-year note down five basis points to 1.62%. Economic data was also in focus, with Initial jobless claims coming in at 744,000 in the latest week, unexpectedly climbing from the prior upwardly revised 728,000 figure. In commodities, WTI crude held steady at $59.76/barrel after Saudi Arabia’s energy minister evoked confidence in OPEC+’s recent decision to lift output curbs. COMEX gold rose 0.8% to $1754.30/ounce.
Six of 11 S&P 500 sectors ended in positive territory. Information Technology stocks paced the gains, with Microsoft (MSFT +1.34%) and Apple (AAPL +1.92%) both rallying. Energy lagged with a 1.3% decline. In corporate news, Constellation Brands (STZ -4.48%) fell despite topping analyst earnings estimates. Twitter (TWTR +3.25%) after reportedly engaging in discussions to acquire Clubhouse, an audio-based social network. |
 Kenneth J. Gruneisen started out as a licensed stockbroker in August 1987, a couple of months prior to the historic stock market crash that took the Dow Jones Industrial Average down -22.6% in a single day. He has published daily fact-based fundamental and technical analysis on high-ranked stocks online for two decades. Through FACTBASEDINVESTING.COM, Kenneth provides educational articles, news, market commentary, and other information regarding proven investment systems that work in good times and bad.
Comments contained in the body of this report are technical opinions only and are not necessarily those of Gruneisen Growth Corp. The material herein has been obtained from sources believed to be reliable and accurate, however, its accuracy and completeness cannot be guaranteed. Our firm, employees, and customers may effect transactions, including transactions contrary to any recommendation herein, or have positions in the securities mentioned herein or options with respect thereto. Any recommendation contained in this report may not be suitable for all investors and it is not to be deemed an offer or solicitation on our part with respect to the purchase or sale of any securities. |
|
 |
Retail, Tech, and Gold & Silver Indexes Rose
Kenneth J. Gruneisen - Passed the CAN SLIM® Master's Exam
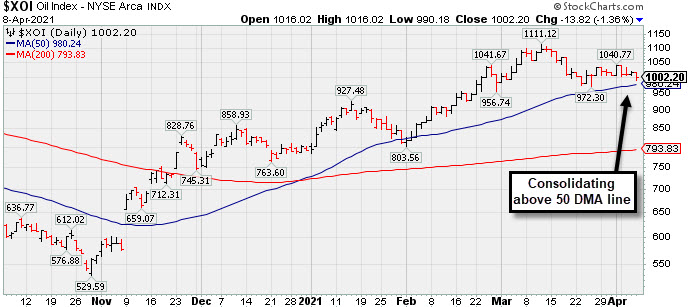
The Retail Index ($RLX +0.63%) posted a modest gain that had a positive influence on the major averages. The Semiconductor Index ($SOX +1.07%) and Networking Index ($NWX +1.49%) both outpaced the Biotech Index ($BTK +0.15%). The Bank Index ($BKX -0.25%) and Broker/Dealer Index ($XBD +0.00%) both were little changed. Commodity-linked groups were mixed as the Oil Services Index ($OSX -1.16%) and Integrated Oil Index ($XOI -1.36%) both lost ground while the Gold & Silver Index ($XAU +2.55%) posted a solid gain. PICTURED: The Integrated Oil Index ($XOI -1.36%) is consolidating above its 50-day moving average (DMA) line.
| Oil Services |
$OSX |
52.96 |
-0.62 |
-1.16% |
+19.46% |
| Integrated Oil |
$XOI |
1,002.20 |
-13.83 |
-1.36% |
+26.46% |
| Semiconductor |
$SOX |
3,301.26 |
+34.80 |
+1.07% |
+18.09% |
| Networking |
$NWX |
807.74 |
+11.87 |
+1.49% |
+12.64% |
| Broker/Dealer |
$XBD |
453.17 |
+0.01 |
+0.00% |
+20.01% |
| Retail |
$RLX |
3,829.67 |
+23.80 |
+0.63% |
+7.48% |
| Gold & Silver |
$XAU |
144.26 |
+3.59 |
+2.55% |
+0.05% |
| Bank |
$BKX |
121.92 |
-0.31 |
-0.25% |
+24.52% |
| Biotech |
$BTK |
5,453.86 |
+8.34 |
+0.15% |
-4.97% |
|
|
|
 |
Gap Up Rebounding Further Above 50-Day Moving Average
Kenneth J. Gruneisen - Passed the CAN SLIM® Master's Exam
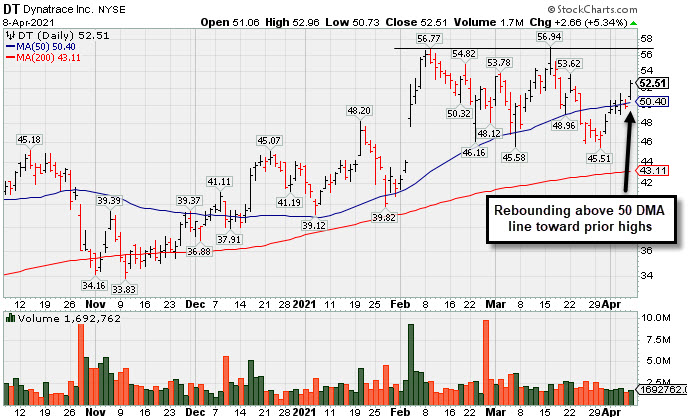
Dynatrace Inc (DT +$2.66 or +5.34% to $52.51) gapped up today above its 50-day moving average (DMA) line ($50.40) rebounding toward prior highs. Recent lows in the $45 area define important near-term support to watch on pullbacks. Its Relative Strength Rating is 73, still below the 80+ minimum guideline for buy candidates.
Fundamentals remain strong after it reported Dec '20 earnings +70% on +28% sales revenues versus the year ago period. It has a 98 Earnings Per Share Rating. DT was highlighted in yellow with pivot point cited based on its 9/02/20 high in the 2/04/21 mid-day report (read here). The high-ranked Computer Sftwr-Enterprse firm was last shown in this FSU section on 3/19/21 with an annotated graph under the headline, "50-Day Moving Average Line Tested Again". It completed its $16.00 IPO on 8/01/19 and Secondary Offerings on 12/06/19, 2/21/20, and 6/03/20.
The number of top-rated funds owning its shares rose from 226 in Sep '19 to 762 in Dec '20, a reassuring sign concerning the I criteria. Its current Up/Down Volume ratio of 0.9 is an unbiased indication its shares have encountered slight distributional pressure over the past 50 days. It has a B Timeliness rating and a B Sponsorship rating.
|
|
|
Color Codes Explained :
Y - Better candidates highlighted by our
staff of experts.
G - Previously featured
in past reports as yellow but may no longer be buyable under the
guidelines.
***Last / Change / Volume data in this table is the closing quote data***
Symbol/Exchange
Company Name
Industry Group |
PRICE |
CHANGE
(%Change) |
Day High |
Volume
(% DAV)
(% 50 day avg vol) |
52 Wk Hi
% From Hi |
Featured
Date |
Price
Featured |
Pivot Featured |
|
Max Buy |
 FBC
-
NYSE
FBC
-
NYSE
Flagstar Bancorp Inc
BANKING - Savings and Loans
|
$44.63
|
-0.51
-1.13% |
$44.94
|
553,912
89.99% of 50 DAV
50 DAV is 615,500
|
$51.58
-13.47%
|
3/4/2021
|
$47.26
|
PP = $48.02
|
|
MB = $50.42
|
Most Recent Note - 4/5/2021 6:10:47 PM
G - Sputtering near its 50 DMA line ($45.68) with volume totals cooling in recent weeks. Near-term support to watch is prior lows.
>>> FEATURED STOCK ARTICLE : Slumping Into Prior Base Following Breakout - 3/22/2021 |
View all notes |
Set NEW NOTE alert |
Company Profile |
SEC
News |
Chart |
Request a new note
C
A
S
I |
CRL
-
NYSE
Charles River Labs Intl
DRUGS - Biotechnology
|
$305.20
|
+8.67
2.92% |
$307.01
|
479,269
149.91% of 50 DAV
50 DAV is 319,700
|
$307.44
-0.73%
|
12/17/2020
|
$247.06
|
PP = $257.98
|
|
MB = $270.88
|
Most Recent Note - 4/7/2021 2:31:31 PM
G - Pulling back today after touching a new all-time high on the prior session with its 5th consecutive gain. Its 50 DMA line ($282) acted as support throughout its ongoing ascent. Its Relative Strength Rating is 75, below the 80+ minimum guideline for buy candidates. Recently reported Dec '20 quarterly earnings +19% on +14% sales revenues versus the year ago period, below the +25% minimum earnings guideline (C criteria), raising fundamental concerns.
>>> FEATURED STOCK ARTICLE : Made Gradual Progress, Now Extended From Any Sound Base - 3/16/2021 |
View all notes |
Set NEW NOTE alert |
Company Profile |
SEC
News |
Chart |
Request a new note
C
A
S
I |
BRKS
-
NASDAQ
Brooks Automation
ELECTRONICS - Semiconductor Equipment and Mate
|
$98.36
|
+1.68
1.74% |
$98.49
|
623,805
88.36% of 50 DAV
50 DAV is 706,000
|
$101.63
-3.22%
|
4/5/2021
|
$99.31
|
PP = $91.88
|
|
MB = $96.47
|
Most Recent Note - 4/6/2021 12:18:21 PM
G - Edging higher today and its color code is changed to green. Finished strong on the prior session after highlighted in yellow with pivot point cited based on its 2/12/21 high plus 10 cents. Hit a new all-time high with heavier volume behind its 4th consecutive gain while clearing a 6-week base, but quickly getting extended. Found support after undercutting its 50 DMA line ($83.13) in recent weeks. Reported earnings +104% on +19% sales revenues for the Dec '20 quarter versus the year ago period, its 6th consecutive quarterly comparison above the +25% minimum earnings guideline (C criteria). Annual earnings history (A criteria) included a downturn in FY '18.
>>> FEATURED STOCK ARTICLE : High Ranked Semiconductor Equipment Firm Powered Higher - 4/7/2021 |
View all notes |
Set NEW NOTE alert |
Company Profile |
SEC
News |
Chart |
Request a new note
C
A
S
I |
ENTG
-
NASDAQ
Entegris Inc
ELECTRONICS - Semiconductor Equipment and Mate
|
$122.05
|
+3.42
2.88% |
$123.29
|
1,291,126
134.77% of 50 DAV
50 DAV is 958,000
|
$126.41
-3.45%
|
4/1/2021
|
$118.42
|
PP = $110.37
|
|
MB = $115.89
|
 Most Recent Note - 4/8/2021 1:46:41 PM
G - Hovering near its all-time high and stubbornly holding its ground following a spurt of volume-driven gains. Prior highs in the $114-110 area define near-term support to watch on pullbacks.
>>> FEATURED STOCK ARTICLE : Strong Breakout Action With +67% Above Average Volume - 4/1/2021 |
View all notes |
Set NEW NOTE alert |
Company Profile |
SEC
News |
Chart |
Request a new note
C
A
S
I |
OPY
-
NYSE
Oppenheimer Holdings Inc
FINANCIAL SERVICES - Investment Brokerage - Regiona
|
$41.87
|
-0.32
-0.76% |
$42.31
|
49,472
36.11% of 50 DAV
50 DAV is 137,000
|
$44.38
-5.66%
|
2/25/2021
|
$38.95
|
PP = $38.11
|
|
MB = $40.02
|
Most Recent Note - 4/6/2021 1:14:22 PM
G - Color code is changed to green while rising further above its "max buy" level with today's 3rd consecutive gain. Its 50 DMA line ($38.70) and prior low define near-term support to watch.
>>> FEATURED STOCK ARTICLE : Oppenheimer Consolidating Near Max Buy Level - 3/31/2021 |
View all notes |
Set NEW NOTE alert |
Company Profile |
SEC
News |
Chart |
Request a new note
C
A
S
I |
Symbol/Exchange
Company Name
Industry Group |
PRICE |
CHANGE
(%Change) |
Day High |
Volume
(% DAV)
(% 50 day avg vol) |
52 Wk Hi
% From Hi |
Featured
Date |
Price
Featured |
Pivot Featured |
|
Max Buy |
EDUC
-
NASDAQ
Educational Development
WHOLESALE - Basic Materials Wholesale
|
$17.00
|
+0.06
0.35% |
$17.36
|
59,851
181.37% of 50 DAV
50 DAV is 33,000
|
$20.00
-15.00%
|
3/10/2021
|
$17.89
|
PP = $20.10
|
|
MB = $21.11
|
Most Recent Note - 4/7/2021 2:49:08 PM
Y - Today's loss on higher volume has it slumping toward its 50 DMA line ($16.45) which defines important near-term support. Met stubborn resistance in the $19-20 area. Subsequent gains above the pivot point backed by at least +40% above average volume are needed to trigger a proper technical buy signal. This thinly traded Media - Books firm's annual earnings (A criteria) history has strong.
>>> FEATURED STOCK ARTICLE : Consolidating Above 50 DMA Line Perched Near High - 3/30/2021 |
View all notes |
Set NEW NOTE alert |
Company Profile |
SEC
News |
Chart |
Request a new note
C
A
S
I |
SMPL
-
NASDAQ
Simply Good Foods Co
Food-Confectionery
|
$31.76
|
+0.28
0.89% |
$32.56
|
548,514
76.82% of 50 DAV
50 DAV is 714,000
|
$35.25
-9.90%
|
12/28/2020
|
$30.40
|
PP = $31.44
|
|
MB = $33.01
|
Most Recent Note - 4/7/2021 12:42:59 PM
G - Reported Feb '21 quarterly earnings +9% on +2% sales revenues versus the year ago period, below the +25% minimum earnings guideline (C criteria), raising fundamental concerns. Found prompt support near its 50 DMA line ($30.24) but its current Relative Strength Rating is 62, below the 80+ minimum guideline for buy candidates. Faces resistance due to overhead supply up to the $35 level.
>>> FEATURED STOCK ARTICLE : Violation of 50-Day Moving Average Triggered Technical Sell Signal - 3/24/2021 |
View all notes |
Set NEW NOTE alert |
Company Profile |
SEC
News |
Chart |
Request a new note
C
A
S
I |
QRVO
-
NASDAQ
Qorvo Inc
ELECTRONICS - Semiconductor - Integrated Cir
|
$193.52
|
-0.17
-0.09% |
$197.02
|
1,100,160
72.76% of 50 DAV
50 DAV is 1,512,000
|
$199.94
-3.21%
|
4/1/2021
|
$190.48
|
PP = $191.92
|
|
MB = $201.52
|
Most Recent Note - 4/5/2021 6:04:20 PM
Y - Posted a 3rd consecutive gain today with lighter volume while hitting a new all-time high, wedging up from any orderly 9-week base. Prior highs in the $191-185 area define initial support to watch on pullbacks. See the latest FSU analysis for more details and a new annotated graph.
>>> FEATURED STOCK ARTICLE : Hit Another New High With Even Less Volume Conviction - 4/5/2021 |
View all notes |
Set NEW NOTE alert |
Company Profile |
SEC
News |
Chart |
Request a new note
C
A
S
I |
YETI
-
NYSE
Yeti Holdings Inc
Leisure-Products
|
$76.92
|
+1.64
2.18% |
$77.03
|
924,733
70.75% of 50 DAV
50 DAV is 1,307,000
|
$80.89
-4.91%
|
4/6/2021
|
$76.95
|
PP = $79.42
|
|
MB = $83.39
|
Most Recent Note - 4/7/2021 5:19:24 PM
Y - Posted a quiet gain today. A new pivot point was cited based on its 2/10/21 high while working on a "double bottom" base. Subsequent gains above the pivot point backed by at least +40% above average volume may trigger a new (or add-on) technical buy signal. Stayed well above its 200 DMA line after dropped from the Featured Stocks list on 3/04/21. See the latest FSU analysis for more details and a new annotated graph.
>>> FEATURED STOCK ARTICLE : YETI Perched Within Striking Distance of High - 4/7/2021 |
View all notes |
Set NEW NOTE alert |
Company Profile |
SEC
News |
Chart |
Request a new note
C
A
S
I |
DT
-
NYSE
Dynatrace Inc
Computer Sftwr-Enterprse
|
$52.51
|
+2.66
5.34% |
$52.96
|
1,692,762
65.71% of 50 DAV
50 DAV is 2,576,200
|
$56.94
-7.78%
|
2/4/2021
|
$51.39
|
PP = $48.95
|
|
MB = $51.40
|
Most Recent Note - 4/8/2021 1:43:40 PM
G - Gapped up today rebounding further above its 50 DMA line ($50.40). Recent lows in the $45 area define important near-term support to watch on pullbacks. Its Relative Strength Rating is 69, well below the 80+ minimum guideline for buy candidates. Fundamentals remain strong after it reported Dec '20 earnings +70% on +28% sales revenues versus the year ago period.
>>> FEATURED STOCK ARTICLE : Gap Up Rebounding Further Above 50-Day Moving Average - 4/8/2021 |
View all notes |
Set NEW NOTE alert |
Company Profile |
SEC
News |
Chart |
Request a new note
C
A
S
I |
Symbol/Exchange
Company Name
Industry Group |
PRICE |
CHANGE
(%Change) |
Day High |
Volume
(% DAV)
(% 50 day avg vol) |
52 Wk Hi
% From Hi |
Featured
Date |
Price
Featured |
Pivot Featured |
|
Max Buy |
MRBK
-
NASDAQ
Meridian Corp
Banks-Northeast
|
$25.86
|
+0.50
1.97% |
$25.88
|
21,847
60.69% of 50 DAV
50 DAV is 36,000
|
$27.96
-7.51%
|
2/22/2021
|
$25.58
|
PP = $26.10
|
|
MB = $27.41
|
Most Recent Note - 4/7/2021 2:23:29 PM
Y - Volume totals have been cooling while hovering within close striking distance of its all-time high. Its 50 DMA line ($24.51) and prior low ($24.13 on 3/25/21) define important near-term support to watch where violations may trigger technical sell signals. Its Relative Strength Rating is 77, still below the 80+ minimum guideline.
>>> FEATURED STOCK ARTICLE : Prior High Defines Initial Support to Watch - 3/15/2021 |
View all notes |
Set NEW NOTE alert |
Company Profile |
SEC
News |
Chart |
Request a new note
C
A
S
I |
|
|
|
THESE ARE NOT BUY RECOMMENDATIONS!
Comments contained in the body of this report are technical
opinions only. The material herein has been obtained
from sources believed to be reliable and accurate, however,
its accuracy and completeness cannot be guaranteed.
This site is not an investment advisor, hence it does
not endorse or recommend any securities or other investments.
Any recommendation contained in this report may not
be suitable for all investors and it is not to be deemed
an offer or solicitation on our part with respect to
the purchase or sale of any securities. All trademarks,
service marks and trade names appearing in this report
are the property of their respective owners, and are
likewise used for identification purposes only.
This report is a service available
only to active Paid Premium Members.
You may opt-out of receiving report notifications
at any time. Questions or comments may be submitted
by writing to Premium Membership Services 665 S.E. 10 Street, Suite 201 Deerfield Beach, FL 33441-5634 or by calling 1-800-965-8307
or 954-785-1121.
|
|
|