You are not logged in.
This means you
CAN ONLY VIEW reports that were published prior to Thursday, March 20, 2025.
You
MUST UPGRADE YOUR MEMBERSHIP if you want to see any current reports.
AFTER MARKET UPDATE - THURSDAY, APRIL 29TH, 2021
Previous After Market Report Next After Market Report >>>
|
|
|
|
DOW |
+239.98 |
34,060.36 |
+0.71% |
|
Volume |
902,978,910 |
+10% |
|
Volume |
4,852,382,600 |
+9% |
|
NASDAQ |
+28.18 |
14,079.21 |
+0.20% |
|
Advancers |
1,678 |
52% |
|
Advancers |
1,901 |
46% |
|
S&P 500 |
+28.29 |
4,211.47 |
+0.68% |
|
Decliners |
1,567 |
48% |
|
Decliners |
2,268 |
54% |
|
Russell 2000 |
-8.70 |
2,295.46 |
-0.38% |
|
52 Wk Highs |
444 |
|
|
52 Wk Highs |
251 |
|
|
S&P 600 |
+0.51 |
1,363.56 |
+0.04% |
|
52 Wk Lows |
17 |
|
|
52 Wk Lows |
33 |
|
|
 |
Major Indices Rose With Greater Volume and More Leadership
Kenneth J. Gruneisen - Passed the CAN SLIM® Master's Exam
The Dow jumped 239 points, while the S&P 500 rallied 0.7% to a new all-time high. The Nasdaq Composite rebounded 0.2% after briefly falling into negative territory from a fresh record intraday level. The volume totals reported were higher than the prior session on the NYSE and on the Nasdaq exchange, indicative of greater institutional buying demand. Advancers led decliners by a narrow margin on the NYSE but decliners led advancers by a narrow margin on the Nasdaq exchange. There were 93 high-ranked companies from the Leaders List that hit new 52-week highs and were listed on the BreakOuts Page, versus the total of 51 on the prior session. New 52-week highs totals expanded and solidly outnumbered new 52-week lows on both the NYSE and the Nasdaq exchange. The major indices (M criteria) are in a confirmed uptrend. Investors are reminded to always make buying and selling decisions on case-by-case basis under the strict criteria and rules of the fact-based investment system.
PICTURED: The Dow Jones Industrial Average rose within close striking distance of a new record high.
U.S. stocks ended firmly higher in volatile trading, as Wall Street digested the latest batch of corporate earnings and economic data. Thursday marked the busiest day of earnings season, with over a tenth of S&P 500 companies providing quarterly profit tallies.
Nine of 11 S&P 500 sectors finished in positive territory, with Health Care and Technology bucking the uptrend. Communication Services outperformed, with Facebook (FB +7.30%) surging after posting a 48% increase in revenue, fueled by a spike in ad spending. In other earnings, Apple (AAPL -0.07%) pared a more than 2% gain to end little changed as lingering headwinds related to the global chip shortage dampened a 54% quarterly surge in revenue that blew past analyst estimates. Caterpillar (CAT -2.08%) fell despite a top and bottom line beat, while McDonald’s (MCD +1.20%) rose following upbeat quarterly figures.
On the data front, an initial print of first quarter GDP showed the U.S. economy expanded at a 6.4% annualized pace during the January-March period, below expectations of a 6.7% rate. Separately, initial jobless claims came in at 553,000 in the week ending April 24, representing a new pandemic low. Treasuries weakened, with the yield on the 10-year note up two basis points to 1.63%, headed for its largest weekly advance since mid-March. In commodities, WTI crude rose 1.7% to $64.94/barrel, while copper stalled just below a record level. |
 Kenneth J. Gruneisen started out as a licensed stockbroker in August 1987, a couple of months prior to the historic stock market crash that took the Dow Jones Industrial Average down -22.6% in a single day. He has published daily fact-based fundamental and technical analysis on high-ranked stocks online for two decades. Through FACTBASEDINVESTING.COM, Kenneth provides educational articles, news, market commentary, and other information regarding proven investment systems that work in good times and bad.
Comments contained in the body of this report are technical opinions only and are not necessarily those of Gruneisen Growth Corp. The material herein has been obtained from sources believed to be reliable and accurate, however, its accuracy and completeness cannot be guaranteed. Our firm, employees, and customers may effect transactions, including transactions contrary to any recommendation herein, or have positions in the securities mentioned herein or options with respect thereto. Any recommendation contained in this report may not be suitable for all investors and it is not to be deemed an offer or solicitation on our part with respect to the purchase or sale of any securities. |
|
 |
Financial, Retail, Energy, Networking, Semiconductor Indexes Rose
Kenneth J. Gruneisen - Passed the CAN SLIM® Master's Exam
The Bank Index ($BKX +1.99%) outpaced the Broker/Dealer Index ($XBD +0.28%) and the Retail Index ($RLX +0.65%). The Networking Index ($NWX +1.88%) led the tech sector while the Semiconductor Index ($SOX +0.71%) posted a smaller gain but the Biotech Index ($BTK -0.75%) lost ground. The Oil Services Index ($OSX +0.60%) and Integrated Oil Index ($XOI +0.80%) both edged higher, meanwhile the Gold & Silver Index ($XAU -2.25%) was a standout decliner.
Networking Index ($NWX +1.88%) PICTURED: The Networking Index ($NWX +1.88%) is consolidating above its 50-day moving average (DMA) line and perched near its record high.
| Oil Services |
$OSX |
54.17 |
+0.32 |
+0.60% |
+22.20% |
| Integrated Oil |
$XOI |
1,044.93 |
+8.32 |
+0.80% |
+31.86% |
| Semiconductor |
$SOX |
3,201.12 |
+22.63 |
+0.71% |
+14.51% |
| Networking |
$NWX |
818.33 |
+15.14 |
+1.88% |
+14.11% |
| Broker/Dealer |
$XBD |
464.73 |
+1.31 |
+0.28% |
+23.07% |
| Retail |
$RLX |
3,990.43 |
+25.81 |
+0.65% |
+11.99% |
| Gold & Silver |
$XAU |
144.30 |
-3.32 |
-2.25% |
+0.08% |
| Bank |
$BKX |
128.96 |
+2.52 |
+1.99% |
+31.72% |
| Biotech |
$BTK |
5,623.68 |
-42.25 |
-0.75% |
-2.01% |
|
|
|
 |
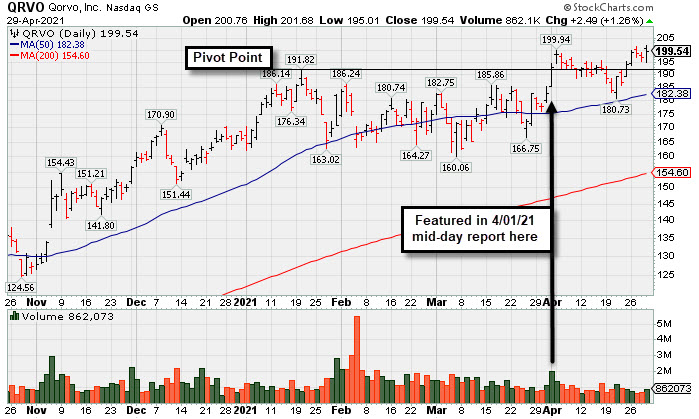
Quiet Gain For Best Ever Close
Kenneth J. Gruneisen - Passed the CAN SLIM® Master's Exam
Qorvo Inc (QRVO +$2.49 or +1.26% to $199.54) posted a quiet gain today for a best-ever close. Since highlighted in yellow in the 4/01/21 mid-day report (read here) it found support at its 50-day moving average (DMA) line last week and has wedged higher with gains lacking great volume conviction. It was last shown in this FSU section on 4/05/21 with an annotated graph under the headline, "Hit Another New High With Even Less Volume Conviction". Volume was +33% above average on 4/01/21 as QRVO broke out from any orderly 9-week base. Volume should be at least +40% above average to trigger a proper technical buy signal. So, disciplined investors may still be watching for confirming gains as a reassurance of fresh institutional buying demand that can lead to a significant new leg higher.
Keep in mind the company is due to report Mar '21 quarterly results on 5/05/21, and volume and volatility often increase near earnings news. QRVO has a 93 Earnings Per Share Rating. It reported Dec '20 quarterly earnings +66% on +26% sales revenues versus the year ago period. Three of the 4 latest quarterly comparisons were above the +25% minimum guideline (C criteria). Annual earnings growth has been steady.
The number of top-rated funds owning its shares rose from 1,363 in Mar '20 to 1,623 in Mar '20, a reassuring sign concerning the I criteria. It has 113.3 million shares outstanding (S criteria). Its current Accumulation/Distribution Rating is A-. However, its Up/Down Volume Ratio of 0.9 is an unbiased indication its shares have been under slight distributional pressure over the past 50 days. |
|
|
Color Codes Explained :
Y - Better candidates highlighted by our
staff of experts.
G - Previously featured
in past reports as yellow but may no longer be buyable under the
guidelines.
***Last / Change / Volume data in this table is the closing quote data***
Symbol/Exchange
Company Name
Industry Group |
PRICE |
CHANGE
(%Change) |
Day High |
Volume
(% DAV)
(% 50 day avg vol) |
52 Wk Hi
% From Hi |
Featured
Date |
Price
Featured |
Pivot Featured |
|
Max Buy |
 SIVB
-
NASDAQ
SIVB
-
NASDAQ
S V B Financial Group
BANKING - Regional - Pacific Banks
|
$580.20
|
+8.39
1.47% |
$586.78
|
421,257
75.77% of 50 DAV
50 DAV is 556,000
|
$585.25
-0.86%
|
4/23/2021
|
$579.70
|
PP = $577.16
|
|
MB = $606.02
|
 Most Recent Note - 4/29/2021 5:57:46 PM
Y - Posted another small gain today with below average volume, wedging higher. Confirming volume-driven gains are needed to help clinch a convincing technical buy signal. Bullish action came after it reported earnings +293% on +64% sales revenues for the Mar '21 quarter versus the year ago period, its 3rd strong comparison. Completed a new Public Offering on 3/24/21.
>>> FEATURED STOCK ARTICLE : Hit New High But Closed Below Pivot Point - 4/23/2021 |
View all notes |
Set NEW NOTE alert |
Company Profile |
SEC
News |
Chart |
Request a new note
C
A
S
I |
CROX
-
NASDAQ
Crocs Inc
CONSUMER NON-DURABLES - Textile - Apparel Footwear
|
$101.86
|
+3.45
3.51% |
$101.90
|
1,952,257
150.75% of 50 DAV
50 DAV is 1,295,000
|
$102.85
-0.96%
|
4/27/2021
|
$99.81
|
PP = $86.50
|
|
MB = $90.83
|
Most Recent Note - 4/29/2021 3:18:56 PM
G - Color code is changed to green while getting more extended from the latest base with above average volume behind today's 7th consecutive gain. Prior highs in the $86 area define initial support to watch on pullbacks. See the latest FSU analysis for more details and an annotated graph.
>>> FEATURED STOCK ARTICLE : Powerful "Breakaway Gap" for CROX - 4/27/2021 |
View all notes |
Set NEW NOTE alert |
Company Profile |
SEC
News |
Chart |
Request a new note
C
A
S
I |
CRL
-
NYSE
Charles River Labs Intl
DRUGS - Biotechnology
|
$333.87
|
-0.93
-0.28% |
$337.07
|
205,744
64.70% of 50 DAV
50 DAV is 318,000
|
$337.48
-1.07%
|
12/17/2020
|
$247.06
|
PP = $257.98
|
|
MB = $270.88
|
Most Recent Note - 4/26/2021 5:11:39 PM
G - Wedged to another new all-time high with today's 4th consecutive gain backed by lighter volume. Its 50 DMA line ($295) acted as support throughout its ongoing ascent. Its Relative Strength Rating is 84, above the 80+ minimum guideline for buy candidates. Dec '20 quarterly earnings rose +19% on +14% sales revenues versus the year ago period, below the +25% minimum earnings guideline (C criteria), raising fundamental concerns.
>>> FEATURED STOCK ARTICLE : Perched at Record High After Rally From 50-Day Moving Average - 4/9/2021 |
View all notes |
Set NEW NOTE alert |
Company Profile |
SEC
News |
Chart |
Request a new note
C
A
S
I |
CAMT
-
NASDAQ
Camtek Ltd
ELECTRONICS - Scientific and Technical Instrum
|
$34.69
|
-0.17
-0.49% |
$36.14
|
314,401
103.42% of 50 DAV
50 DAV is 304,000
|
$35.65
-2.69%
|
4/28/2021
|
$35.03
|
PP = $35.34
|
|
MB = $37.11
|
Most Recent Note - 4/28/2021 5:00:17 PM
Y - Color code was changed to yellow with pivot point cited based on its 4/13/21 high plus 10 cents. After forming an advanced "ascending base" pattern it touched a new all-time high with today's 4th consecutive gain backed by above average volume. Subsequent gains and a strong close above the pivot point backed by at least +40% above average volume may trigger a technical buy signal. Completed a new Public Offering on 11/19/20. Found prompt support near its 50 DMA line ($30.31) during recent consolidations. Reported earnings +267% on +90% sales revenues for the Mar '21 quarter versus the year ago period, its 3rd strong quarterly comparison well above the +25% minimum guideline and showing impressive sequential acceleration. This Israeli Electronics firm has a strong annual earnings (A criteria) history. See the latest FSU analysis for more details and a new annotated graph.
>>> FEATURED STOCK ARTICLE : Earnings Acceleration and Perched at High After Ascending Base - 4/28/2021 |
View all notes |
Set NEW NOTE alert |
Company Profile |
SEC
News |
Chart |
Request a new note
C
A
S
I |
BRKS
-
NASDAQ
Brooks Automation
ELECTRONICS - Semiconductor Equipment and Mate
|
$103.10
|
-4.37
-4.07% |
$107.93
|
755,543
102.52% of 50 DAV
50 DAV is 737,000
|
$108.72
-5.17%
|
4/5/2021
|
$99.31
|
PP = $91.88
|
|
MB = $96.47
|
Most Recent Note - 4/29/2021 3:12:46 PM
G - Pulling back from its all-time high with today's big loss. Extended from the prior base. Prior highs in the $91 area define initial support to watch above its 50 DMA line ($89.08).
>>> FEATURED STOCK ARTICLE : High Ranked Semiconductor Equipment Firm Powered Higher - 4/7/2021 |
View all notes |
Set NEW NOTE alert |
Company Profile |
SEC
News |
Chart |
Request a new note
C
A
S
I |
Symbol/Exchange
Company Name
Industry Group |
PRICE |
CHANGE
(%Change) |
Day High |
Volume
(% DAV)
(% 50 day avg vol) |
52 Wk Hi
% From Hi |
Featured
Date |
Price
Featured |
Pivot Featured |
|
Max Buy |
ENTG
-
NASDAQ
Entegris Inc
ELECTRONICS - Semiconductor Equipment and Mate
|
$114.91
|
+0.12
0.10% |
$117.59
|
868,814
93.62% of 50 DAV
50 DAV is 928,000
|
$126.41
-9.10%
|
4/1/2021
|
$118.42
|
PP = $110.37
|
|
MB = $115.89
|
Most Recent Note - 4/27/2021 5:35:58 PM
Y - Recently found support while consolidating near the prior high in the $110 area which defines support to watch above its 50 DMA line ($108.73). More damaging losses would raise concerns and trigger technical sell signals.
>>> FEATURED STOCK ARTICLE : Negated Recent Breakout and Sputtering Near Prior High - 4/22/2021 |
View all notes |
Set NEW NOTE alert |
Company Profile |
SEC
News |
Chart |
Request a new note
C
A
S
I |
OPY
-
NYSE
Oppenheimer Holdings Inc
FINANCIAL SERVICES - Investment Brokerage - Regiona
|
$47.52
|
+0.16
0.34% |
$47.90
|
66,257
53.87% of 50 DAV
50 DAV is 123,000
|
$48.33
-1.68%
|
2/25/2021
|
$38.95
|
PP = $38.11
|
|
MB = $40.02
|
Most Recent Note - 4/29/2021 5:54:51 PM
G - Posted another small gain today with below average volume for a best-ever close. Extended from any sound base, and its prior high in the $44 area defines initial support to watch above its 50 DMA line ($41.88).
>>> FEATURED STOCK ARTICLE : Negative Reversal After 7 Consecutive Gains - 4/20/2021 |
View all notes |
Set NEW NOTE alert |
Company Profile |
SEC
News |
Chart |
Request a new note
C
A
S
I |
LAD
-
NYSE
Lithia Motors Inc Cl A
SPECIALTY RETAIL - Auto Dealerships
|
$387.35
|
-8.23
-2.08% |
$398.80
|
286,937
95.65% of 50 DAV
50 DAV is 300,000
|
$417.98
-7.33%
|
4/21/2021
|
$377.00
|
PP = $418.08
|
|
MB = $438.98
|
Most Recent Note - 4/27/2021 5:32:23 PM
Y - Posted a gain today with +19% above average volume. Stubbornly held its ground and wedged higher since highlighted in yellow in the 4/21/21 mid-day report with a pivot point cited based on its 3/17/21 high plus 10 cents. Subsequent gains above the pivot point backed by at least +40% above average volume may trigger a technical buy signal.
>>> FEATURED STOCK ARTICLE : Building a Base With Rebound Above 50-Day Moving Average - 4/21/2021 |
View all notes |
Set NEW NOTE alert |
Company Profile |
SEC
News |
Chart |
Request a new note
C
A
S
I |
CLFD
-
NASDAQ
Clearfield Inc
TELECOMMUNICATIONS - Cables / Satalite Equipment
|
$36.40
|
-0.61
-1.65% |
$37.61
|
82,003
56.55% of 50 DAV
50 DAV is 145,000
|
$40.26
-9.59%
|
4/26/2021
|
$39.68
|
PP = $38.85
|
|
MB = $40.79
|
Most Recent Note - 4/27/2021 5:28:42 PM
Y - Pulled back for a big loss today, retreating abruptly. Finished strong on the prior session after highlighted in yellow with new pivot point cited based on its 2/16/21 high plus 10 cents. The big gain for a new 52-week high and strong close above the pivot point backed by +273% above average volume clinched a convincing new technical buy signal. Rebounded above its 50 DMA line ($32.23) with a big gap up on the prior session. Bullish action came after it reported Mar '21 quarterly earnings +440% on +45% sales revenues versus the year ago period, continuing its strong earnings track record. Found support near prior highs in the $28 area since dropped from the Featured Stocks list on 3/29/21.
>>> FEATURED STOCK ARTICLE : Rallied Straight Up From Bottom of 10-Week Base - 4/26/2021 |
View all notes |
Set NEW NOTE alert |
Company Profile |
SEC
News |
Chart |
Request a new note
C
A
S
I |
EDUC
-
NASDAQ
Educational Development
WHOLESALE - Basic Materials Wholesale
|
$18.05
|
+0.07
0.39% |
$18.57
|
11,617
43.03% of 50 DAV
50 DAV is 27,000
|
$20.00
-9.75%
|
3/10/2021
|
$17.89
|
PP = $20.10
|
|
MB = $21.11
|
Most Recent Note - 4/27/2021 12:26:38 PM
Y - Tallying a big volume-driven gain today after 3 gains backed by light volume. Volume totals cooled while consolidating above its 50 DMA line ($17.14) which defines important near-term support. Met stubborn resistance in the $19-20 area. Subsequent gains above the pivot point backed by at least +40% above average volume are needed to trigger a proper technical buy signal.
>>> FEATURED STOCK ARTICLE : Finding Support During Consolidation Above 50-Day Moving Average - 4/16/2021 |
View all notes |
Set NEW NOTE alert |
Company Profile |
SEC
News |
Chart |
Request a new note
C
A
S
I |
Symbol/Exchange
Company Name
Industry Group |
PRICE |
CHANGE
(%Change) |
Day High |
Volume
(% DAV)
(% 50 day avg vol) |
52 Wk Hi
% From Hi |
Featured
Date |
Price
Featured |
Pivot Featured |
|
Max Buy |
SMPL
-
NASDAQ
Simply Good Foods Co
Food-Confectionery
|
$34.86
|
+0.21
0.61% |
$35.34
|
282,741
39.82% of 50 DAV
50 DAV is 710,000
|
$35.25
-1.11%
|
12/28/2020
|
$30.40
|
PP = $31.44
|
|
MB = $33.01
|
Most Recent Note - 4/26/2021 5:21:36 PM
G - Posted a quiet gain today for its 2nd best ever close, still perched within close striking distance of its 52-week and all-time highs with volume totals cooling. Reported Feb '21 quarterly earnings +9% on +2% sales revenues versus the year ago period, below the +25% minimum earnings guideline (C criteria), raising fundamental concerns. Found prompt support near its 50 DMA line ($31.23) but its current Relative Strength Rating is 79, one notch below the 80+ minimum guideline for buy candidates.
>>> FEATURED STOCK ARTICLE : Perched Near High But Fundamental Concerns Were Raised - 4/14/2021 |
View all notes |
Set NEW NOTE alert |
Company Profile |
SEC
News |
Chart |
Request a new note
C
A
S
I |
IBP
-
NYSE
Installed Building Prod
DIVERSIFIED SERVICES - Business/Management Services
|
$136.01
|
+3.89
2.94% |
$136.39
|
196,407
88.07% of 50 DAV
50 DAV is 223,000
|
$135.63
0.28%
|
4/19/2021
|
$131.15
|
PP = $130.21
|
|
MB = $136.72
|
Most Recent Note - 4/29/2021 5:52:16 PM
Y - Hit a new all-time high with today's gain backed by higher (but below average) volume. A volume-driven gain and strong close above its pivot point on 4/23/21 helped clinch a convincing technical buy signal. Reported earnings +34% on +10% sales revenues for the Dec '20 quarter versus the year-ago period. Three of the past 4 consecutive quarterly comparisons were above the +25% minimum earnings guideline (C criteria). Annual earnings (A criteria) history has been strong.
>>> FEATURED STOCK ARTICLE : Steady Streak of Gains Into New High Territory - 4/19/2021 |
View all notes |
Set NEW NOTE alert |
Company Profile |
SEC
News |
Chart |
Request a new note
C
A
S
I |
QRVO
-
NASDAQ
Qorvo Inc
ELECTRONICS - Semiconductor - Integrated Cir
|
$199.54
|
+2.49
1.26% |
$201.68
|
864,313
76.02% of 50 DAV
50 DAV is 1,137,000
|
$201.50
-0.97%
|
4/1/2021
|
$190.48
|
PP = $191.92
|
|
MB = $201.52
|
Most Recent Note - 4/29/2021 5:49:18 PM
Y - Posted a small gain today with light volume for a best-ever close. Its 50 DMA line ($182) acted as support when it stalled after recently wedging up to new highs from a 9-week base. Its Relative Strength Rating is 79, one notch below the 80+ minimum for buy candidates. See the latest FSU analysis for more details and a new annotated graph.
>>> FEATURED STOCK ARTICLE : Quiet Gain For Best Ever Close - 4/29/2021 |
View all notes |
Set NEW NOTE alert |
Company Profile |
SEC
News |
Chart |
Request a new note
C
A
S
I |
YETI
-
NYSE
Yeti Holdings Inc
Leisure-Products
|
$88.20
|
+0.58
0.66% |
$89.00
|
652,527
48.62% of 50 DAV
50 DAV is 1,342,000
|
$89.70
-1.67%
|
4/6/2021
|
$76.95
|
PP = $79.42
|
|
MB = $83.39
|
Most Recent Note - 4/27/2021 5:34:08 PM
G - Perched at its all-time high, extended from the latest base, it posted a 3rd consecutive gain today with lighter volume. Prior highs in the $80 area define initial support to watch on pullbacks.
>>> FEATURED STOCK ARTICLE : YETI Perched Within Striking Distance of High - 4/7/2021 |
View all notes |
Set NEW NOTE alert |
Company Profile |
SEC
News |
Chart |
Request a new note
C
A
S
I |
DT
-
NYSE
Dynatrace Inc
Computer Sftwr-Enterprse
|
$52.86
|
-1.70
-3.12% |
$54.99
|
1,068,960
52.58% of 50 DAV
50 DAV is 2,033,000
|
$56.94
-7.17%
|
4/26/2021
|
$54.43
|
PP = $57.04
|
|
MB = $59.89
|
Most Recent Note - 4/29/2021 3:15:34 PM
Y - Pulling back today for a 2nd consecutive loss on below average volume. Consolidating above its 50 DMA line ($51.38) and perched within striking distance of its 52-week high. Subsequent gains above the pivot point backed by at least +40% above average volume may trigger a new (or add-on) technical buy signal. Recent lows in the $45 area define important near-term support to watch on pullbacks. Its Relative Strength Rating is 77, below the 80+ minimum guideline for buy candidates, however it is perched only -7.1% off its all-time high. Fundamentals remain strong after it reported Dec '20 earnings +70% on +28% sales revenues versus the year ago period.
>>> FEATURED STOCK ARTICLE : Gap Up Rebounding Further Above 50-Day Moving Average - 4/8/2021 |
View all notes |
Set NEW NOTE alert |
Company Profile |
SEC
News |
Chart |
Request a new note
C
A
S
I |
Symbol/Exchange
Company Name
Industry Group |
PRICE |
CHANGE
(%Change) |
Day High |
Volume
(% DAV)
(% 50 day avg vol) |
52 Wk Hi
% From Hi |
Featured
Date |
Price
Featured |
Pivot Featured |
|
Max Buy |
MRBK
-
NASDAQ
Meridian Corp
Banks-Northeast
|
$26.44
|
+0.63
2.44% |
$26.86
|
86,620
234.11% of 50 DAV
50 DAV is 37,000
|
$27.96
-5.44%
|
2/22/2021
|
$25.58
|
PP = $26.10
|
|
MB = $27.41
|
Most Recent Note - 4/29/2021 12:33:25 PM
Y - Consolidating above its 50 DMA line ($25.71) and perched within striking distance of its 52-week high. Reported Mar '21 earnings +323% on +93% sales revenues versus the year ago period, continuing its strong earnings track record. Recent low ($24.01 on 4/21/21) defines important near-term support where any violation may trigger a worrisome technical sell signal. Its Relative Strength Rating is right at the 80 minimum guideline.
>>> FEATURED STOCK ARTICLE : Encountering Distributional Pressure - 4/12/2021 |
View all notes |
Set NEW NOTE alert |
Company Profile |
SEC
News |
Chart |
Request a new note
C
A
S
I |
|
|
|
THESE ARE NOT BUY RECOMMENDATIONS!
Comments contained in the body of this report are technical
opinions only. The material herein has been obtained
from sources believed to be reliable and accurate, however,
its accuracy and completeness cannot be guaranteed.
This site is not an investment advisor, hence it does
not endorse or recommend any securities or other investments.
Any recommendation contained in this report may not
be suitable for all investors and it is not to be deemed
an offer or solicitation on our part with respect to
the purchase or sale of any securities. All trademarks,
service marks and trade names appearing in this report
are the property of their respective owners, and are
likewise used for identification purposes only.
This report is a service available
only to active Paid Premium Members.
You may opt-out of receiving report notifications
at any time. Questions or comments may be submitted
by writing to Premium Membership Services 665 S.E. 10 Street, Suite 201 Deerfield Beach, FL 33441-5634 or by calling 1-800-965-8307
or 954-785-1121.
|
|
|