You are not logged in.
This means you
CAN ONLY VIEW reports that were published prior to Thursday, March 20, 2025.
You
MUST UPGRADE YOUR MEMBERSHIP if you want to see any current reports.
AFTER MARKET UPDATE - MONDAY, APRIL 5TH, 2021
Previous After Market Report Next After Market Report >>>
|
|
|
|
DOW |
+373.98 |
33,527.19 |
+1.13% |
|
Volume |
869,199,994 |
-1% |
|
Volume |
4,434,412,500 |
-2% |
|
NASDAQ |
+224.54 |
13,704.64 |
+1.67% |
|
Advancers |
2,040 |
63% |
|
Advancers |
2,402 |
59% |
|
S&P 500 |
+58.04 |
4,077.91 |
+1.44% |
|
Decliners |
1,216 |
37% |
|
Decliners |
1,646 |
41% |
|
Russell 2000 |
+10.98 |
2,264.89 |
+0.49% |
|
52 Wk Highs |
318 |
|
|
52 Wk Highs |
269 |
|
|
S&P 600 |
+5.71 |
1,346.01 |
+0.43% |
|
52 Wk Lows |
15 |
|
|
52 Wk Lows |
39 |
|
|
 |
Leadership Improved as Major Indices Posted Solid Gains
Kenneth J. Gruneisen - Passed the CAN SLIM® Master's Exam
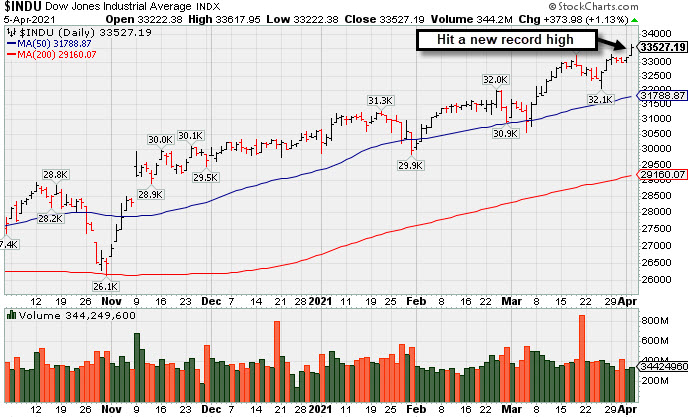
The Dow gained 373 points, while the S&P 500 jumped 1.4%, with both benchmarks closing at new record levels. The Nasdaq Composite climbed 1.7%, ending within 3% of its February 12 all-time high. The volume totals were lighter than the prior session totals on the NYSE and on the Nasdaq exchange. Breadth was positive as advancers led decliners by a 5-3 margin on the NYSE and by a 3-2 margin on the Nasdaq exchange. Leadership improved as there were 69 high-ranked companies from the Leaders List that hit new 52-week highs and were listed on the BreakOuts Page, versus the total of 37 on the prior session. New 52-week highs totals expanded and solidly outnumbered new 52-week lows on the NYSE on the Nasdaq exchange. The major indices (M criteria) are in a confirmed uptrend. Investors are reminded to always make buying and selling decisions on case-by-case basis under the strict criteria and rules of the fact-based investment system.
PICTURED: The Dow Jones Industrial Average hit a new record high.
U.S. stocks finished higher on Monday as investors digested blowout data releases that bolstered the case for a swift economic rebound. On the data front last Friday, the Labor Department revealed 916,000 jobs were added to the economy in March, the most in seven months. Additionally, a report this morning from the Institute for Supply Management (ISM) showed the services sector expanded at the fastest rate on record in March. Treasuries were little changed, with the yield on the 10-year note down one basis point to 1.71%. In commodities, WTI crude fell 4.4% to $58.75/barrel after OPEC+ decided to gradually lift output curbs between May and July.
Ten of 11 S&P 500 sectors closed in positive territory, with Energy the sole laggard. In corporate news, Tesla (TSLA +4.43%) rose after delivering a record number of vehicles during the first quarter. Elsewhere, Google parent Alphabet (GOOGL +4.19%) rose following a favorable ruling from the U.S. Supreme Court concerning an Android copyright infringement case.
In other news, U.S. Treasury Secretary Janet Yellen said she was working with G20 nations to compromise on a global corporate minimum tax rate, to “end the pressures of tax competition.” This tax is a key factor in President Biden’s $2.25 trillion infrastructure plan unveiled last week, as it would be partially funded by a U.S. corporate tax rate hike. |
 Kenneth J. Gruneisen started out as a licensed stockbroker in August 1987, a couple of months prior to the historic stock market crash that took the Dow Jones Industrial Average down -22.6% in a single day. He has published daily fact-based fundamental and technical analysis on high-ranked stocks online for two decades. Through FACTBASEDINVESTING.COM, Kenneth provides educational articles, news, market commentary, and other information regarding proven investment systems that work in good times and bad.
Comments contained in the body of this report are technical opinions only and are not necessarily those of Gruneisen Growth Corp. The material herein has been obtained from sources believed to be reliable and accurate, however, its accuracy and completeness cannot be guaranteed. Our firm, employees, and customers may effect transactions, including transactions contrary to any recommendation herein, or have positions in the securities mentioned herein or options with respect thereto. Any recommendation contained in this report may not be suitable for all investors and it is not to be deemed an offer or solicitation on our part with respect to the purchase or sale of any securities. |
|
 |
Widespread Group Gains While Energy Indexes Fell
Kenneth J. Gruneisen - Passed the CAN SLIM® Master's Exam
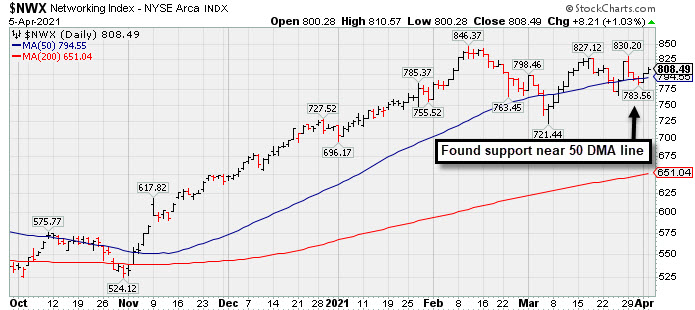
The Retail Index ($RLX +1.95%), Broker/Dealer Index ($XBD +1.42%), and Bank Index ($BKX +0.41%) posted gains on Monday's widely positive session. The Semiconductor Index ($SOX +2.06%) outpaced the Networking Index ($NWX +1.03%) and the Biotech Index ($BTK +0.53%) as the tech sector also enjoyed a positive bias. Commodity-linked groups were mixed as the Gold & Silver Index ($XAU +0.50%) edged higher but energy-related stocks faced pressure as the Oil Services Index ($OSX -2.56%) and Integrated Oil Index ($XOI -2.79%) both lost ground.PICTURED: The Networking Index ($NWX +1.03%) found support near its 50-day moving average (DMA) line and has been hovering near its all-time high.
| Oil Services |
$OSX |
53.72 |
-1.41 |
-2.56% |
+21.19% |
| Integrated Oil |
$XOI |
1,011.61 |
-29.07 |
-2.79% |
+27.65% |
| Semiconductor |
$SOX |
3,306.82 |
+66.64 |
+2.06% |
+18.29% |
| Networking |
$NWX |
808.49 |
+8.21 |
+1.03% |
+12.74% |
| Broker/Dealer |
$XBD |
456.33 |
+6.40 |
+1.42% |
+20.85% |
| Retail |
$RLX |
3,777.79 |
+72.16 |
+1.95% |
+6.02% |
| Gold & Silver |
$XAU |
140.63 |
+0.70 |
+0.50% |
-2.47% |
| Bank |
$BKX |
121.89 |
+0.49 |
+0.41% |
+24.50% |
| Biotech |
$BTK |
5,601.33 |
+29.37 |
+0.53% |
-2.40% |
|
|
|
 |
Hit Another New High With Even Less Volume Conviction
Kenneth J. Gruneisen - Passed the CAN SLIM® Master's Exam
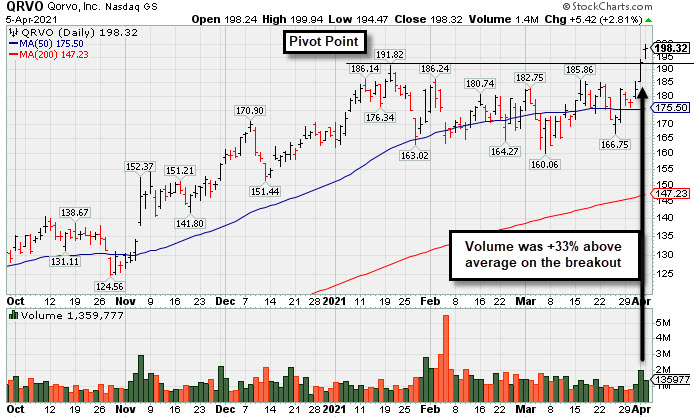
Qorvo Inc (QRVO +$5.42 or +2.81% to $198.32) posted a 3rd consecutive gain today with lighter volume while hitting another new 52-week high. It was highlighted in yellow in the 4/01/21 mid-day report (read here) after forming a base of sufficient length. QVRO traded above and below its 50-day moving average (DMA) line in recent months.
Volume was +33% above average on the prior session as QRVO broke out from any orderly 9-week base. Volume should be at least +40% above average to trigger a proper technical buy signal. So, disciplined investors may watch for confirming gains in the days ahead as a reassurance of fresh institutional buying demand that can lead to a significant new leg higher.
QRVO has a 94 Earnings Per Share Rating. It reported Dec '20 quarterly earnings +66% on +26% sales revenues versus the year ago period. Three of the 4 latest quarterly comparisons were above the +25% minimum guideline (C criteria). Annual earnings growth has been steady.
The number of top-rated funds owning its shares rose from 1,363 in Mar '20 to 1,573 in Dec '20, a reassuring sign concerning the I criteria. It has 113.3 million shares outstanding (S criteria). Its current Accumulation/Distribution Rating is A-. However, its Up/Down Volume Ratio of 0.9 is an unbiased indication its shares have been under slight distributional pressure over the past 50 days. |
|
|
Color Codes Explained :
Y - Better candidates highlighted by our
staff of experts.
G - Previously featured
in past reports as yellow but may no longer be buyable under the
guidelines.
***Last / Change / Volume data in this table is the closing quote data***
Symbol/Exchange
Company Name
Industry Group |
PRICE |
CHANGE
(%Change) |
Day High |
Volume
(% DAV)
(% 50 day avg vol) |
52 Wk Hi
% From Hi |
Featured
Date |
Price
Featured |
Pivot Featured |
|
Max Buy |
 FBC
-
NYSE
FBC
-
NYSE
Flagstar Bancorp Inc
BANKING - Savings and Loans
|
$45.70
|
+0.14
0.31% |
$46.27
|
337,927
52.07% of 50 DAV
50 DAV is 649,000
|
$51.58
-11.40%
|
3/4/2021
|
$47.26
|
PP = $48.02
|
|
MB = $50.42
|
 Most Recent Note - 4/5/2021 6:10:47 PM
G - Sputtering near its 50 DMA line ($45.68) with volume totals cooling in recent weeks. Near-term support to watch is prior lows.
>>> FEATURED STOCK ARTICLE : Slumping Into Prior Base Following Breakout - 3/22/2021 |
View all notes |
Set NEW NOTE alert |
Company Profile |
SEC
News |
Chart |
Request a new note
C
A
S
I |
CRL
-
NYSE
Charles River Labs Intl
DRUGS - Biotechnology
|
$297.89
|
+3.72
1.26% |
$298.00
|
271,767
87.10% of 50 DAV
50 DAV is 312,000
|
$303.79
-1.94%
|
12/17/2020
|
$247.06
|
PP = $257.98
|
|
MB = $270.88
|
Most Recent Note - 3/31/2021 6:27:48 PM
G - Posted a gain today with above average volume but ended near the session low. Consolidating above its 50 DMA line ($280) which acted as support throughout its ongoing ascent. Its Relative Strength Rating is 75, below the 80+ minimum guideline for buy candidates. Recently reported Dec '20 quarterly earnings +19% on +14% sales revenues versus the year ago period, below the +25% minimum earnings guideline (C criteria), raising fundamental concerns.
>>> FEATURED STOCK ARTICLE : Made Gradual Progress, Now Extended From Any Sound Base - 3/16/2021 |
View all notes |
Set NEW NOTE alert |
Company Profile |
SEC
News |
Chart |
Request a new note
C
A
S
I |
BRKS
-
NASDAQ
Brooks Automation
ELECTRONICS - Semiconductor Equipment and Mate
|
$98.36
|
+7.72
8.52% |
$101.43
|
1,668,584
246.47% of 50 DAV
50 DAV is 677,000
|
$91.78
7.17%
|
4/5/2021
|
$99.31
|
PP = $91.88
|
|
MB = $96.47
|
Most Recent Note - 4/5/2021 6:07:20 PM
Y - Finished strong today after highlighted in yellow with pivot point cited based on its 2/12/21 high plus 10 cents. Hit a new all-time high with heavier volume behind today's 4th consecutive gain while clearing a 6-week base and quickly getting extended. Found support after undercutting its 50 DMA line ($82.80) in recent weeks. Reported earnings +104% on +19% sales revenues for the Dec '20 quarter versus the year ago period, its 6th consecutive quarterly comparison above the +25% minimum earnings guideline (C criteria). Annual earnings history (A criteria) included a downturn in FY '18.
>>> FEATURED STOCK ARTICLE : Volume Was Heavy Behind Big Breakout Gain - 6/15/2018 |
View all notes |
Set NEW NOTE alert |
Company Profile |
SEC
News |
Chart |
Request a new note
C
A
S
I |
ENTG
-
NASDAQ
Entegris Inc
ELECTRONICS - Semiconductor Equipment and Mate
|
$120.41
|
+0.32
0.27% |
$126.41
|
1,884,602
201.35% of 50 DAV
50 DAV is 936,000
|
$120.78
-0.31%
|
4/1/2021
|
$118.42
|
PP = $110.37
|
|
MB = $115.89
|
Most Recent Note - 4/5/2021 6:09:46 PM
G - Hit yet another new high today, quickly getting extended from prior highs and its color code was changed to green. Prior highs define initial support to watch on pullbacks.
>>> FEATURED STOCK ARTICLE : Strong Breakout Action With +67% Above Average Volume - 4/1/2021 |
View all notes |
Set NEW NOTE alert |
Company Profile |
SEC
News |
Chart |
Request a new note
C
A
S
I |
OPY
-
NYSE
Oppenheimer Holdings Inc
FINANCIAL SERVICES - Investment Brokerage - Regiona
|
$41.55
|
+0.71
1.74% |
$41.98
|
130,625
94.66% of 50 DAV
50 DAV is 138,000
|
$44.38
-6.38%
|
2/25/2021
|
$38.95
|
PP = $38.11
|
|
MB = $40.02
|
Most Recent Note - 3/31/2021 6:19:52 PM
Y - Consolidating near its "max buy" level after getting extended from the previously noted base. Its 50 DMA line ($38.15) defines near-term support to watch. See the latest FSU analysis for more details and a new annotated graph.
>>> FEATURED STOCK ARTICLE : Oppenheimer Consolidating Near Max Buy Level - 3/31/2021 |
View all notes |
Set NEW NOTE alert |
Company Profile |
SEC
News |
Chart |
Request a new note
C
A
S
I |
Symbol/Exchange
Company Name
Industry Group |
PRICE |
CHANGE
(%Change) |
Day High |
Volume
(% DAV)
(% 50 day avg vol) |
52 Wk Hi
% From Hi |
Featured
Date |
Price
Featured |
Pivot Featured |
|
Max Buy |
EDUC
-
NASDAQ
Educational Development
WHOLESALE - Basic Materials Wholesale
|
$18.06
|
+0.73
4.21% |
$18.21
|
16,395
48.22% of 50 DAV
50 DAV is 34,000
|
$20.00
-9.70%
|
3/10/2021
|
$17.89
|
PP = $20.10
|
|
MB = $21.11
|
Most Recent Note - 4/5/2021 6:08:49 PM
Y - Posted a quiet gain today. Recently found support above its 50 DMA line ($16.34) but it has still met stubborn resistance in the $19-20 area. Subsequent gains above the pivot point backed by at least +40% above average volume are needed to trigger a proper technical buy signal. This thinly traded Media - Books firm's annual earnings (A criteria) history has strong.
>>> FEATURED STOCK ARTICLE : Consolidating Above 50 DMA Line Perched Near High - 3/30/2021 |
View all notes |
Set NEW NOTE alert |
Company Profile |
SEC
News |
Chart |
Request a new note
C
A
S
I |
SMPL
-
NASDAQ
Simply Good Foods Co
Food-Confectionery
|
$31.38
|
+0.43
1.39% |
$31.73
|
644,354
91.68% of 50 DAV
50 DAV is 702,800
|
$35.25
-10.98%
|
12/28/2020
|
$30.40
|
PP = $31.44
|
|
MB = $33.01
|
Most Recent Note - 3/30/2021 12:43:38 PM
G - Consolidating just above its 50 DMA line ($29.87), however, its Relative Strength Rating is 61, below the 80+ minimum guideline for buy candidates. Faces resistance due to overhead supply up to the $35 level.
>>> FEATURED STOCK ARTICLE : Violation of 50-Day Moving Average Triggered Technical Sell Signal - 3/24/2021 |
View all notes |
Set NEW NOTE alert |
Company Profile |
SEC
News |
Chart |
Request a new note
C
A
S
I |
QRVO
-
NASDAQ
Qorvo Inc
ELECTRONICS - Semiconductor - Integrated Cir
|
$198.32
|
+5.42
2.81% |
$199.94
|
1,359,772
90.83% of 50 DAV
50 DAV is 1,497,000
|
$194.28
2.08%
|
4/1/2021
|
$190.48
|
PP = $191.92
|
|
MB = $201.52
|
Most Recent Note - 4/5/2021 6:04:20 PM
Y - Posted a 3rd consecutive gain today with lighter volume while hitting a new all-time high, wedging up from any orderly 9-week base. Prior highs in the $191-185 area define initial support to watch on pullbacks. See the latest FSU analysis for more details and a new annotated graph.
>>> FEATURED STOCK ARTICLE : Hit Another New High With Even Less Volume Conviction - 4/5/2021 |
View all notes |
Set NEW NOTE alert |
Company Profile |
SEC
News |
Chart |
Request a new note
C
A
S
I |
UI
-
NYSE
Ubiquity Inc
Telecom-Infrastructure
|
$290.78
|
+1.63
0.56% |
$294.32
|
214,426
157.78% of 50 DAV
50 DAV is 135,900
|
$401.81
-27.63%
|
3/26/2021
|
$383.00
|
PP = $362.99
|
|
MB = $381.14
|
Most Recent Note - 3/31/2021 6:26:41 PM
G - Color code is changed to green after today's 3rd consecutive big loss with even heavier volume violated its 50 DMA line ($327) triggering a technical sell signal. It quickly negated the prior breakout raising immediate concerns. Prior low ($297) may act as support, meanwhile, a rebound above the 50 DMA line is needed for its outlook to improve.
>>> FEATURED STOCK ARTICLE : Volume +231% Above Average With Breakout Gain - 3/26/2021 |
View all notes |
Set NEW NOTE alert |
Company Profile |
SEC
News |
Chart |
Request a new note
C
A
S
I |
DT
-
NYSE
Dynatrace Inc
Computer Sftwr-Enterprse
|
$49.90
|
+0.35
0.71% |
$50.59
|
1,794,364
68.61% of 50 DAV
50 DAV is 2,615,300
|
$56.94
-12.36%
|
2/4/2021
|
$51.39
|
PP = $48.95
|
|
MB = $51.40
|
Most Recent Note - 3/31/2021 6:22:28 PM
G - Posted a gain with light volume today rebounding toward its 50 DMA line ($49.88) after damaging losses undercut prior highs in the $48 area. Its Relative Strength Rating is 59, well below the 80+ minimum guideline for buy candidates. Fundamentals remain strong after it reported Dec '20 earnings +70% on +28% sales revenues versus the year ago period.
>>> FEATURED STOCK ARTICLE : 50-Day Moving Average Line Tested Again - 3/19/2021 |
View all notes |
Set NEW NOTE alert |
Company Profile |
SEC
News |
Chart |
Request a new note
C
A
S
I |
Symbol/Exchange
Company Name
Industry Group |
PRICE |
CHANGE
(%Change) |
Day High |
Volume
(% DAV)
(% 50 day avg vol) |
52 Wk Hi
% From Hi |
Featured
Date |
Price
Featured |
Pivot Featured |
|
Max Buy |
MRBK
-
NASDAQ
Meridian Corp
Banks-Northeast
|
$25.84
|
+0.01
0.04% |
$26.30
|
29,063
80.73% of 50 DAV
50 DAV is 36,000
|
$27.96
-7.58%
|
2/22/2021
|
$25.58
|
PP = $26.10
|
|
MB = $27.41
|
Most Recent Note - 3/30/2021 12:22:08 PM
Y - Perched within close striking distance of its all-time high. Its prior low ($24.13 on 3/25/21) and its 50 DMA line ($23.95) define important near-term support to watch where violations may trigger technical sell signals. Its Relative Strength Rating is 77, still below the 80+ minimum guideline.
>>> FEATURED STOCK ARTICLE : Prior High Defines Initial Support to Watch - 3/15/2021 |
View all notes |
Set NEW NOTE alert |
Company Profile |
SEC
News |
Chart |
Request a new note
C
A
S
I |
|
|
|
THESE ARE NOT BUY RECOMMENDATIONS!
Comments contained in the body of this report are technical
opinions only. The material herein has been obtained
from sources believed to be reliable and accurate, however,
its accuracy and completeness cannot be guaranteed.
This site is not an investment advisor, hence it does
not endorse or recommend any securities or other investments.
Any recommendation contained in this report may not
be suitable for all investors and it is not to be deemed
an offer or solicitation on our part with respect to
the purchase or sale of any securities. All trademarks,
service marks and trade names appearing in this report
are the property of their respective owners, and are
likewise used for identification purposes only.
This report is a service available
only to active Paid Premium Members.
You may opt-out of receiving report notifications
at any time. Questions or comments may be submitted
by writing to Premium Membership Services 665 S.E. 10 Street, Suite 201 Deerfield Beach, FL 33441-5634 or by calling 1-800-965-8307
or 954-785-1121.
|
|
|