You are not logged in.
This means you
CAN ONLY VIEW reports that were published prior to Thursday, April 10, 2025.
You
MUST UPGRADE YOUR MEMBERSHIP if you want to see any current reports.
AFTER MARKET UPDATE - WEDNESDAY, MARCH 1ST, 2023
Previous After Market Report Next After Market Report >>>
|
|
|
|
DOW |
+5.14 |
32,661.84 |
+0.02% |
|
Volume |
962,439,720 |
-36% |
|
Volume |
4,910,464,600 |
-7% |
|
NASDAQ |
-76.06 |
11,379.48 |
-0.66% |
|
Advancers |
1,286 |
44% |
|
Advancers |
1,996 |
44% |
|
S&P 500 |
-18.76 |
3,951.39 |
-0.47% |
|
Decliners |
1,655 |
56% |
|
Decliners |
2,500 |
56% |
|
Russell 2000 |
+1.44 |
1,898.43 |
+0.08% |
|
52 Wk Highs |
86 |
|
|
52 Wk Highs |
100 |
|
|
S&P 600 |
+2.62 |
1,251.85 |
+0.21% |
|
52 Wk Lows |
51 |
|
|
52 Wk Lows |
132 |
|
|
 |
Major Indices Sputtered and Ended Mostly Lower
Kenneth J. Gruneisen - Passed the CAN SLIM® Master's Exam
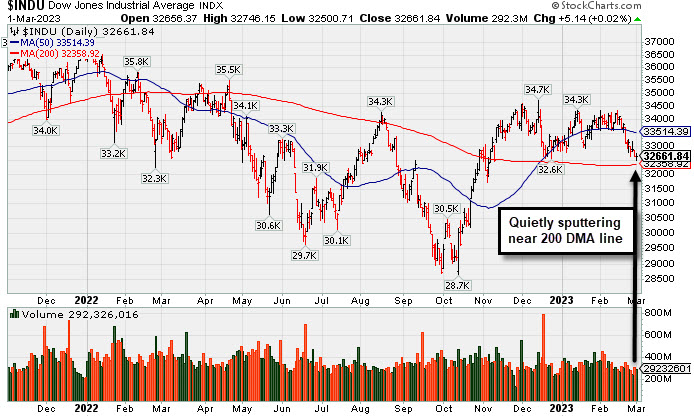
The Dow added 5 points, while the Nasdaq Composite shed 0.7% amid a rout in Technology shares. The S&P 500 fell 0.5%. Volume totals were lighter than the prior session on the NYSE and on the Nasdaq exchange. Breadth was slightly negative as decliners led advancers by a 4-3 margin on the NYSE and 5-4 on the Nasdaq exchange. There were 36 high-ranked companies from the Leaders List that hit new 52-week highs and were listed on the BreakOuts Page, versus 31 on the prior session. New 52-week highs outnumbered new 52-week lows on the NYSE but new lows outnumbered new highs on the Nasdaq exchange. The major indices are in an uptrend under pressure (M criteria). For any rally to be sustained there must be healthy leadership. It will be important to watch for further improvement in the new highs totals in the immediate days ahead. Stay tuned!
PICTURED: The Dow Jones Industrial Average is quietly consolidating just above its 200-day moving average (DMA) line.
U.S. equities finished mixed Wednesday as investors assessed the global economic outlook and the Federal Reserve’s (Fed) future course of monetary policy. Eight of 11 sectors finished in negative territory. In the central bank space, Atlanta Fed President Raphael Bostic supported raising interest rates above 5%, while Minneapolis Fed President Neel Kashkari signaled concern the central bank’s monetary policy is doing little to slow the services sector.
On the data front, the Institute of Supply Management’s (ISM) Manufacturing Index came in at 47.7 in February, its first improvement in six months, though it remains in contractionary territory. Mortgage Bankers Association (MBA) mortgage applications for the week ended February 24 fell 5.5%, bringing mortgage demand to its lowest level in 28 years. Treasuries weakened, with the yield on the benchmark 10-year note climbing seven basis points (0.07%) to 3.99% after briefly topping 4% for the first time since November, while the 30-year bond yield increased three basis points (0.03%) to 3.95%. The yield on the two-year note, which is more sensitive to changes in Fed policy, advanced eight basis points (0.08%) to 4.88%. In commodities, West Texas Intermediate (WTI) crude added 0.9% to $77.73/barrel amid renewed investor optimism over China’s reopening following stronger-than-expected economic data. However, gains were capped after the weekly report from the Energy Information Administration (EIA) data showed a larger-than-forecasted increase in U.S. crude stockpiles. |
 Kenneth J. Gruneisen started out as a licensed stockbroker in August 1987, a couple of months prior to the historic stock market crash that took the Dow Jones Industrial Average down -22.6% in a single day. He has published daily fact-based fundamental and technical analysis on high-ranked stocks online for two decades. Through FACTBASEDINVESTING.COM, Kenneth provides educational articles, news, market commentary, and other information regarding proven investment systems that work in good times and bad.
Comments contained in the body of this report are technical opinions only and are not necessarily those of Gruneisen Growth Corp. The material herein has been obtained from sources believed to be reliable and accurate, however, its accuracy and completeness cannot be guaranteed. Our firm, employees, and customers may effect transactions, including transactions contrary to any recommendation herein, or have positions in the securities mentioned herein or options with respect thereto. Any recommendation contained in this report may not be suitable for all investors and it is not to be deemed an offer or solicitation on our part with respect to the purchase or sale of any securities. |
|
 |
Commodity-Linked Groups Led Gainers
Kenneth J. Gruneisen - Passed the CAN SLIM® Master's Exam
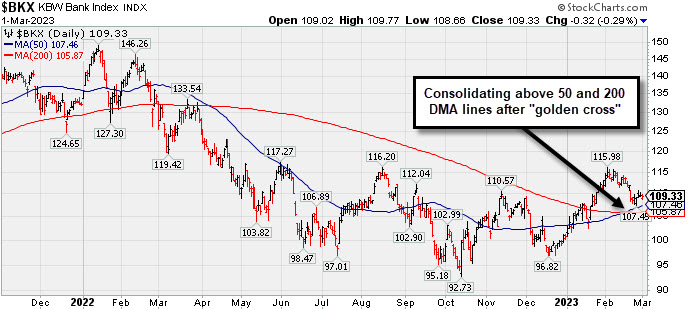
The Retail Index ($RLX -2.07%) created a drag on the major averages while the Bank Index ($BKX -0.29%) edged lower and the Broker/Dealer Index ($XBD +0.05%) finished flat. The Biotech Index ($BTK +1.03%) led the tech sector but the Semiconductor Index ($SOX -0.09%) finished flat and the Networking Index ($NWX -0.52%) edged lower. Commodity-linked groups had a positive bias as the Gold & Silver Index ($XAU +2.82%), Oil Services Index ($OSX +2.41%), and Integrated Oil Index ($XOI +2.76%) each notched a solid gain.
PICTURED: The Bank Index ($BKX -0.29%) has recently been consolidating above its 50-day and 200-day moving average (DMA) lines. The shorter-term average recently crossed above the longer term average, a bullish technical signal termed a "golden cross".
| Oil Services |
$OSX |
89.22 |
+2.10 |
+2.41% |
+6.39% |
| Integrated Oil |
$XOI |
1,785.03 |
+48.00 |
+2.76% |
-0.12% |
| Semiconductor |
$SOX |
2,955.83 |
-2.56 |
-0.09% |
+16.73% |
| Networking |
$NWX |
807.85 |
-4.18 |
-0.52% |
+3.13% |
| Broker/Dealer |
$XBD |
492.17 |
+0.26 |
+0.05% |
+9.58% |
| Retail |
$RLX |
2,824.65 |
-59.74 |
-2.07% |
+2.57% |
| Gold & Silver |
$XAU |
116.94 |
+3.21 |
+2.82% |
-3.25% |
| Bank |
$BKX |
109.33 |
-0.32 |
-0.29% |
+8.41% |
| Biotech |
$BTK |
5,315.36 |
+54.31 |
+1.03% |
+0.65% |
|
|
|
 |
Holding its Ground After Rallying From Previously Noted Base
Kenneth J. Gruneisen - Passed the CAN SLIM® Master's Exam
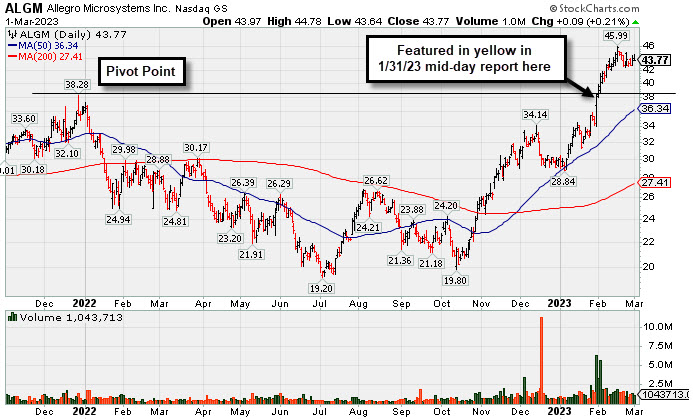
Allegro Microsystems Inc (ALGM +$0.09 or +0.21% to $43.77) has been stubbornly holding its ground with volume totals cooling after getting extended from the previously noted base. The prior high in the $38 area defines initial support to watch on pullbacks.
ALGM was highlighted in yellow with pivot point cited based on its 12/28/21 high plus 10 cents in the 1/31/23 mid-day report (read here) and shown in greater detail that evening with an annotated graph under the headline, "Big Volume-Driven Gain for Best-Ever Close". It hit a new all-time high with a big gain backed by +378% above average volume after a deep 12-month consolidation. Subsequent gains helped clinch a technical buy signal.
The company hails from the Elec-Semiconductor Mfg group which is currently ranked 68th on the 197 Industry Groups list. It has a highest possible 99 Earnings Per Share Rating. Quarterly comparisons through Dec '22 have been above the +25% minimum earnings guideline (C criteria). Annual earnings history has been strong since its $14 IPO in Oct '20. ALGM has a new CEO as of Jun '22.
The number of top-rated funds owning its shares rose from 341 in Mar '22 to 458 in Dec '22, a reassuringn sign concerning the I criteria. The current Up/Down Volume Ratio of 1.3 is an unbiased indication its shares have been under accumulation over the past 50 days.
|
|
|
Color Codes Explained :
Y - Better candidates highlighted by our
staff of experts.
G - Previously featured
in past reports as yellow but may no longer be buyable under the
guidelines.
***Last / Change / Volume data in this table is the closing quote data***
Symbol/Exchange
Company Name
Industry Group |
PRICE |
CHANGE
(%Change) |
Day High |
Volume
(% DAV)
(% 50 day avg vol) |
52 Wk Hi
% From Hi |
Featured
Date |
Price
Featured |
Pivot Featured |
|
Max Buy |
 CMC
-
NYSE
CMC
-
NYSE
Commercial Metals Co
METALS and MINING - Steel and Iron
|
$51.84
|
+0.09
0.17% |
$53.00
|
1,628,814
147.40% of 50 DAV
50 DAV is 1,105,000
|
$58.09
-10.76%
|
10/14/2022
|
$41.61
|
PP = $44.45
|
|
MB = $46.67
|
Most Recent Note - 2/28/2023 2:58:52 PM
G - Consolidating just below its 50 DMA line ($52.84) with volume totals cooling after a damaging loss noted on 2/23/23. The recent low ($50.90 on 2/24/23) defines important near term support where any more damaging losses would raise greater concerns. Fundamentals remain strong.
>>> FEATURED STOCK ARTICLE : Metals Firm Extended From Base and Perched Near High - 2/6/2023 |
View all notes |
Set NEW NOTE alert |
Company Profile |
SEC
News |
Chart |
Request a new note
C
A
S
I |
GPK
-
NYSE
Graphic Packaging Hldg
CONSUMER NON-DURABLES - Packaging and Containers
|
$24.38
|
+0.58
2.44% |
$24.46
|
4,267,987
132.83% of 50 DAV
50 DAV is 3,213,000
|
$24.20
0.74%
|
10/25/2022
|
$22.75
|
PP = $24.17
|
|
MB = $25.38
|
 Most Recent Note - 3/1/2023 1:36:48 PM
Y - Inching higher today for a 5th consecutive small gain, wedging into new all-time high territory with gains lacking great volume conviction. Showed resilience after briefly violating its 50 DMA line on 2/07/23. Members were reminded - "Disciplined investors know that gains above a stock's pivot point must be backed by at least +40% above average volume to trigger a proper technical buy signal."
>>> FEATURED STOCK ARTICLE : Quietly Lingering Near High With Strong Fundamentals - 2/27/2023 |
View all notes |
Set NEW NOTE alert |
Company Profile |
SEC
News |
Chart |
Request a new note
C
A
S
I |
GFF
-
NYSE
Griffon Corporation
MATERIALS and CONSTRUCTION - General Building Materials
|
$36.27
|
-0.20
-0.55% |
$37.16
|
493,773
95.14% of 50 DAV
50 DAV is 519,000
|
$43.74
-17.08%
|
11/10/2022
|
$34.13
|
PP = $35.02
|
|
MB = $36.77
|
Most Recent Note - 2/28/2023 3:02:58 PM
G - A rebound above the 50 DMA line is needed for its outlook to improve. Violated its 50 DMA line ($38.09) with a damaging volume-driven loss triggering a technical sell signal when last noted on 2/21/23 and it has failed to rebound above that important short-term average. More damaging losses would raise greater concerns. Reported Dec '22 quarterly earnings +121 on +10% sales revenues versus the year ago period.
>>> FEATURED STOCK ARTICLE : Extended From Any Sound Base and Still Hitting New Highs - 2/2/2023 |
View all notes |
Set NEW NOTE alert |
Company Profile |
SEC
News |
Chart |
Request a new note
C
A
S
I |
TITN
-
NASDAQ
Titan Machinery Inc
SPECIALTY RETAIL
|
$45.97
|
+0.18
0.39% |
$46.82
|
195,450
89.66% of 50 DAV
50 DAV is 218,000
|
$47.79
-3.81%
|
1/13/2023
|
$40.10
|
PP = $44.45
|
|
MB = $46.67
|
Most Recent Note - 2/28/2023 6:22:50 PM
Y - Color code is changed to yellow after it pulled back today below its "max buy" level with above average volume after hitting a new all-time high with a volume-driven gain on the prior session. Its 50 DMA line ($42.16) definies important near-term support to watch on pullbacks. See the latest FSU analysis for more details and a new annotated graph.
>>> FEATURED STOCK ARTICLE : Pulled Back from New All-Time High - 2/28/2023 |
View all notes |
Set NEW NOTE alert |
Company Profile |
SEC
News |
Chart |
Request a new note
C
A
S
I |
MYE
-
NYSE
Myers Industries Inc
Containers/Packaging
|
$21.87
|
-3.97
-15.36% |
$24.31
|
622,370
396.41% of 50 DAV
50 DAV is 157,000
|
$26.49
-17.44%
|
12/8/2022
|
$23.94
|
PP = $25.65
|
|
MB = $26.93
|
Most Recent Note - 3/1/2023 1:32:47 PM
G - Reported Dec '22 quarterly earnings +39% on +7% sales revenues versus the year ago period. Volume and volatility often increase near earnings news. Gapped down today abruptly retreating after 4 consecutive gains reaching new 52-week and all-time highs. Color code is changed to green after it violated its 50 DMA line ($23.65) triggering a technical sell signal and undercut its 200 DMA line ($21.87).
>>> FEATURED STOCK ARTICLE : Perched Near High After Finding Support at 50 DMA - 2/3/2023 |
View all notes |
Set NEW NOTE alert |
Company Profile |
SEC
News |
Chart |
Request a new note
C
A
S
I |
Symbol/Exchange
Company Name
Industry Group |
PRICE |
CHANGE
(%Change) |
Day High |
Volume
(% DAV)
(% 50 day avg vol) |
52 Wk Hi
% From Hi |
Featured
Date |
Price
Featured |
Pivot Featured |
|
Max Buy |
BOX
-
NYSE
Box Inc Cl A
Computer Sftwr-Database
|
$33.58
|
+0.23
0.69% |
$34.16
|
1,891,996
144.10% of 50 DAV
50 DAV is 1,313,000
|
$34.98
-4.00%
|
2/2/2023
|
$34.68
|
PP = $33.14
|
|
MB = $34.80
|
Most Recent Note - 2/28/2023 2:54:50 PM
Y - Volume totals have been cooling while consolidating. Prior highs and its 50 DMA line coincide in the $32 area defining important near term support to watch on pullbacks.
>>> FEATURED STOCK ARTICLE : Perched Near High After Recent Breakout - 2/7/2023 |
View all notes |
Set NEW NOTE alert |
Company Profile |
SEC
News |
Chart |
Request a new note
C
A
S
I |
STRL
-
NASDAQ
Sterling Infrastructure
MATERIALS and; CONSTRUCTION - Heavy Construction
|
$39.90
|
+1.44
3.74% |
$40.47
|
360,084
135.37% of 50 DAV
50 DAV is 266,000
|
$40.56
-1.63%
|
12/14/2022
|
$32.41
|
PP = $33.72
|
|
MB = $35.41
|
Most Recent Note - 3/1/2023 1:34:47 PM
G - Perched at its all-time high today while on track for a 6th consecutive gain, extended from the previously noted base. Prior highs in the $34-33 area and its 50 DMA line ($34.54) define important near-term support to watch.
>>> FEATURED STOCK ARTICLE : Sterling Perched Near High, Extended From Prior Base - 2/24/2023 |
View all notes |
Set NEW NOTE alert |
Company Profile |
SEC
News |
Chart |
Request a new note
C
A
S
I |
PERI
-
NASDAQ
Perion Networks Ltd
Comml Svcs-Advertising
|
$33.78
|
+0.04
0.12% |
$34.28
|
457,292
68.15% of 50 DAV
50 DAV is 671,000
|
$35.16
-3.92%
|
1/25/2023
|
$31.79
|
PP = $33.19
|
|
MB = $34.85
|
Most Recent Note - 2/27/2023 12:58:27 PM
Y - Still hovering near its 52-week high, stubbornly holding ground. Showed resilience after undercutting its pivot point. Important suppport to watch is its 50 DMA line ($29.99) and recent low ($29.83 on 2/08/23).
>>> FEATURED STOCK ARTICLE : Perion Stubbornly Holding Ground Near High After Spurt of Gains - 2/22/2023 |
View all notes |
Set NEW NOTE alert |
Company Profile |
SEC
News |
Chart |
Request a new note
C
A
S
I |
ALGM
-
NASDAQ
Allegro Microsystems Inc
Elec-Semiconductor Mfg
|
$43.77
|
+0.09
0.21% |
$44.78
|
1,043,716
63.72% of 50 DAV
50 DAV is 1,638,000
|
$45.99
-4.83%
|
1/31/2023
|
$37.80
|
PP = $38.38
|
|
MB = $40.30
|
Most Recent Note - 3/1/2023 4:45:45 PM
G - Stubbornly holding its ground with volume totals cooling after getting extended from the previously noted base. Prior high in the $38 area defines initial support to watch on pullbacks. See the latest FSU analysis for more details and a new annotated graph.
>>> FEATURED STOCK ARTICLE : Holding its Ground After Rallying From Previously Noted Base - 3/1/2023 |
View all notes |
Set NEW NOTE alert |
Company Profile |
SEC
News |
Chart |
Request a new note
C
A
S
I |
WCC
-
NYSE
Wesco International Inc
WHOLESALE - Electronics Wholesale
|
$168.55
|
+2.97
1.79% |
$169.64
|
378,637
82.67% of 50 DAV
50 DAV is 458,000
|
$172.91
-2.52%
|
2/10/2023
|
$148.50
|
PP = $147.15
|
|
MB = $154.51
|
Most Recent Note - 2/28/2023 3:06:53 PM
G - Extended from the previoulsy noted base. Prior highs in the $144-147 area define initial support to watch above its 50 DMA line ($142). Reported Dec '22 quarterly earnings +40% on +15% sales revenues versus the year ago period.
>>> FEATURED STOCK ARTICLE : Powered Higher After Recently Highlighted in Feb 10th Report - 2/21/2023 |
View all notes |
Set NEW NOTE alert |
Company Profile |
SEC
News |
Chart |
Request a new note
C
A
S
I |
Symbol/Exchange
Company Name
Industry Group |
PRICE |
CHANGE
(%Change) |
Day High |
Volume
(% DAV)
(% 50 day avg vol) |
52 Wk Hi
% From Hi |
Featured
Date |
Price
Featured |
Pivot Featured |
|
Max Buy |
FIX
-
NYSE
Comfort Systems U S A
MATERIALS and CONSTRUCTION - General Contractors
|
$146.94
|
+1.50
1.03% |
$147.64
|
284,143
131.55% of 50 DAV
50 DAV is 216,000
|
$148.89
-1.31%
|
2/23/2023
|
$136.52
|
PP = $128.78
|
|
MB = $135.22
|
Most Recent Note - 2/27/2023 6:22:01 PM
G - Hit another new high with today's 4th consecutive volume-driven gain, getting more extended from the previously noted base. Prior highs in the $128 area define initial support to watch on pullbacks.
>>> FEATURED STOCK ARTICLE : Powerful Technical Breakout After Earnings Report - 2/23/2023 |
View all notes |
Set NEW NOTE alert |
Company Profile |
SEC
News |
Chart |
Request a new note
C
A
S
I |
|
|
|
THESE ARE NOT BUY RECOMMENDATIONS!
Comments contained in the body of this report are technical
opinions only. The material herein has been obtained
from sources believed to be reliable and accurate, however,
its accuracy and completeness cannot be guaranteed.
This site is not an investment advisor, hence it does
not endorse or recommend any securities or other investments.
Any recommendation contained in this report may not
be suitable for all investors and it is not to be deemed
an offer or solicitation on our part with respect to
the purchase or sale of any securities. All trademarks,
service marks and trade names appearing in this report
are the property of their respective owners, and are
likewise used for identification purposes only.
This report is a service available
only to active Paid Premium Members.
You may opt-out of receiving report notifications
at any time. Questions or comments may be submitted
by writing to Premium Membership Services 665 S.E. 10 Street, Suite 201 Deerfield Beach, FL 33441-5634 or by calling 1-800-965-8307
or 954-785-1121.
|
|
|