You are not logged in.
This means you
CAN ONLY VIEW reports that were published prior to Thursday, April 10, 2025.
You
MUST UPGRADE YOUR MEMBERSHIP if you want to see any current reports.
AFTER MARKET UPDATE - THURSDAY, MARCH 2ND, 2023
Previous After Market Report Next After Market Report >>>
|
|
|
|
DOW |
+341.73 |
33,003.57 |
+1.05% |
|
Volume |
924,351,096 |
-4% |
|
Volume |
5,380,188,300 |
+10% |
|
NASDAQ |
+83.50 |
11,462.98 |
+0.73% |
|
Advancers |
1,613 |
54% |
|
Advancers |
2,359 |
53% |
|
S&P 500 |
+29.96 |
3,981.35 |
+0.76% |
|
Decliners |
1,363 |
46% |
|
Decliners |
2,121 |
47% |
|
Russell 2000 |
+4.23 |
1,902.66 |
+0.22% |
|
52 Wk Highs |
83 |
|
|
52 Wk Highs |
95 |
|
|
S&P 600 |
+3.55 |
1,255.40 |
+0.28% |
|
52 Wk Lows |
51 |
|
|
52 Wk Lows |
163 |
|
|
 |
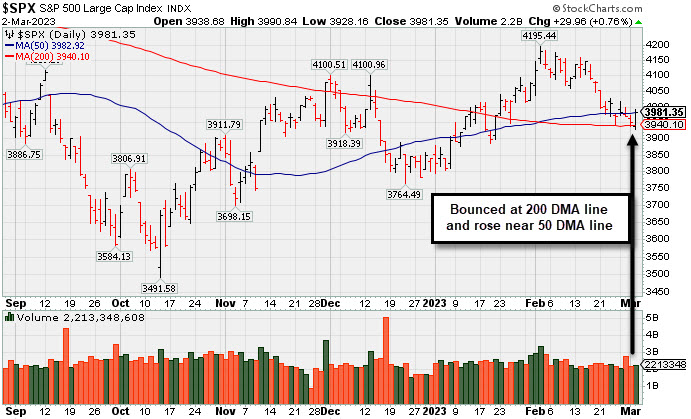
Market Internals Mixed as Major Indices Post Gains
Kenneth J. Gruneisen - Passed the CAN SLIM® Master's Exam
The Dow added 341 points, while the Nasdaq Composite increased 0.7%. The S&P 500 gained 0.8%. Volume totals were mixed, lighter than the prior session on the NYSE and higher on the Nasdaq exchange. Breadth was slightly positive as advancers led decliners by an 8-7 margin on the NYSE and on the Nasdaq exchange. There were 29 high-ranked companies from the Leaders List that hit new 52-week highs and were listed on the BreakOuts Page, versus 36 on the prior session. New 52-week highs outnumbered new 52-week lows on the NYSE but new lows outnumbered new highs on the Nasdaq exchange. The major indices are in an uptrend under pressure (M criteria). For any rally to be sustained there must be healthy leadership. It will be important to watch for further improvement in the new highs totals in the immediate days ahead. Stay tuned!
PICTURED: The Dow Jones Industrial Average is quietly consolidating just above its 200-day moving average (DMA) line.
U.S. equities reversed yesterday’s loss to close higher as nine of the eleven sectors finished in positive territory. Utilities paced gains Thursday as investors tried to shake off the hawkish rhetoric and look to the future state of the economy. During Atlanta Federal Reserve (Fed) President Raphael Bostic’s meeting he announced he believes the slow and steady mindset is the appropriate course of action for the central bank and is sticking with the quarter point rate hike at the March 22 meeting.
On the data front, initial jobless claims for the week ended February 24 slightly declined to 190,000 from last week’s 192,000 print, remaining below the 200,000 level for the seventh consecutive week as the labor market continues to remain resilient. In corporate news, Salesforce Inc. (CRM +11.50%) reported their fourth quarter earnings and revenue topped estimates along with a better-than-expected 2023 forecast. The company noted it will continue its share buyback program from last year. Macy’s Inc. (M +11.11%) announced it topped earnings estimates and met Wall Street’s revenue estimates.
Treasuries weakened, with the yield on the benchmark 10-year note increasing seven basis points (0.07%) to 4.06% while the 30-year bond yield gained five basis points (0.05%) to 4.00%. The yield on the two-year note, which is more sensitive to changes in Fed policy, remained unchanged 4.88%. In commodities, West Texas Intermediate (WTI) crude increased 0.3% to $77.95/barrel amid a strong economic rebound in China after their manufacturing activity data reported its fastest growth in more than a decade. |
 Kenneth J. Gruneisen started out as a licensed stockbroker in August 1987, a couple of months prior to the historic stock market crash that took the Dow Jones Industrial Average down -22.6% in a single day. He has published daily fact-based fundamental and technical analysis on high-ranked stocks online for two decades. Through FACTBASEDINVESTING.COM, Kenneth provides educational articles, news, market commentary, and other information regarding proven investment systems that work in good times and bad.
Comments contained in the body of this report are technical opinions only and are not necessarily those of Gruneisen Growth Corp. The material herein has been obtained from sources believed to be reliable and accurate, however, its accuracy and completeness cannot be guaranteed. Our firm, employees, and customers may effect transactions, including transactions contrary to any recommendation herein, or have positions in the securities mentioned herein or options with respect thereto. Any recommendation contained in this report may not be suitable for all investors and it is not to be deemed an offer or solicitation on our part with respect to the purchase or sale of any securities. |
|
 |
Energy and Tech Groups Led Gainers as Financials Fell
Kenneth J. Gruneisen - Passed the CAN SLIM® Master's Exam
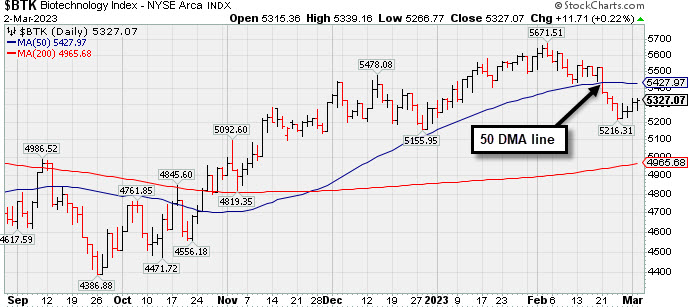
The Retail Index ($RLX +0.35%) edged higher but losses from the Bank Index ($BKX -1.78%) and Broker/Dealer Index ($XBD -0.45%) created a drag that limited the major indices' ability to rally. Energy-liniked groups had a positive bias as the Oil Services Index ($OSX +2.14%) outpaced the Integrated Oil Index ($XOI +0.83%). The Gold & Silver Index ($XAU +0.01%) was unchanged. The tech sector had a slightly positive bias as the Semiconductor Index ($SOX +0.96%) and Networking Index ($NWX +0.84%) both outpaced the Biotech Index ($BTK +0.22%).
PICTURED: The Biotech Index ($BTK +0.22%) recently slumped below its 50-day moving average (DMA) line.
| Oil Services |
$OSX |
91.13 |
+1.91 |
+2.14% |
+8.67% |
| Integrated Oil |
$XOI |
1,799.84 |
+14.81 |
+0.83% |
+0.70% |
| Semiconductor |
$SOX |
2,984.11 |
+28.28 |
+0.96% |
+17.85% |
| Networking |
$NWX |
814.61 |
+6.76 |
+0.84% |
+4.00% |
| Broker/Dealer |
$XBD |
489.96 |
-2.21 |
-0.45% |
+9.09% |
| Retail |
$RLX |
2,834.64 |
+9.99 |
+0.35% |
+2.93% |
| Gold & Silver |
$XAU |
116.95 |
+0.02 |
+0.01% |
-3.23% |
| Bank |
$BKX |
107.38 |
-1.95 |
-1.78% |
+6.48% |
| Biotech |
$BTK |
5,327.07 |
+11.71 |
+0.22% |
+0.87% |
|
|
|
 |
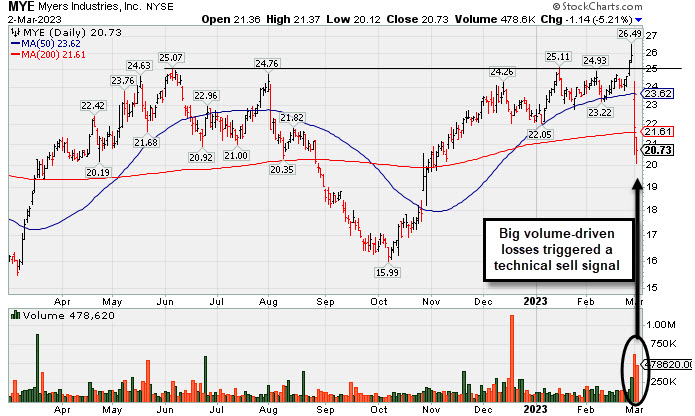
Damaging Losses Triggered Technical Sell Signals
Kenneth J. Gruneisen - Passed the CAN SLIM® Master's Exam
Myers Industries Inc (MYE -$1.14 or -5.21% to $20.73) suffered a 2nd consecutive volume-driven loss. earish action came after it reported Dec '22 quarterly earnings +39% on +7% sales revenues versus the year ago period. Volume and volatility often increase near earnings news. It violated its 50 DMA line ($23.62) triggering a technical sell signal and undercut its 200 DMA line ($21.87) as it gapped down on Wednesday, abruptly retreating after 4 consecutive gains reaching new 52-week and all-time highs. A prompt rebound above the 50 DMA line is needed for its outlook to improve.
MYE was highlighted in yellow in the 12/08/22 mid-day report (read here). It was last covered in greater detail in the FSU section on 2/03/23 with an annotated graph under the headline, "Perched Near High After Finding Support at 50 DMA". It has a 96 Earnings Per Share Rating. The Sep '22 quarter showed +78% earnings on +14% sales revenues versus the year ago period. The past 4 quarterly comparisons were above the +25% minimum guideline (C criteria), however, its sales revenues growth rate has shown deceleration in sequential comparisons +45%, +29%, +24%, to +14%. Annual earnings (A criteria) history had a slight downturn in FY '19 but growth has been otherwise strong and steady.
It hails from the Containers/Packaging industry group which is now ranked 85th on the 197 Industry Groups list (L criteria). There are only 36.5 million shares outstanding (S criteria) which can contribute to greater price volatility in the event of institutional buying or selling. The number of top-rated funds owning its shares was 336 in Mar '22 and was reported at 346 as of Dec '22. Its current Up/Down Volume Ratio of 1.1 is an unbiased indication its shares have been nearly neutral concerning accumulation/distribution over the past 50 days (I criteria). |
|
|
Color Codes Explained :
Y - Better candidates highlighted by our
staff of experts.
G - Previously featured
in past reports as yellow but may no longer be buyable under the
guidelines.
***Last / Change / Volume data in this table is the closing quote data***
Symbol/Exchange
Company Name
Industry Group |
PRICE |
CHANGE
(%Change) |
Day High |
Volume
(% DAV)
(% 50 day avg vol) |
52 Wk Hi
% From Hi |
Featured
Date |
Price
Featured |
Pivot Featured |
|
Max Buy |
 CMC
-
NYSE
CMC
-
NYSE
Commercial Metals Co
METALS and MINING - Steel and Iron
|
$52.56
|
+0.72
1.39% |
$53.05
|
1,336,808
119.15% of 50 DAV
50 DAV is 1,122,000
|
$58.09
-9.52%
|
10/14/2022
|
$41.61
|
PP = $44.45
|
|
MB = $46.67
|
Most Recent Note - 2/28/2023 2:58:52 PM
G - Consolidating just below its 50 DMA line ($52.84) with volume totals cooling after a damaging loss noted on 2/23/23. The recent low ($50.90 on 2/24/23) defines important near term support where any more damaging losses would raise greater concerns. Fundamentals remain strong.
>>> FEATURED STOCK ARTICLE : Metals Firm Extended From Base and Perched Near High - 2/6/2023 |
View all notes |
Set NEW NOTE alert |
Company Profile |
SEC
News |
Chart |
Request a new note
C
A
S
I |
GPK
-
NYSE
Graphic Packaging Hldg
CONSUMER NON-DURABLES - Packaging and Containers
|
$24.43
|
+0.05
0.21% |
$24.47
|
2,940,843
90.71% of 50 DAV
50 DAV is 3,242,000
|
$24.46
-0.12%
|
10/25/2022
|
$22.75
|
PP = $24.17
|
|
MB = $25.38
|
Most Recent Note - 3/1/2023 1:36:48 PM
Y - Inching higher today for a 5th consecutive small gain, wedging into new all-time high territory with gains lacking great volume conviction. Showed resilience after briefly violating its 50 DMA line on 2/07/23. Members were reminded - "Disciplined investors know that gains above a stock's pivot point must be backed by at least +40% above average volume to trigger a proper technical buy signal."
>>> FEATURED STOCK ARTICLE : Quietly Lingering Near High With Strong Fundamentals - 2/27/2023 |
View all notes |
Set NEW NOTE alert |
Company Profile |
SEC
News |
Chart |
Request a new note
C
A
S
I |
GFF
-
NYSE
Griffon Corporation
MATERIALS and CONSTRUCTION - General Building Materials
|
$37.61
|
+1.34
3.69% |
$37.87
|
473,017
90.79% of 50 DAV
50 DAV is 521,000
|
$43.74
-14.01%
|
11/10/2022
|
$34.13
|
PP = $35.02
|
|
MB = $36.77
|
Most Recent Note - 2/28/2023 3:02:58 PM
G - A rebound above the 50 DMA line is needed for its outlook to improve. Violated its 50 DMA line ($38.09) with a damaging volume-driven loss triggering a technical sell signal when last noted on 2/21/23 and it has failed to rebound above that important short-term average. More damaging losses would raise greater concerns. Reported Dec '22 quarterly earnings +121 on +10% sales revenues versus the year ago period.
>>> FEATURED STOCK ARTICLE : Extended From Any Sound Base and Still Hitting New Highs - 2/2/2023 |
View all notes |
Set NEW NOTE alert |
Company Profile |
SEC
News |
Chart |
Request a new note
C
A
S
I |
TITN
-
NASDAQ
Titan Machinery Inc
SPECIALTY RETAIL
|
$46.49
|
+0.52
1.13% |
$46.71
|
184,059
84.82% of 50 DAV
50 DAV is 217,000
|
$47.79
-2.72%
|
1/13/2023
|
$40.10
|
PP = $44.45
|
|
MB = $46.67
|
Most Recent Note - 2/28/2023 6:22:50 PM
Y - Color code is changed to yellow after it pulled back today below its "max buy" level with above average volume after hitting a new all-time high with a volume-driven gain on the prior session. Its 50 DMA line ($42.16) definies important near-term support to watch on pullbacks. See the latest FSU analysis for more details and a new annotated graph.
>>> FEATURED STOCK ARTICLE : Pulled Back from New All-Time High - 2/28/2023 |
View all notes |
Set NEW NOTE alert |
Company Profile |
SEC
News |
Chart |
Request a new note
C
A
S
I |
MYE
-
NYSE
Myers Industries Inc
Containers/Packaging
|
$20.73
|
-1.14
-5.21% |
$21.37
|
478,623
292.74% of 50 DAV
50 DAV is 163,500
|
$26.49
-21.74%
|
12/8/2022
|
$23.94
|
PP = $25.65
|
|
MB = $26.93
|
 Most Recent Note - 3/2/2023 6:48:40 PM
G - Suffered a 2nd consecutive damaging volume-driven loss triggering technical sell signals. Bearish action came after it reported Dec '22 quarterly earnings +39% on +7% sales revenues versus the year ago period. Volume and volatility often increase near earnings news. Abruptly retreating after 4 consecutive gains reaching new 52-week and all-time highs. See the latest FSU analysis for more details and a new annotated graph.
>>> FEATURED STOCK ARTICLE : Damaging Losses Triggered Technical Sell Signals - 3/2/2023 |
View all notes |
Set NEW NOTE alert |
Company Profile |
SEC
News |
Chart |
Request a new note
C
A
S
I |
Symbol/Exchange
Company Name
Industry Group |
PRICE |
CHANGE
(%Change) |
Day High |
Volume
(% DAV)
(% 50 day avg vol) |
52 Wk Hi
% From Hi |
Featured
Date |
Price
Featured |
Pivot Featured |
|
Max Buy |
BOX
-
NYSE
Box Inc Cl A
Computer Sftwr-Database
|
$29.24
|
-4.34
-12.92% |
$29.75
|
6,977,320
533.84% of 50 DAV
50 DAV is 1,307,000
|
$34.98
-16.41%
|
2/2/2023
|
$34.68
|
PP = $33.14
|
|
MB = $34.80
|
Most Recent Note - 3/2/2023 6:51:54 PM
G - Gapped down today violating its 50 DMA line and undercutting prior highs in the $32 area triggering a technical sell signal and its color code is changed to green. Weak action came after it reported Dec '22 quarterly earnings +54% on +10% sales revenues versus the year ago period. Volume and volatility often increase near earnings news.
>>> FEATURED STOCK ARTICLE : Perched Near High After Recent Breakout - 2/7/2023 |
View all notes |
Set NEW NOTE alert |
Company Profile |
SEC
News |
Chart |
Request a new note
C
A
S
I |
STRL
-
NASDAQ
Sterling Infrastructure
MATERIALS and; CONSTRUCTION - Heavy Construction
|
$40.87
|
+0.97
2.43% |
$41.31
|
357,554
132.92% of 50 DAV
50 DAV is 269,000
|
$40.56
0.76%
|
12/14/2022
|
$32.41
|
PP = $33.72
|
|
MB = $35.41
|
Most Recent Note - 3/1/2023 1:34:47 PM
G - Perched at its all-time high today while on track for a 6th consecutive gain, extended from the previously noted base. Prior highs in the $34-33 area and its 50 DMA line ($34.54) define important near-term support to watch.
>>> FEATURED STOCK ARTICLE : Sterling Perched Near High, Extended From Prior Base - 2/24/2023 |
View all notes |
Set NEW NOTE alert |
Company Profile |
SEC
News |
Chart |
Request a new note
C
A
S
I |
PERI
-
NASDAQ
Perion Networks Ltd
Comml Svcs-Advertising
|
$34.28
|
+0.50
1.48% |
$34.30
|
603,829
89.46% of 50 DAV
50 DAV is 675,000
|
$35.16
-2.50%
|
1/25/2023
|
$31.79
|
PP = $33.19
|
|
MB = $34.85
|
Most Recent Note - 2/27/2023 12:58:27 PM
Y - Still hovering near its 52-week high, stubbornly holding ground. Showed resilience after undercutting its pivot point. Important suppport to watch is its 50 DMA line ($29.99) and recent low ($29.83 on 2/08/23).
>>> FEATURED STOCK ARTICLE : Perion Stubbornly Holding Ground Near High After Spurt of Gains - 2/22/2023 |
View all notes |
Set NEW NOTE alert |
Company Profile |
SEC
News |
Chart |
Request a new note
C
A
S
I |
ALGM
-
NASDAQ
Allegro Microsystems Inc
Elec-Semiconductor Mfg
|
$44.18
|
+0.41
0.94% |
$44.49
|
1,212,691
74.95% of 50 DAV
50 DAV is 1,618,000
|
$45.99
-3.94%
|
1/31/2023
|
$37.80
|
PP = $38.38
|
|
MB = $40.30
|
Most Recent Note - 3/1/2023 4:45:45 PM
G - Stubbornly holding its ground with volume totals cooling after getting extended from the previously noted base. Prior high in the $38 area defines initial support to watch on pullbacks. See the latest FSU analysis for more details and a new annotated graph.
>>> FEATURED STOCK ARTICLE : Holding its Ground After Rallying From Previously Noted Base - 3/1/2023 |
View all notes |
Set NEW NOTE alert |
Company Profile |
SEC
News |
Chart |
Request a new note
C
A
S
I |
WCC
-
NYSE
Wesco International Inc
WHOLESALE - Electronics Wholesale
|
$170.12
|
+1.57
0.93% |
$170.38
|
426,031
93.02% of 50 DAV
50 DAV is 458,000
|
$172.91
-1.61%
|
2/10/2023
|
$148.50
|
PP = $147.15
|
|
MB = $154.51
|
Most Recent Note - 2/28/2023 3:06:53 PM
G - Extended from the previoulsy noted base. Prior highs in the $144-147 area define initial support to watch above its 50 DMA line ($142). Reported Dec '22 quarterly earnings +40% on +15% sales revenues versus the year ago period.
>>> FEATURED STOCK ARTICLE : Powered Higher After Recently Highlighted in Feb 10th Report - 2/21/2023 |
View all notes |
Set NEW NOTE alert |
Company Profile |
SEC
News |
Chart |
Request a new note
C
A
S
I |
Symbol/Exchange
Company Name
Industry Group |
PRICE |
CHANGE
(%Change) |
Day High |
Volume
(% DAV)
(% 50 day avg vol) |
52 Wk Hi
% From Hi |
Featured
Date |
Price
Featured |
Pivot Featured |
|
Max Buy |
FIX
-
NYSE
Comfort Systems U S A
MATERIALS and CONSTRUCTION - General Contractors
|
$147.20
|
+0.26
0.18% |
$148.32
|
243,001
110.96% of 50 DAV
50 DAV is 219,000
|
$148.89
-1.14%
|
2/23/2023
|
$136.52
|
PP = $128.78
|
|
MB = $135.22
|
Most Recent Note - 2/27/2023 6:22:01 PM
G - Hit another new high with today's 4th consecutive volume-driven gain, getting more extended from the previously noted base. Prior highs in the $128 area define initial support to watch on pullbacks.
>>> FEATURED STOCK ARTICLE : Powerful Technical Breakout After Earnings Report - 2/23/2023 |
View all notes |
Set NEW NOTE alert |
Company Profile |
SEC
News |
Chart |
Request a new note
C
A
S
I |
|
|
|
THESE ARE NOT BUY RECOMMENDATIONS!
Comments contained in the body of this report are technical
opinions only. The material herein has been obtained
from sources believed to be reliable and accurate, however,
its accuracy and completeness cannot be guaranteed.
This site is not an investment advisor, hence it does
not endorse or recommend any securities or other investments.
Any recommendation contained in this report may not
be suitable for all investors and it is not to be deemed
an offer or solicitation on our part with respect to
the purchase or sale of any securities. All trademarks,
service marks and trade names appearing in this report
are the property of their respective owners, and are
likewise used for identification purposes only.
This report is a service available
only to active Paid Premium Members.
You may opt-out of receiving report notifications
at any time. Questions or comments may be submitted
by writing to Premium Membership Services 665 S.E. 10 Street, Suite 201 Deerfield Beach, FL 33441-5634 or by calling 1-800-965-8307
or 954-785-1121.
|
|
|