You are not logged in.
This means you
CAN ONLY VIEW reports that were published prior to Monday, April 21, 2025.
You
MUST UPGRADE YOUR MEMBERSHIP if you want to see any current reports.
AFTER MARKET UPDATE - TUESDAY, FEBRUARY 28TH, 2023
Previous After Market Report Next After Market Report >>>
|
|
|
|
DOW |
-232.39 |
32,656.70 |
-0.71% |
|
Volume |
1,496,164,200 |
+79% |
|
Volume |
5,267,888,600 |
+17% |
|
NASDAQ |
-11.44 |
11,455.54 |
-0.10% |
|
Advancers |
1,399 |
48% |
|
Advancers |
2,207 |
50% |
|
S&P 500 |
-12.09 |
3,970.15 |
-0.30% |
|
Decliners |
1,540 |
52% |
|
Decliners |
2,237 |
50% |
|
Russell 2000 |
+0.72 |
1,896.99 |
+0.04% |
|
52 Wk Highs |
80 |
|
|
52 Wk Highs |
104 |
|
|
S&P 600 |
-0.93 |
1,249.23 |
-0.07% |
|
52 Wk Lows |
36 |
|
|
52 Wk Lows |
103 |
|
|
 |
Major Indices Ended February in an Uptrend Under Pressure
Kenneth J. Gruneisen - Passed the CAN SLIM® Master's Exam
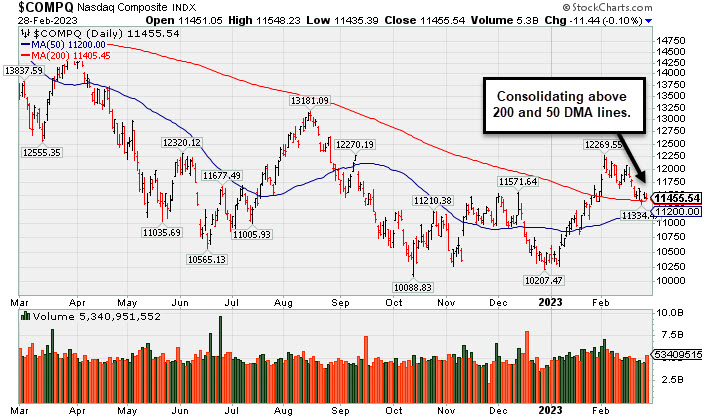
The Dow lost 232 points, while the Nasdaq Composite declined 0.1%. The S&P 500 decreased 0.3% with eight of 11 sectors finishing in negative territory with Utilities leading laggards. All three major averages notched a monthly decline, decreasing 4.2%, 1.1% and 2.6% respectively. Volume totals were higher than the prior session on the NYSE and on the Nasdaq exchange, indicative of distributional pressure or institutional selling. Breadth was nearly even but decliners narrowly edged out advancers on the NYSE and on the Nasdaq exchange. Leadership improved as there were 31 high-ranked companies from the Leaders List that hit new 52-week highs and were listed on the BreakOuts Page, versus 26 on the prior session. New 52-week highs outnumbered new 52-week lows on the NYSE and on the Nasdaq exchange. The major indices are in an uptrend under pressure (M criteria). For any rally to be sustained there must be healthy leadership. It will be important to watch for further improvement in the new highs totals in the immediate days ahead. Stay tuned!
PICTURED: The Nasdaq Composite Index is consolidating just above its 200-day moving average (DMA) line and above its 50 DMA line.
U.S. equities finished lower Tuesday and marked a monthly decline for February following January’s rally to start the 2023 year off strong. On the data front, February’s Conference Board Consumer Confidence Index unexpectedly eased as consumers grew more pessimistic this month as the long-term economic outlook continues to look gloomy. Meanwhile, December’s S&P CoreLogic Case-Shiller National Home Price Index dipped to a 5.76% year-over-year growth, down from a downwardly revised 7.62% annual rate in November. Today’s reading follows the deceleration in the housing market after a surge in mortgage rates priced many new home buyers out of the market in 2022. Wrapping up today’s docket, the Federal Housing Finance Agency’s (FHFA) December reading remained unchanged at a 0.1% monthly decline.
Treasuries were mixed, with the yield on the benchmark 10-year note remaining unchanged at 3.92% after touching 3.983% during intraday trading, its highest level since November. The 30-year bond yield declined one basis point (0.01%) to 3.92%. The yield on the two-year note, which is more sensitive to changes in Federal Reserve policy, gained two basis points (0.02%) to 4.80%. In commodities, West Texas Intermediate (WTI) crude increased 1.6% to $76.92/barrel amid a strong economic rebound in China driving commodity demands higher. WTI finished with a monthly decline of 2.5%. In the metals complex, gold and silver plummeted 4.9% and 11.9%, notching their worst month in more than a year.
|
 Kenneth J. Gruneisen started out as a licensed stockbroker in August 1987, a couple of months prior to the historic stock market crash that took the Dow Jones Industrial Average down -22.6% in a single day. He has published daily fact-based fundamental and technical analysis on high-ranked stocks online for two decades. Through FACTBASEDINVESTING.COM, Kenneth provides educational articles, news, market commentary, and other information regarding proven investment systems that work in good times and bad.
Comments contained in the body of this report are technical opinions only and are not necessarily those of Gruneisen Growth Corp. The material herein has been obtained from sources believed to be reliable and accurate, however, its accuracy and completeness cannot be guaranteed. Our firm, employees, and customers may effect transactions, including transactions contrary to any recommendation herein, or have positions in the securities mentioned herein or options with respect thereto. Any recommendation contained in this report may not be suitable for all investors and it is not to be deemed an offer or solicitation on our part with respect to the purchase or sale of any securities. |
|
 |
Slightly Positive Drift For All Groups But Energy-Linked
Kenneth J. Gruneisen - Passed the CAN SLIM® Master's Exam
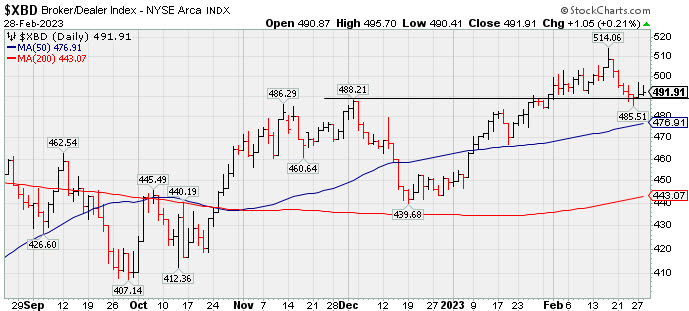
The Broker/Dealer Index ($XBD +0.21%), Bank Index ($BKX +0.30%), and Retail Index ($RLX +0.21%) each inched higher. The tech sector was quiet but also had a slightly positive drift as the Semiconductor Index ($SOX +0.24%), Networking Index ($NWX +0.20%), and Biotech Index ($BTK +0.05%) inched higher. Commodity-linked groups were mixed as the Gold & Silver Index ($XAU +0.87%) rose, meanwhile the Oil Services Index ($OSX -1.05%) and Integrated Oil Index ($XOI -1.81%) both lost ground.
PICTURED: The Broker/Dealer Index ($XBD +0.21%) recently pulled back from the February high. The late 2022 high defines initial support above its 50-day moving average (DMA) line.
| Oil Services |
$OSX |
87.12 |
-0.92 |
-1.05% |
+3.89% |
| Integrated Oil |
$XOI |
1,737.02 |
-32.10 |
-1.81% |
-2.81% |
| Semiconductor |
$SOX |
2,958.39 |
+7.18 |
+0.24% |
+16.83% |
| Networking |
$NWX |
812.03 |
+1.62 |
+0.20% |
+3.67% |
| Broker/Dealer |
$XBD |
491.91 |
+1.05 |
+0.21% |
+9.53% |
| Retail |
$RLX |
2,884.39 |
+5.95 |
+0.21% |
+4.73% |
| Gold & Silver |
$XAU |
113.72 |
+0.98 |
+0.87% |
-5.90% |
| Bank |
$BKX |
109.65 |
+0.33 |
+0.30% |
+8.25% |
| Biotech |
$BTK |
5,261.05 |
+2.38 |
+0.05% |
-0.38% |
|
|
|
 |
Pulled Back from New All-Time High
Kenneth J. Gruneisen - Passed the CAN SLIM® Master's Exam
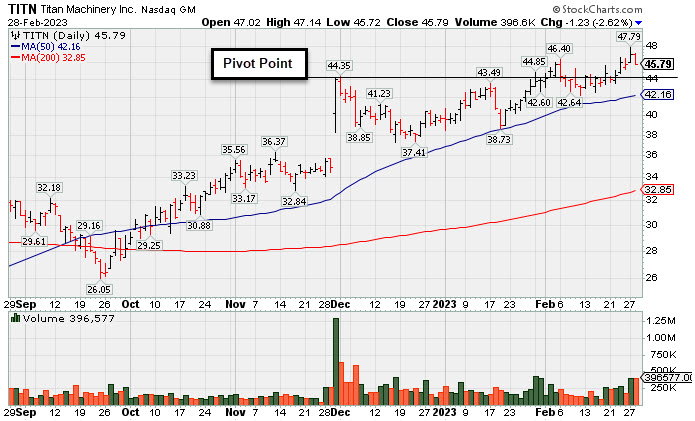
Titan Machinery Inc (TITN -$1.23 or -2.62% to $45.79) pulled back today with above average volume after hitting a new all-time high on the prior session with a big gain. Its color code was changed to yellow after pulling back below its "max buy" level. Its 50-day moving average (DMA) line ($42.16) definies important near-term support to watch on pullbacks.
Fundamentals remain strong after reporting Oct '22 quarterly earnings +91% on +47% sales revenues. It currently has the highest possible earnings Per Share Rating of 99. Following years of losses it has shown strong earnings growth for FY '19-22. TITN was highlighted in yellow with pivot point cited based on its 11/23/21 high plus 10 cents in the 11/30/22 mid-day report (read here). It was last shown in greater detail on 1/30/23 with an annotated graph under the headline, "7th Consecutive Gain for Titan".
The small supply of only 22.7 million shares outstanding (S criteria) can contribute to greater price volatility in the event of institutional buying or selling. The number of top-rated funds owning its shares rose from 241 in Dec '20 to 361 in Dec '22, a reassuring sign concerning the I criteria. Its current Up/Down Volume Ratio of 1.7 is an unbiased indication its shares have been under slight accumulation over the past 50 days. |
|
|
Color Codes Explained :
Y - Better candidates highlighted by our
staff of experts.
G - Previously featured
in past reports as yellow but may no longer be buyable under the
guidelines.
***Last / Change / Volume data in this table is the closing quote data***
Symbol/Exchange
Company Name
Industry Group |
PRICE |
CHANGE
(%Change) |
Day High |
Volume
(% DAV)
(% 50 day avg vol) |
52 Wk Hi
% From Hi |
Featured
Date |
Price
Featured |
Pivot Featured |
|
Max Buy |
 CMC
-
NYSE
CMC
-
NYSE
Commercial Metals Co
METALS and MINING - Steel and Iron
|
$51.75
|
-0.71
-1.35% |
$52.66
|
1,747,865
159.62% of 50 DAV
50 DAV is 1,095,000
|
$58.09
-10.91%
|
10/14/2022
|
$41.61
|
PP = $44.45
|
|
MB = $46.67
|
 Most Recent Note - 2/28/2023 2:58:52 PM
G - Consolidating just below its 50 DMA line ($52.84) with volume totals cooling after a damaging loss noted on 2/23/23. The recent low ($50.90 on 2/24/23) defines important near term support where any more damaging losses would raise greater concerns. Fundamentals remain strong.
>>> FEATURED STOCK ARTICLE : Metals Firm Extended From Base and Perched Near High - 2/6/2023 |
View all notes |
Set NEW NOTE alert |
Company Profile |
SEC
News |
Chart |
Request a new note
C
A
S
I |
GPK
-
NYSE
Graphic Packaging Hldg
CONSUMER NON-DURABLES - Packaging and Containers
|
$23.80
|
+0.00
0.00% |
$24.12
|
2,892,219
90.16% of 50 DAV
50 DAV is 3,208,000
|
$24.20
-1.65%
|
10/25/2022
|
$22.75
|
PP = $24.17
|
|
MB = $25.38
|
Most Recent Note - 2/27/2023 6:16:57 PM
Y - Posted a 3rd consecutive small gain with below average volume and closed only -1.7% off its all-time high. Showed resilience after briefly violating its 50 DMA line on 2/07/23. See the latest FSU analysis for more details and a new annotated graph. Members were reminded - "Disciplined investors know that gains above a stock's pivot point must be backed by at least +40% above average volume to trigger a proper technical buy signal."
>>> FEATURED STOCK ARTICLE : Quietly Lingering Near High With Strong Fundamentals - 2/27/2023 |
View all notes |
Set NEW NOTE alert |
Company Profile |
SEC
News |
Chart |
Request a new note
C
A
S
I |
GFF
-
NYSE
Griffon Corporation
MATERIALS and CONSTRUCTION - General Building Materials
|
$36.47
|
-0.43
-1.17% |
$37.22
|
437,281
85.07% of 50 DAV
50 DAV is 514,000
|
$43.74
-16.62%
|
11/10/2022
|
$34.13
|
PP = $35.02
|
|
MB = $36.77
|
Most Recent Note - 2/28/2023 3:02:58 PM
G - A rebound above the 50 DMA line is needed for its outlook to improve. Violated its 50 DMA line ($38.09) with a damaging volume-driven loss triggering a technical sell signal when last noted on 2/21/23 and it has failed to rebound above that important short-term average. More damaging losses would raise greater concerns. Reported Dec '22 quarterly earnings +121 on +10% sales revenues versus the year ago period.
>>> FEATURED STOCK ARTICLE : Extended From Any Sound Base and Still Hitting New Highs - 2/2/2023 |
View all notes |
Set NEW NOTE alert |
Company Profile |
SEC
News |
Chart |
Request a new note
C
A
S
I |
TITN
-
NASDAQ
Titan Machinery Inc
SPECIALTY RETAIL
|
$45.79
|
-1.23
-2.62% |
$47.14
|
396,577
183.60% of 50 DAV
50 DAV is 216,000
|
$47.79
-4.18%
|
1/13/2023
|
$40.10
|
PP = $44.45
|
|
MB = $46.67
|
Most Recent Note - 2/28/2023 6:22:50 PM
Y - Color code is changed to yellow after it pulled back today below its "max buy" level with above average volume after hitting a new all-time high with a volume-driven gain on the prior session. Its 50 DMA line ($42.16) definies important near-term support to watch on pullbacks. See the latest FSU analysis for more details and a new annotated graph.
>>> FEATURED STOCK ARTICLE : Pulled Back from New All-Time High - 2/28/2023 |
View all notes |
Set NEW NOTE alert |
Company Profile |
SEC
News |
Chart |
Request a new note
C
A
S
I |
MYE
-
NYSE
Myers Industries Inc
Containers/Packaging
|
$25.84
|
+0.40
1.57% |
$26.49
|
295,121
191.64% of 50 DAV
50 DAV is 154,000
|
$25.56
1.10%
|
12/8/2022
|
$23.94
|
PP = $25.65
|
|
MB = $26.93
|
Most Recent Note - 2/27/2023 6:19:19 PM
Y - Touched a new high today with a big gain backed by average volume and ended at a best-ever close. Found prompt support near its 50 DMA line ($23.62) on recent pullbacks. Faces no resistance due to overhead supply.
>>> FEATURED STOCK ARTICLE : Perched Near High After Finding Support at 50 DMA - 2/3/2023 |
View all notes |
Set NEW NOTE alert |
Company Profile |
SEC
News |
Chart |
Request a new note
C
A
S
I |
Symbol/Exchange
Company Name
Industry Group |
PRICE |
CHANGE
(%Change) |
Day High |
Volume
(% DAV)
(% 50 day avg vol) |
52 Wk Hi
% From Hi |
Featured
Date |
Price
Featured |
Pivot Featured |
|
Max Buy |
BOX
-
NYSE
Box Inc Cl A
Computer Sftwr-Database
|
$33.35
|
+0.00
0.00% |
$33.64
|
1,403,823
105.87% of 50 DAV
50 DAV is 1,326,000
|
$34.98
-4.66%
|
2/2/2023
|
$34.68
|
PP = $33.14
|
|
MB = $34.80
|
Most Recent Note - 2/28/2023 2:54:50 PM
Y - Volume totals have been cooling while consolidating. Prior highs and its 50 DMA line coincide in the $32 area defining important near term support to watch on pullbacks.
>>> FEATURED STOCK ARTICLE : Perched Near High After Recent Breakout - 2/7/2023 |
View all notes |
Set NEW NOTE alert |
Company Profile |
SEC
News |
Chart |
Request a new note
C
A
S
I |
STRL
-
NASDAQ
Sterling Infrastructure
MATERIALS and; CONSTRUCTION - Heavy Construction
|
$38.46
|
+0.12
0.31% |
$40.56
|
439,806
168.51% of 50 DAV
50 DAV is 261,000
|
$38.97
-1.31%
|
12/14/2022
|
$32.41
|
PP = $33.72
|
|
MB = $35.41
|
Most Recent Note - 2/24/2023 11:36:37 PM
G - Perched near its all-time high, extended from the previously noted base. Prior highs in the $34-33 area and its 50 DMA line ($34.10) define important near-term support to watch. See the latest FSU analysis for more details and a new annotated graph.
>>> FEATURED STOCK ARTICLE : Sterling Perched Near High, Extended From Prior Base - 2/24/2023 |
View all notes |
Set NEW NOTE alert |
Company Profile |
SEC
News |
Chart |
Request a new note
C
A
S
I |
PERI
-
NASDAQ
Perion Networks Ltd
Comml Svcs-Advertising
|
$33.74
|
-0.30
-0.88% |
$34.79
|
704,554
106.11% of 50 DAV
50 DAV is 664,000
|
$35.16
-4.04%
|
1/25/2023
|
$31.79
|
PP = $33.19
|
|
MB = $34.85
|
Most Recent Note - 2/27/2023 12:58:27 PM
Y - Still hovering near its 52-week high, stubbornly holding ground. Showed resilience after undercutting its pivot point. Important suppport to watch is its 50 DMA line ($29.99) and recent low ($29.83 on 2/08/23).
>>> FEATURED STOCK ARTICLE : Perion Stubbornly Holding Ground Near High After Spurt of Gains - 2/22/2023 |
View all notes |
Set NEW NOTE alert |
Company Profile |
SEC
News |
Chart |
Request a new note
C
A
S
I |
ALGM
-
NASDAQ
Allegro Microsystems Inc
Elec-Semiconductor Mfg
|
$43.68
|
+0.75
1.75% |
$44.61
|
1,353,776
82.45% of 50 DAV
50 DAV is 1,642,000
|
$45.99
-5.02%
|
1/31/2023
|
$37.80
|
PP = $38.38
|
|
MB = $40.30
|
Most Recent Note - 2/28/2023 2:53:03 PM
G - Consolidating with volume totals cooling after getting extended from the previously noted base. Prior high in the $38 area defines initial support to watch on pullbacks.
>>> FEATURED STOCK ARTICLE : Big Volume-Driven Gain for Best-Ever Close - 1/31/2023 |
View all notes |
Set NEW NOTE alert |
Company Profile |
SEC
News |
Chart |
Request a new note
C
A
S
I |
WCC
-
NYSE
Wesco International Inc
WHOLESALE - Electronics Wholesale
|
$165.58
|
-0.61
-0.37% |
$168.33
|
408,018
89.28% of 50 DAV
50 DAV is 457,000
|
$172.91
-4.24%
|
2/10/2023
|
$148.50
|
PP = $147.15
|
|
MB = $154.51
|
Most Recent Note - 2/28/2023 3:06:53 PM
G - Extended from the previoulsy noted base. Prior highs in the $144-147 area define initial support to watch above its 50 DMA line ($142). Reported Dec '22 quarterly earnings +40% on +15% sales revenues versus the year ago period.
>>> FEATURED STOCK ARTICLE : Powered Higher After Recently Highlighted in Feb 10th Report - 2/21/2023 |
View all notes |
Set NEW NOTE alert |
Company Profile |
SEC
News |
Chart |
Request a new note
C
A
S
I |
Symbol/Exchange
Company Name
Industry Group |
PRICE |
CHANGE
(%Change) |
Day High |
Volume
(% DAV)
(% 50 day avg vol) |
52 Wk Hi
% From Hi |
Featured
Date |
Price
Featured |
Pivot Featured |
|
Max Buy |
FIX
-
NYSE
Comfort Systems U S A
MATERIALS and CONSTRUCTION - General Contractors
|
$145.44
|
-1.46
-0.99% |
$148.89
|
367,786
173.48% of 50 DAV
50 DAV is 212,000
|
$148.86
-2.30%
|
2/23/2023
|
$136.52
|
PP = $128.78
|
|
MB = $135.22
|
Most Recent Note - 2/27/2023 6:22:01 PM
G - Hit another new high with today's 4th consecutive volume-driven gain, getting more extended from the previously noted base. Prior highs in the $128 area define initial support to watch on pullbacks.
>>> FEATURED STOCK ARTICLE : Powerful Technical Breakout After Earnings Report - 2/23/2023 |
View all notes |
Set NEW NOTE alert |
Company Profile |
SEC
News |
Chart |
Request a new note
C
A
S
I |
|
|
|
THESE ARE NOT BUY RECOMMENDATIONS!
Comments contained in the body of this report are technical
opinions only. The material herein has been obtained
from sources believed to be reliable and accurate, however,
its accuracy and completeness cannot be guaranteed.
This site is not an investment advisor, hence it does
not endorse or recommend any securities or other investments.
Any recommendation contained in this report may not
be suitable for all investors and it is not to be deemed
an offer or solicitation on our part with respect to
the purchase or sale of any securities. All trademarks,
service marks and trade names appearing in this report
are the property of their respective owners, and are
likewise used for identification purposes only.
This report is a service available
only to active Paid Premium Members.
You may opt-out of receiving report notifications
at any time. Questions or comments may be submitted
by writing to Premium Membership Services 665 S.E. 10 Street, Suite 201 Deerfield Beach, FL 33441-5634 or by calling 1-800-965-8307
or 954-785-1121.
|
|
|