You are not logged in.
This means you
CAN ONLY VIEW reports that were published prior to Wednesday, April 9, 2025.
You
MUST UPGRADE YOUR MEMBERSHIP if you want to see any current reports.
AFTER MARKET UPDATE - MONDAY, FEBRUARY 27TH, 2023
Previous After Market Report Next After Market Report >>>
|
|
|
|
DOW |
+72.17 |
32,889.09 |
+0.22% |
|
Volume |
836,163,649 |
-3% |
|
Volume |
4,487,178,900 |
+1% |
|
NASDAQ |
+72.04 |
11,466.98 |
+0.63% |
|
Advancers |
1,738 |
59% |
|
Advancers |
2,581 |
57% |
|
S&P 500 |
+12.20 |
3,982.24 |
+0.31% |
|
Decliners |
1,230 |
41% |
|
Decliners |
1,983 |
43% |
|
Russell 2000 |
+5.78 |
1,896.27 |
+0.31% |
|
52 Wk Highs |
72 |
|
|
52 Wk Highs |
101 |
|
|
S&P 600 |
+2.44 |
1,250.16 |
+0.20% |
|
52 Wk Lows |
25 |
|
|
52 Wk Lows |
102 |
|
|
 |
Leadership Improved Monday; Rally Has Been Under Pressure
Kenneth J. Gruneisen - Passed the CAN SLIM® Master's Exam
The Dow climbed 72 points, while the Nasdaq Composite added 0.6% amid a rally in technology shares. The S&P 500 Index advanced 0.3%. Volume totals were lighter than the prior session on the NYSE and slightly higher on the Nasdaq exchange. Advancers led decliners by almost a 3-2 margin on the NYSE and by a 5-4 margin on the Nasdaq exchange. Leadership improved as the were 26 high-ranked companies from the Leaders List that hit new 52-week highs and were listed on the BreakOuts Page, versus 11 on the prior session. New 52-week lows totals outnumbered new 52-week highs on the NYSE and on the Nasdaq exchange. The major indices are in an uptrend under pressure (M criteria). For any rally to be sustained there must be healthy leadership. It will be important to watch for further improvement in the new highs totals in the immediate days ahead. Stay tuned!
PICTURED: The S&P 500 Index closed just above its 50-day moving average (DMA) line after testing its 200 DMA line on the prior session.
Seven of 11 sectors finished in positive territory as U.S. equities finished higher, but pared gains, on Monday. Wall Street tried to rebound from last week’s slump and investors looked ahead to key corporate earnings. Market participants will parse through earnings releases from major retailers for insights into the health of the consumer.
On the data front, durable goods orders fell more than expected in January, down 4.5% after climbing 5.6% in the prior month. The report signaled the decline came as consumers reined in spending on big-ticket items. Meanwhile, capital goods orders climbed 0.8% in the same period. Pending home sales jumped 8.1% month-over-month in January, its largest increase since June 2020. However, the report noted high mortgage rates will likely continue to pose a challenge for the housing sector. Meanwhile, the Dallas Federal Reserve (Fed) Manufacturing Activity Index fell more than anticipated in February, down to -13.5 from January’s -8.4 print.
U.S. Treasuries strengthened, with the yield on the benchmark 10-year note down three basis points (0.03%) to 3.92%, while the 30-year bond yield was unchanged at 3.93%. The yield on the two-year note, which is more sensitive to changes in Fed policy, shed three basis points (0.03%) to 4.78%. In commodities, West Texas Intermediate (WTI) crude slid 0.8% to $75.71/barrel amid concerns over the future course of U.S. monetary policy. |
 Kenneth J. Gruneisen started out as a licensed stockbroker in August 1987, a couple of months prior to the historic stock market crash that took the Dow Jones Industrial Average down -22.6% in a single day. He has published daily fact-based fundamental and technical analysis on high-ranked stocks online for two decades. Through FACTBASEDINVESTING.COM, Kenneth provides educational articles, news, market commentary, and other information regarding proven investment systems that work in good times and bad.
Comments contained in the body of this report are technical opinions only and are not necessarily those of Gruneisen Growth Corp. The material herein has been obtained from sources believed to be reliable and accurate, however, its accuracy and completeness cannot be guaranteed. Our firm, employees, and customers may effect transactions, including transactions contrary to any recommendation herein, or have positions in the securities mentioned herein or options with respect thereto. Any recommendation contained in this report may not be suitable for all investors and it is not to be deemed an offer or solicitation on our part with respect to the purchase or sale of any securities. |
|
 |
Retail, Financial, Tech, and Commodity-Linked Groups Rose
Kenneth J. Gruneisen - Passed the CAN SLIM® Master's Exam
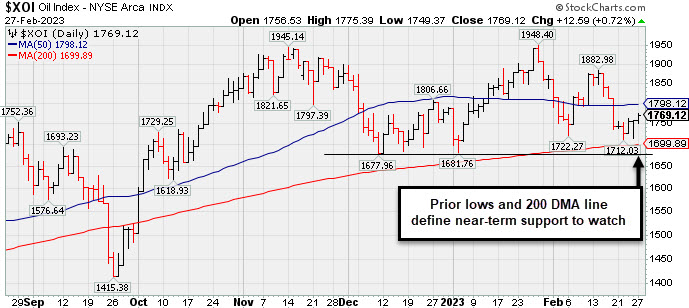
The Broker/Dealer Index ($XBD +0.26%), Bank Index ($BKX +0.20%), and Retail Index ($RLX +0.25%) collectively edged higher. The tech sector also had a slightly positive bias as the Semiconductor Index ($SOX +0.55%), Networking Index ($NWX +0.44%), and Biotech Index ($BTK +0.68%) each posted a gain of less than +1%. Commodity-linked groups had a positive bias as the Oil Services Index ($OSX +1.38%), Integrated Oil Index ($XOI +0.72%), and Gold & Silver Index ($XAU +0.81%) posted unanimous gains.
PICTURED: The Integrated Oil Index ($XOI +0.72%) stalled in January after briefly exceeding the November high. Recently it has been sputtering near prior lows and its 200-day moving average (DMA) line which define important near-term suport to watch.
| Oil Services |
$OSX |
88.04 |
+1.20 |
+1.38% |
+4.99% |
| Integrated Oil |
$XOI |
1,769.12 |
+12.59 |
+0.72% |
-1.01% |
| Semiconductor |
$SOX |
2,951.21 |
+16.09 |
+0.55% |
+16.55% |
| Networking |
$NWX |
810.42 |
+3.55 |
+0.44% |
+3.46% |
| Broker/Dealer |
$XBD |
490.87 |
+1.25 |
+0.26% |
+9.29% |
| Retail |
$RLX |
2,878.44 |
+7.14 |
+0.25% |
+4.52% |
| Gold & Silver |
$XAU |
112.75 |
+0.91 |
+0.81% |
-6.71% |
| Bank |
$BKX |
109.07 |
+0.22 |
+0.20% |
+8.15% |
| Biotech |
$BTK |
5,258.68 |
+35.32 |
+0.68% |
-0.42% |
|
|
|
 |
Quietly Lingering Near High With Strong Fundamentals
Kenneth J. Gruneisen - Passed the CAN SLIM® Master's Exam
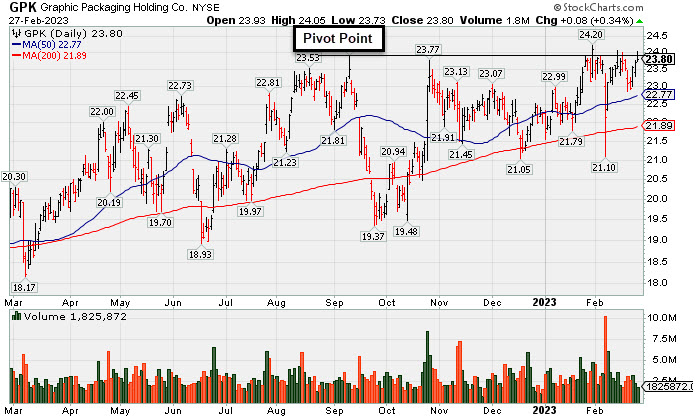
Graphic Packaging Hldg (GPK +$0.08 or +0.34% to $23.80) posted a 3rd consecutive gain with below average volume and closed only -1.7% off its all-time high. It showed resilience after briefly violating its 50-day moving average (DMA) line on 2/07/23. Members were reminded - "Disciplined investors know that gains above a stock's pivot point must be backed by at least +40% above average volume to trigger a proper technical buy signal."
It faces very little resistance due to overhead supply. Subsequent gains above the pivot point backed by at least +40% above average volume may trigger a technical buy signal. It was last shown in this FSU section on 1/27/23 with an annotated graph under the headline, "Graphic Packaging Perched Near Pivot Point".
GPK was highlighted in yellow with pivot point cited based on its 9/12/22 high plus 10 cents in the 10/25/22 mid-day report (read here). GPK has a 98 Earnings Per Share Rating. It reported Dec '22 quarterly earnings +74% on +20% sales revenues versus the year ago period. The past 4 quarterly comparisons were well above the +25% minimum earnings guideline (C criteria). Its annual earnings history has been good, meeting the fact-based investment system's fundamental guidelines (A criteria).
The Paper & Paper Products group is ranked 139th on the 197 Industry Groups list and it has a C (30) Group Relative Strength Rating (L criteria). The number of top-rated funds owning its shares rose from 596 in Sep '21 to 722 in Dec '22, a reassuring sign concerning the I criteria. Its current Up/Down Volume Ratio of 1.3 is an unbiased indication its shares have been under accumulation over the past 50 days.
|
|
|
Color Codes Explained :
Y - Better candidates highlighted by our
staff of experts.
G - Previously featured
in past reports as yellow but may no longer be buyable under the
guidelines.
***Last / Change / Volume data in this table is the closing quote data***
Symbol/Exchange
Company Name
Industry Group |
PRICE |
CHANGE
(%Change) |
Day High |
Volume
(% DAV)
(% 50 day avg vol) |
52 Wk Hi
% From Hi |
Featured
Date |
Price
Featured |
Pivot Featured |
|
Max Buy |
 CMC
-
NYSE
CMC
-
NYSE
Commercial Metals Co
METALS and MINING - Steel and Iron
|
$52.46
|
+0.33
0.63% |
$53.25
|
670,393
60.67% of 50 DAV
50 DAV is 1,105,000
|
$58.09
-9.69%
|
10/14/2022
|
$41.61
|
PP = $44.45
|
|
MB = $46.67
|
Most Recent Note - 2/23/2023 10:42:29 AM
G - Pulling back today testing its 50 DMA line ($52.56) which defines important near-term support to watch. Fundamentals remain strong.
>>> FEATURED STOCK ARTICLE : Metals Firm Extended From Base and Perched Near High - 2/6/2023 |
View all notes |
Set NEW NOTE alert |
Company Profile |
SEC
News |
Chart |
Request a new note
C
A
S
I |
GPK
-
NYSE
Graphic Packaging Hldg
CONSUMER NON-DURABLES - Packaging and Containers
|
$23.80
|
+0.08
0.34% |
$24.05
|
1,825,872
56.35% of 50 DAV
50 DAV is 3,240,000
|
$24.20
-1.65%
|
10/25/2022
|
$22.75
|
PP = $24.17
|
|
MB = $25.38
|
 Most Recent Note - 2/27/2023 6:16:57 PM
Y - Posted a 3rd consecutive small gain with below average volume and closed only -1.7% off its all-time high. Showed resilience after briefly violating its 50 DMA line on 2/07/23. See the latest FSU analysis for more details and a new annotated graph. Members were reminded - "Disciplined investors know that gains above a stock's pivot point must be backed by at least +40% above average volume to trigger a proper technical buy signal."
>>> FEATURED STOCK ARTICLE : Quietly Lingering Near High With Strong Fundamentals - 2/27/2023 |
View all notes |
Set NEW NOTE alert |
Company Profile |
SEC
News |
Chart |
Request a new note
C
A
S
I |
GFF
-
NYSE
Griffon Corporation
MATERIALS and CONSTRUCTION - General Building Materials
|
$36.90
|
+0.43
1.18% |
$37.57
|
346,783
67.21% of 50 DAV
50 DAV is 516,000
|
$43.74
-15.64%
|
11/10/2022
|
$34.13
|
PP = $35.02
|
|
MB = $36.77
|
Most Recent Note - 2/21/2023 10:02:18 AM
G - Pulling back near its "max buy" level and today's early loss was nearly testing its 50 DMA line ($38) which defines important support to watch. Reported Dec '22 quarterly earnings +121 on +10% sales revenues versus the year ago period.
>>> FEATURED STOCK ARTICLE : Extended From Any Sound Base and Still Hitting New Highs - 2/2/2023 |
View all notes |
Set NEW NOTE alert |
Company Profile |
SEC
News |
Chart |
Request a new note
C
A
S
I |
TITN
-
NASDAQ
Titan Machinery Inc
SPECIALTY RETAIL
|
$47.02
|
+1.23
2.69% |
$47.79
|
394,875
184.52% of 50 DAV
50 DAV is 214,000
|
$46.62
0.86%
|
1/13/2023
|
$40.10
|
PP = $44.45
|
|
MB = $46.67
|
Most Recent Note - 2/27/2023 1:07:23 PM
G - Hitting a new all-time high with today's gain and its color code is changed to green after rising above its "max buy" level. Its 50 DMA line ($42.06) definies important near-term support to watch on pullbacks. It wedged into new high territory with gains lacking great volume conviction since a new pivot point was recently cited based on its 12/01/22 high plus 10 cents.
>>> FEATURED STOCK ARTICLE : 7th Consecutive Gain for Titan - 1/30/2023 |
View all notes |
Set NEW NOTE alert |
Company Profile |
SEC
News |
Chart |
Request a new note
C
A
S
I |
MYE
-
NYSE
Myers Industries Inc
Containers/Packaging
|
$25.44
|
+0.82
3.33% |
$25.56
|
161,400
103.46% of 50 DAV
50 DAV is 156,000
|
$25.55
-0.43%
|
12/8/2022
|
$23.94
|
PP = $25.65
|
|
MB = $26.93
|
Most Recent Note - 2/27/2023 6:19:19 PM
Y - Touched a new high today with a big gain backed by average volume and ended at a best-ever close. Found prompt support near its 50 DMA line ($23.62) on recent pullbacks. Faces no resistance due to overhead supply.
>>> FEATURED STOCK ARTICLE : Perched Near High After Finding Support at 50 DMA - 2/3/2023 |
View all notes |
Set NEW NOTE alert |
Company Profile |
SEC
News |
Chart |
Request a new note
C
A
S
I |
Symbol/Exchange
Company Name
Industry Group |
PRICE |
CHANGE
(%Change) |
Day High |
Volume
(% DAV)
(% 50 day avg vol) |
52 Wk Hi
% From Hi |
Featured
Date |
Price
Featured |
Pivot Featured |
|
Max Buy |
BOX
-
NYSE
Box Inc Cl A
Computer Sftwr-Database
|
$33.35
|
+0.11
0.33% |
$33.71
|
1,099,372
80.60% of 50 DAV
50 DAV is 1,364,000
|
$34.98
-4.66%
|
2/2/2023
|
$34.68
|
PP = $33.14
|
|
MB = $34.80
|
Most Recent Note - 2/21/2023 9:57:17 AM
Y - Consolidating above prior highs and its 50 DMA line which coincide in the $32 area defining important near term support to watch.
>>> FEATURED STOCK ARTICLE : Perched Near High After Recent Breakout - 2/7/2023 |
View all notes |
Set NEW NOTE alert |
Company Profile |
SEC
News |
Chart |
Request a new note
C
A
S
I |
STRL
-
NASDAQ
Sterling Infrastructure
MATERIALS and; CONSTRUCTION - Heavy Construction
|
$38.34
|
+0.30
0.79% |
$38.97
|
259,828
99.93% of 50 DAV
50 DAV is 260,000
|
$38.43
-0.23%
|
12/14/2022
|
$32.41
|
PP = $33.72
|
|
MB = $35.41
|
Most Recent Note - 2/24/2023 11:36:37 PM
G - Perched near its all-time high, extended from the previously noted base. Prior highs in the $34-33 area and its 50 DMA line ($34.10) define important near-term support to watch. See the latest FSU analysis for more details and a new annotated graph.
>>> FEATURED STOCK ARTICLE : Sterling Perched Near High, Extended From Prior Base - 2/24/2023 |
View all notes |
Set NEW NOTE alert |
Company Profile |
SEC
News |
Chart |
Request a new note
C
A
S
I |
PERI
-
NASDAQ
Perion Networks Ltd
Comml Svcs-Advertising
|
$34.04
|
+0.58
1.73% |
$34.62
|
895,659
137.37% of 50 DAV
50 DAV is 652,000
|
$35.16
-3.19%
|
1/25/2023
|
$31.79
|
PP = $33.19
|
|
MB = $34.85
|
Most Recent Note - 2/27/2023 12:58:27 PM
Y - Still hovering near its 52-week high, stubbornly holding ground. Showed resilience after undercutting its pivot point. Important suppport to watch is its 50 DMA line ($29.99) and recent low ($29.83 on 2/08/23).
>>> FEATURED STOCK ARTICLE : Perion Stubbornly Holding Ground Near High After Spurt of Gains - 2/22/2023 |
View all notes |
Set NEW NOTE alert |
Company Profile |
SEC
News |
Chart |
Request a new note
C
A
S
I |
ALGM
-
NASDAQ
Allegro Microsystems Inc
Elec-Semiconductor Mfg
|
$42.93
|
-0.30
-0.69% |
$44.00
|
1,272,121
77.24% of 50 DAV
50 DAV is 1,647,000
|
$45.99
-6.65%
|
1/31/2023
|
$37.80
|
PP = $38.38
|
|
MB = $40.30
|
Most Recent Note - 2/21/2023 9:55:27 AM
G - Holding its ground stubbornly after rising above its "max buy" level. Prior high in the $38 area defines initial support to watch on pullbacks.
>>> FEATURED STOCK ARTICLE : Big Volume-Driven Gain for Best-Ever Close - 1/31/2023 |
View all notes |
Set NEW NOTE alert |
Company Profile |
SEC
News |
Chart |
Request a new note
C
A
S
I |
WCC
-
NYSE
Wesco International Inc
WHOLESALE - Electronics Wholesale
|
$166.19
|
+2.31
1.41% |
$166.99
|
379,031
82.22% of 50 DAV
50 DAV is 461,000
|
$172.91
-3.89%
|
2/10/2023
|
$148.50
|
PP = $147.15
|
|
MB = $154.51
|
Most Recent Note - 2/21/2023 7:01:16 PM
G - Color code was changed to green after rallying above its "max buy" level. Prior highs in the $144-147 area define initial support to watch. Reported Dec '22 quarterly earnings +40% on +15% sales revenues versus the year ago period. See the latest FSU analysis for more details and a new annotated graph.
>>> FEATURED STOCK ARTICLE : Powered Higher After Recently Highlighted in Feb 10th Report - 2/21/2023 |
View all notes |
Set NEW NOTE alert |
Company Profile |
SEC
News |
Chart |
Request a new note
C
A
S
I |
Symbol/Exchange
Company Name
Industry Group |
PRICE |
CHANGE
(%Change) |
Day High |
Volume
(% DAV)
(% 50 day avg vol) |
52 Wk Hi
% From Hi |
Featured
Date |
Price
Featured |
Pivot Featured |
|
Max Buy |
FIX
-
NYSE
Comfort Systems U S A
MATERIALS and CONSTRUCTION - General Contractors
|
$146.90
|
+0.09
0.06% |
$148.86
|
545,207
265.95% of 50 DAV
50 DAV is 205,000
|
$146.86
0.03%
|
2/23/2023
|
$136.52
|
PP = $128.78
|
|
MB = $135.22
|
Most Recent Note - 2/27/2023 6:22:01 PM
G - Hit another new high with today's 4th consecutive volume-driven gain, getting more extended from the previously noted base. Prior highs in the $128 area define initial support to watch on pullbacks.
>>> FEATURED STOCK ARTICLE : Powerful Technical Breakout After Earnings Report - 2/23/2023 |
View all notes |
Set NEW NOTE alert |
Company Profile |
SEC
News |
Chart |
Request a new note
C
A
S
I |
|
|
|
THESE ARE NOT BUY RECOMMENDATIONS!
Comments contained in the body of this report are technical
opinions only. The material herein has been obtained
from sources believed to be reliable and accurate, however,
its accuracy and completeness cannot be guaranteed.
This site is not an investment advisor, hence it does
not endorse or recommend any securities or other investments.
Any recommendation contained in this report may not
be suitable for all investors and it is not to be deemed
an offer or solicitation on our part with respect to
the purchase or sale of any securities. All trademarks,
service marks and trade names appearing in this report
are the property of their respective owners, and are
likewise used for identification purposes only.
This report is a service available
only to active Paid Premium Members.
You may opt-out of receiving report notifications
at any time. Questions or comments may be submitted
by writing to Premium Membership Services 665 S.E. 10 Street, Suite 201 Deerfield Beach, FL 33441-5634 or by calling 1-800-965-8307
or 954-785-1121.
|
|
|