You are not logged in.
This means you
CAN ONLY VIEW reports that were published prior to Monday, April 7, 2025.
You
MUST UPGRADE YOUR MEMBERSHIP if you want to see any current reports.
AFTER MARKET UPDATE - TUESDAY, FEBRUARY 27TH, 2024
Previous After Market Report Next After Market Report >>>
|
|
|
|
DOW |
-96.82 |
38,972.41 |
-0.25% |
|
Volume |
910,396,590 |
+2% |
|
Volume |
5,490,634,300 |
+1% |
|
NASDAQ |
+59.05 |
16,035.30 |
+0.37% |
|
Advancers |
1,595 |
57% |
|
Advancers |
2,558 |
60% |
|
S&P 500 |
+8.65 |
5,078.18 |
+0.17% |
|
Decliners |
1,193 |
43% |
|
Decliners |
1,740 |
40% |
|
Russell 2000 |
+27.14 |
2,056.11 |
+1.34% |
|
52 Wk Highs |
164 |
|
|
52 Wk Highs |
250 |
|
|
S&P 600 |
+10.42 |
1,306.16 |
+0.80% |
|
52 Wk Lows |
22 |
|
|
52 Wk Lows |
66 |
|
|
 |
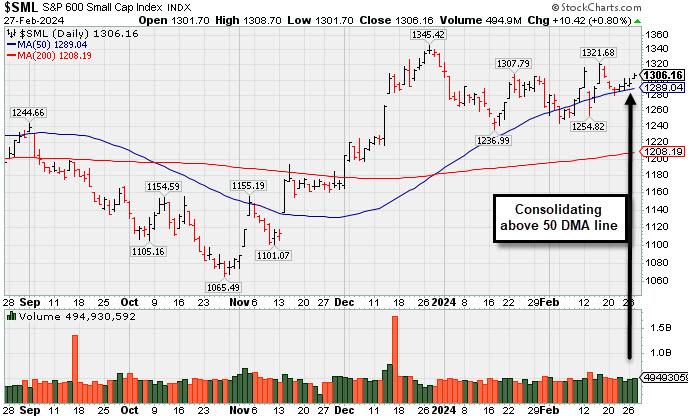
Advancers Led Decliners as Small Caps Led Major Indices Higher
Kenneth J. Gruneisen - Passed the CAN SLIM® Master's Exam
The S&P 500 (+0.2%) and Nasdaq Composite (+0.4%) spent most of the session trading near yesterday's closing levels while the Russell 2000 continued its recent outperformance, climbing +1.3%. The Dow Jones Industrial Average declined -0.3%. Volume was reported higher than the prior session totals on the NYSE and on the Nasdaq exchange. Advancers led decliners by a 4-3 margin on the NYSE and by almost a 3-2 margin on the Nasdaq exchange. There were 101 high-ranked companies from the Leaders List that hit new 52-week highs and were listed on the BreakOuts Page, versus the total of 120 on the prior session. New 52-week highs totals solidly outnumbered shrinking new 52-week lows totals on the NYSE and on the Nasdaq exchange. The major indices are in a confirmed uptrend (M criteria). New buying efforts should be only made in stocks fitting all key criteria of the fact-based investment system.
PICTURED: The S&P Small Cap 600 Index posted a 4th straight gain, consolidating above its 50-day moving average (DMA) line.
UnitedHealth (UNH -2.27%) fell on news that the Department of Justice has launched an antitrust investigation into the company. Apple (AAPL +0.81%) ended slightly higher after trading down as much as -0.9%, rebounding after news that it is cancelling efforts to build an electric car and will focus on generative artificial intelligence.
There was solid demand for a new $42 billion 7-yr note offering. The 2-yr note yield declined two basis points to 4.71% and the 10-yr note yield rose two basis points to 4.32%.
The utilities sector saw the biggest gain, +1.9%, thanks to a big earnings-related rise in shares of Constellation Energy (CEG +16.92%). Norwegian Cruise Line (NCLH +19.84%) also traded higher following pleasing earnings news. Macy's (M +3.37%) and Lowe's (LOW +1.76%) also reported earnings that drew positive reactions from investors. |
 Kenneth J. Gruneisen started out as a licensed stockbroker in August 1987, a couple of months prior to the historic stock market crash that took the Dow Jones Industrial Average down -22.6% in a single day. He has published daily fact-based fundamental and technical analysis on high-ranked stocks online for two decades. Through FACTBASEDINVESTING.COM, Kenneth provides educational articles, news, market commentary, and other information regarding proven investment systems that work in good times and bad.
Comments contained in the body of this report are technical opinions only and are not necessarily those of Gruneisen Growth Corp. The material herein has been obtained from sources believed to be reliable and accurate, however, its accuracy and completeness cannot be guaranteed. Our firm, employees, and customers may effect transactions, including transactions contrary to any recommendation herein, or have positions in the securities mentioned herein or options with respect thereto. Any recommendation contained in this report may not be suitable for all investors and it is not to be deemed an offer or solicitation on our part with respect to the purchase or sale of any securities. |
|
 |
Financial, Networking, and Biotech Indexes Rose
Kenneth J. Gruneisen - Passed the CAN SLIM® Master's Exam
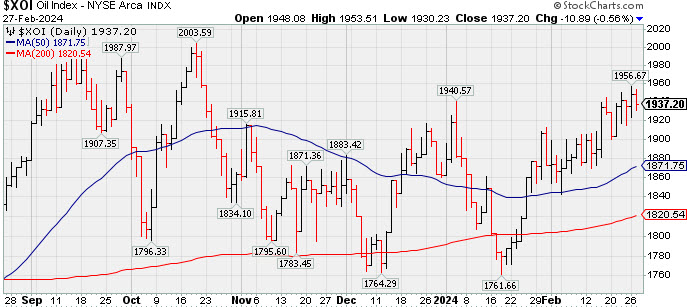
The Broker/Dealer Index ($XBD +0.80%) and the Bank Index ($BKX +1.13%) both gained solid ground on Tuesday while the Retail Index ($RLX +0.20%) also inched higher. The tech sector was mixed as the Semiconductor Index ($SOX -0.18%) ended slightly in the red while the Networking Index ($NWX +0.51%) and the Biotech Index ($BTK +0.99%) both posted gains. Commodity-linked groups were mixed as the Gold & Silver Index ($XAU -0.76%) and the Integrated Oil Index ($XOI -0.56%) both edged lower, meanwhile the Oil Services Index ($OSX +0.59%) posted a small gain.
![]() PICTURED: The Integrated Oil Index ($XOI -0.56%) ended lower, but it recently has made progress above its January high.
| Oil Services |
$OSX |
80.88 |
+0.48 |
+0.59% |
-3.58% |
| Integrated Oil |
$XOI |
1,937.20 |
-10.89 |
-0.56% |
+4.01% |
| Semiconductor |
$SOX |
4,654.89 |
-8.57 |
-0.18% |
+11.48% |
| Networking |
$NWX |
824.54 |
+4.15 |
+0.51% |
-0.99% |
| Broker/Dealer |
$XBD |
571.79 |
+4.51 |
+0.80% |
+2.60% |
| Retail |
$RLX |
4,348.58 |
+8.85 |
+0.20% |
+11.82% |
| Gold & Silver |
$XAU |
104.39 |
-0.80 |
-0.76% |
-16.95% |
| Bank |
$BKX |
96.11 |
+1.07 |
+1.13% |
+0.09% |
| Biotech |
$BTK |
5,276.97 |
+51.58 |
+0.99% |
-2.62% |
|
|
|
 |
Wedging Above "Max Buy" Level With Gains Lacking Great Volume
Kenneth J. Gruneisen - Passed the CAN SLIM® Master's Exam
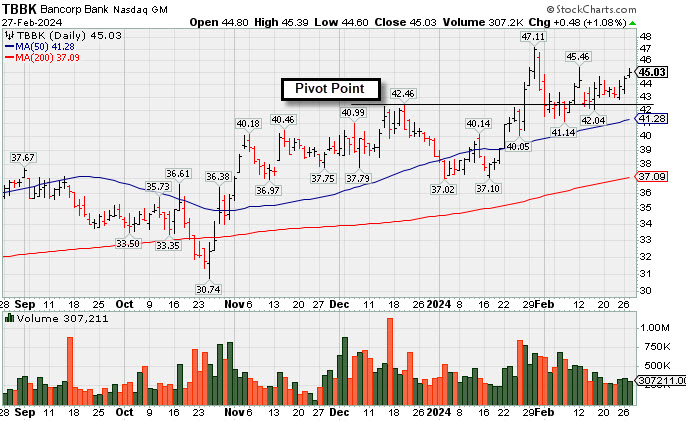
The Bancorp (TBBK +$0.48 or +1.08% to $45.03) wedged above the "max buy" level with today's 3rd consecutive gain backed by below-average volume. Prior highs in the $42 area define support above its 50-day moving average (DMA) line. TBBK was highlighted in yellow with pivot point cited based on its 7/27/23 high plus 10 cents in the 12/04/23 mid-day report (read here). It last appeared in this FSU section on 1/26/24 with an annotated graph under the headline, "Volume-Driven Breakout Triggered Buy Signal After Earnings Report". Quarterly earnings increases above the +25% guideline satisfy the C criteria. Its annual earnings (A criteria) history has been steadily improving. The number of top-rated funds owning its shares rose from 422 in Sep '12 to 466 in Dec '23, a reassuring sign concerning the I criteria. Its small supply (S criteria) of only 51 million shares in the public float can contribute to greater price volatility in the event of institutional buying or selling. |
|
|
Color Codes Explained :
Y - Better candidates highlighted by our
staff of experts.
G - Previously featured
in past reports as yellow but may no longer be buyable under the
guidelines.
***Last / Change / Volume data in this table is the closing quote data***
Symbol/Exchange
Company Name
Industry Group |
PRICE |
CHANGE
(%Change) |
Day High |
Volume
(% DAV)
(% 50 day avg vol) |
52 Wk Hi
% From Hi |
Featured
Date |
Price
Featured |
Pivot Featured |
|
Max Buy |
 ANET
-
NYSE
ANET
-
NYSE
Arista Networks
Computer-Networking
|
$271.91
|
-1.83
-0.67% |
$276.30
|
1,252,024
56.96% of 50 DAV
50 DAV is 2,198,000
|
$292.66
-7.09%
|
10/31/2023
|
$188.84
|
PP = $198.80
|
|
MB = $208.74
|
Most Recent Note - 2/22/2024 5:56:51 PM
G - Posted a solid volume-driven gain today. Extended from any sound base. Its 50 DMA line ($252) defines important near-term support to watch on pullbacks.
>>> FEATURED STOCK ARTICLE : Pulled Back From All Time High With Gap Down on Prior Session - 2/1/2024 |
View all notes |
Set NEW NOTE alert |
Company Profile |
SEC
News |
Chart |
Request a new note
C
A
S
I |
NVO
-
NYSE
Novo Nordisk ADR
Medical-Ethical Drugs
|
$122.23
|
-1.26
-1.02% |
$122.56
|
7,434,638
161.45% of 50 DAV
50 DAV is 4,605,000
|
$124.87
-2.11%
|
11/2/2023
|
$100.97
|
PP = $104.10
|
|
MB = $109.31
|
 Most Recent Note - 2/27/2024 12:25:23 PM
G - Perched near its all-time high, extended from any sound base. Its 50 DMA line ($110.58) defines important near-term support to watch on pullbacks.
>>> FEATURED STOCK ARTICLE : Extended From Any Sound Base After Volume-Driven Gains - 2/8/2024 |
View all notes |
Set NEW NOTE alert |
Company Profile |
SEC
News |
Chart |
Request a new note
C
A
S
I |
AXON
-
NASDAQ
Axon Enterprise
Security/Sfty
|
$272.02
|
+0.43
0.16% |
$273.62
|
815,036
220.88% of 50 DAV
50 DAV is 369,000
|
$274.78
-1.00%
|
11/8/2023
|
$127.84
|
PP = $223.30
|
|
MB = $234.47
|
Most Recent Note - 2/27/2024 12:09:50 PM
G - Due to report Dec '23 quarterly results. Volume and volatility often increase near earnings news. Hovering near its all-time high. Prior highs in the $260-262 area define initial support to watch above its 50-day moving average (DMA) line ($258).
>>> FEATURED STOCK ARTICLE : Reversal at All-Time High After 7 Consecutive Gains - 2/12/2024 |
View all notes |
Set NEW NOTE alert |
Company Profile |
SEC
News |
Chart |
Request a new note
C
A
S
I |
TDG
-
NYSE
TransDigm Group
Aerospace/Defense
|
$1,174.22
|
-13.18
-1.11% |
$1,187.76
|
192,437
89.51% of 50 DAV
50 DAV is 215,000
|
$1,207.58
-2.76%
|
12/12/2023
|
$1,000.39
|
PP = $1,013.18
|
|
MB = $1,063.84
|
Most Recent Note - 2/27/2024 11:30:31 AM
G - Pulling back today with below-average volume for a 2nd loss off of its all-time high. Its 50 DMA line ($1,068) defines near-term support to watch.
>>> FEATURED STOCK ARTICLE : Transdigm Perched Near All-Time High - 2/14/2024 |
View all notes |
Set NEW NOTE alert |
Company Profile |
SEC
News |
Chart |
Request a new note
C
A
S
I |
TBBK
-
NASDAQ
The Bancorp
Banks-Northeast
|
$45.03
|
+0.48
1.08% |
$45.39
|
307,211
68.73% of 50 DAV
50 DAV is 447,000
|
$47.11
-4.42%
|
1/22/2024
|
$40.87
|
PP = $42.56
|
|
MB = $44.69
|
Most Recent Note - 2/27/2024 6:19:45 PM
G - Color code was changed to green after wedging above its "max buy" level with today's 3rd consecutive gain backed by below-average volume. Prior highs in the $42 area and its 50 DMA line ($41.28) define near-term support to watch. Fundamentals remain strong. See the latest FSU analysis for more details and a new annotated graph.
>>> FEATURED STOCK ARTICLE : Wedging Above "Max Buy" Level With Gains Lacking Great Volume - 2/27/2024 |
View all notes |
Set NEW NOTE alert |
Company Profile |
SEC
News |
Chart |
Request a new note
C
A
S
I |
Symbol/Exchange
Company Name
Industry Group |
PRICE |
CHANGE
(%Change) |
Day High |
Volume
(% DAV)
(% 50 day avg vol) |
52 Wk Hi
% From Hi |
Featured
Date |
Price
Featured |
Pivot Featured |
|
Max Buy |
LULU
-
NASDAQ
lululemon athletica
Retail-Apparel/Shoes/Acc
|
$467.84
|
-0.41
-0.09% |
$471.50
|
910,682
72.56% of 50 DAV
50 DAV is 1,255,000
|
$516.39
-9.40%
|
12/8/2023
|
$490.61
|
PP = $485.93
|
|
MB = $510.23
|
Most Recent Note - 2/22/2024 6:03:00 PM
G - Posted a gain today with below-average volume. Still lingering below its 50 DMA line ($481) which is now downward sloping and may act as resistance. A rebound above the 50 DMA line is needed to help its outlook improve.
>>> FEATURED STOCK ARTICLE : Violation of 50-Day Moving Average Hurt Outlook - 2/2/2024 |
View all notes |
Set NEW NOTE alert |
Company Profile |
SEC
News |
Chart |
Request a new note
C
A
S
I |
CRWD
-
NASDAQ
CrowdStrike Holdings
Computer Sftwr-Security
|
$321.01
|
-0.02
-0.01% |
$329.09
|
2,768,342
85.13% of 50 DAV
50 DAV is 3,252,000
|
$338.45
-5.15%
|
1/2/2024
|
$246.42
|
PP = $261.91
|
|
MB = $275.01
|
Most Recent Note - 2/26/2024 5:08:30 PM
G - Posted a 3rd consecutive volume-driven gain today. Showing strength after testing support near its 50 DMA line ($286.85). Fundamentals remain strong.
>>> FEATURED STOCK ARTICLE : Volume Totals Cooking While Stubbornly Perched at All-Time High - 2/6/2024 |
View all notes |
Set NEW NOTE alert |
Company Profile |
SEC
News |
Chart |
Request a new note
C
A
S
I |
ELF
-
NYSE
e.l.f. Beauty
Cosmetics/Personal Care
|
$202.00
|
+2.39
1.20% |
$204.72
|
1,502,664
100.58% of 50 DAV
50 DAV is 1,494,000
|
$200.49
0.75%
|
1/2/2024
|
$138.23
|
PP = $153.63
|
|
MB = $161.31
|
Most Recent Note - 2/26/2024 5:09:29 PM
G - Posted a 4th consecutive gain today for yet another new all-time high. Reported Dec '23 quarterly earnings +54% on +85% sales revenues versus the year-ago period, continuing its strong earnings track record. Its 50 DMA line ($158) defines important near-term support to watch.
>>> FEATURED STOCK ARTICLE : Peched at All-Time High With Earnings News Due - 2/5/2024 |
View all notes |
Set NEW NOTE alert |
Company Profile |
SEC
News |
Chart |
Request a new note
C
A
S
I |
KOF
-
NYSE
Coca Cola Femsa Sab Ads
FOOD and BEVERAGE - Beverages - Soft Drinks
|
$99.90
|
+1.24
1.26% |
$101.58
|
229,000
141.62% of 50 DAV
50 DAV is 161,700
|
$104.38
-4.29%
|
1/12/2024
|
$93.38
|
PP = $99.34
|
|
MB = $104.31
|
Most Recent Note - 2/23/2024 5:22:14 PM
Y - Sputtering after a noted "negative reversal" at its all-time high. Reported Dec '23 quarterly earnings -13% on +24% sales revenues versus the year-ago period. Volume and volatility often increase near earnings news. Its 50 DMA line ($94.83) defines important near-term support to watch on pullbacks.
>>> FEATURED STOCK ARTICLE : Perched at High With Earnings News Due - 2/21/2024 |
View all notes |
Set NEW NOTE alert |
Company Profile |
SEC
News |
Chart |
Request a new note
C
A
S
I |
PCAR
-
NASDAQ
Paccar
Trucks and Parts-Hvy Duty
|
$111.33
|
-0.92
-0.82% |
$112.37
|
1,759,794
78.07% of 50 DAV
50 DAV is 2,254,000
|
$112.68
-1.20%
|
1/23/2024
|
$100.35
|
PP = $98.57
|
|
MB = $103.50
|
Most Recent Note - 2/26/2024 5:06:25 PM
G - Hit another new all-time high with today's 4th consecutive gain backed by below-average volume, getting more extended from any sound base. Its 50 DMA line ($100) defines near-term support to watch on pullbacks. Fundamentals remain strong. See the latest FSU analysis for more details and a new annotated graph.
>>> FEATURED STOCK ARTICLE : Extended From Any Sound Base After 7 Weekly Gains - 2/26/2024 |
View all notes |
Set NEW NOTE alert |
Company Profile |
SEC
News |
Chart |
Request a new note
C
A
S
I |
Symbol/Exchange
Company Name
Industry Group |
PRICE |
CHANGE
(%Change) |
Day High |
Volume
(% DAV)
(% 50 day avg vol) |
52 Wk Hi
% From Hi |
Featured
Date |
Price
Featured |
Pivot Featured |
|
Max Buy |
HUBB
-
NYSE
Hubbell
Electrical-Power/Equipmt
|
$367.49
|
-2.09
-0.57% |
$371.06
|
297,163
75.23% of 50 DAV
50 DAV is 395,000
|
$371.50
-1.08%
|
1/30/2024
|
$343.26
|
PP = $336.83
|
|
MB = $353.67
|
Most Recent Note - 2/22/2024 6:01:17 PM
G - Posted a volume-driven gain today for a new all-time high, extended from the previously noted base. Prior high ($340) defines initial support to watch on pullbacks.
>>> FEATURED STOCK ARTICLE : Volume Heavy Behind Breakout Gain for Hubbell - 1/30/2024 |
View all notes |
Set NEW NOTE alert |
Company Profile |
SEC
News |
Chart |
Request a new note
C
A
S
I |
MANH
-
NASDAQ
Manhattan Associates
Computer Sftwr-Enterprse
|
$250.47
|
+0.38
0.15% |
$252.99
|
438,976
111.13% of 50 DAV
50 DAV is 395,000
|
$258.91
-3.26%
|
1/31/2024
|
$240.57
|
PP = $230.71
|
|
MB = $242.25
|
Most Recent Note - 2/27/2024 11:27:26 AM
G - Perched near its all-time high with light volume behind today's 4th consecutive small gain. Prior highs in the $230 area define near-term support to watch on pullbacks.
>>> FEATURED STOCK ARTICLE : Big Volume Behind Breakout Gain - 1/31/2024 |
View all notes |
Set NEW NOTE alert |
Company Profile |
SEC
News |
Chart |
Request a new note
C
A
S
I |
TENB
-
NASDAQ
Tenable Holdings
Computer Sftwr - Security
|
$47.39
|
+0.09
0.19% |
$48.09
|
821,720
78.71% of 50 DAV
50 DAV is 1,044,000
|
$53.50
-11.42%
|
2/7/2024
|
$49.50
|
PP = $49.87
|
|
MB = $52.36
|
Most Recent Note - 2/27/2024 11:32:02 AM
G - Its Relative Strength rating has slumped to 71, well below the 80+ minimum guideline for buy candidates. Finding support recently above the 50 DMA line ($47.14). Fundamentals remain strong.
>>> FEATURED STOCK ARTICLE : Gap Up Gain Followed Latest Earnings Report - 2/7/2024 |
View all notes |
Set NEW NOTE alert |
Company Profile |
SEC
News |
Chart |
Request a new note
C
A
S
I |
USLM
-
NASDAQ
U.S. Lime & Minerals
Bldg-Cement/Concrt/Ag
|
$254.98
|
+1.34
0.53% |
$255.32
|
9,065
50.36% of 50 DAV
50 DAV is 18,000
|
$266.88
-4.46%
|
2/9/2024
|
$254.68
|
PP = $265.09
|
|
MB = $278.34
|
Most Recent Note - 2/27/2024 11:28:38 AM
Y - Perched near its all-time high with volume totals cooling. Subsequent gains and a close above the pivot point backed by at least +40% above average volume may trigger a conviciing new technical buy signal. Through Dec '23 its quarterly and annual earnings (C and A criteria) history has been strong, a good match with the fact-based investment system's guidelines. Thinly traded firm has only 5.7 million shares outstanding (S criteria), which can contribute to greater price volatility in the event of institutional buying or selling.
>>> FEATURED STOCK ARTICLE : Strong Finish for Thinly Traded U.S Lime & Minerals - 2/9/2024 |
View all notes |
Set NEW NOTE alert |
Company Profile |
SEC
News |
Chart |
Request a new note
C
A
S
I |
NOW
-
NYSE
ServiceNow
Computer Sftwr-Enterprse
|
$767.14
|
-12.52
-1.61% |
$783.99
|
1,365,606
113.71% of 50 DAV
50 DAV is 1,201,000
|
$815.32
-5.91%
|
2/22/2024
|
$771.75
|
PP = $815.32
|
|
MB = $856.09
|
Most Recent Note - 2/23/2024 5:17:22 PM
Y - Color code was changed to yellow as it was noted that a valid secondary buy point exists up to +5% above the latest high after finding support at its 10 WMA line following an earlier breakout. Reported Dec '23 quarterly earnings +36% on +26% sales revenues versus the year-ago period, its 6th quarterly comparison above the +25% minimum guideline (C criteria) of the fact-based investment system. See the latest FSU analysis for more details and a new annotated graph.
>>> FEATURED STOCK ARTICLE : Found Support With a Solid Gap Up from 10-Week Moving Average - 2/23/2024 |
View all notes |
Set NEW NOTE alert |
Company Profile |
SEC
News |
Chart |
Request a new note
C
A
S
I |
Symbol/Exchange
Company Name
Industry Group |
PRICE |
CHANGE
(%Change) |
Day High |
Volume
(% DAV)
(% 50 day avg vol) |
52 Wk Hi
% From Hi |
Featured
Date |
Price
Featured |
Pivot Featured |
|
Max Buy |
SNPS
-
NASDAQ
Synopsys
Computer Sftwr-Design
|
$574.00
|
-1.70
-0.30% |
$578.10
|
725,569
49.22% of 50 DAV
50 DAV is 1,474,000
|
$629.38
-8.80%
|
2/22/2024
|
$600.65
|
PP = $582.85
|
|
MB = $611.99
|
Most Recent Note - 2/22/2024 5:55:08 PM
Y - Gapped up and hit a new all-time high today but encountered distributional pressure and ended near the session low, closing below the pivot point cited based on its 2/09/24 high after a cup-with-handle base. A strong close above the pivot point is needed to clinch a proper technical buy signal. Found support recently at its 50 DMA line ($536). Reported Jan '24 quarterly earnings +36% on +21% sales revenues versus the year-ago period, its 3rd strong quarter above the +25% minimum earnings guideline (C criteria). Annual earnings growth (A criteria) has been strong and steady. See the latest FSU analysis for more details and a new annotated graph.
>>> FEATURED STOCK ARTICLE : Gapped Up for New High But Ended Near Session Low - 2/22/2024 |
View all notes |
Set NEW NOTE alert |
Company Profile |
SEC
News |
Chart |
Request a new note
C
A
S
I |
|
|
|
THESE ARE NOT BUY RECOMMENDATIONS!
Comments contained in the body of this report are technical
opinions only. The material herein has been obtained
from sources believed to be reliable and accurate, however,
its accuracy and completeness cannot be guaranteed.
This site is not an investment advisor, hence it does
not endorse or recommend any securities or other investments.
Any recommendation contained in this report may not
be suitable for all investors and it is not to be deemed
an offer or solicitation on our part with respect to
the purchase or sale of any securities. All trademarks,
service marks and trade names appearing in this report
are the property of their respective owners, and are
likewise used for identification purposes only.
This report is a service available
only to active Paid Premium Members.
You may opt-out of receiving report notifications
at any time. Questions or comments may be submitted
by writing to Premium Membership Services 665 S.E. 10 Street, Suite 201 Deerfield Beach, FL 33441-5634 or by calling 1-800-965-8307
or 954-785-1121.
|
|
|