You are not logged in.
This means you
CAN ONLY VIEW reports that were published prior to Wednesday, April 9, 2025.
You
MUST UPGRADE YOUR MEMBERSHIP if you want to see any current reports.
AFTER MARKET UPDATE - THURSDAY, FEBRUARY 25TH, 2021
Previous After Market Report Next After Market Report >>>
|
|
|
|
DOW |
-559.85 |
31,402.01 |
-1.75% |
|
Volume |
1,237,776,526 |
+4% |
|
Volume |
6,315,448,000 |
+11% |
|
NASDAQ |
-478.54 |
13,119.43 |
-3.52% |
|
Advancers |
433 |
13% |
|
Advancers |
542 |
14% |
|
S&P 500 |
-96.09 |
3,829.34 |
-2.45% |
|
Decliners |
2,800 |
87% |
|
Decliners |
3,269 |
86% |
|
Russell 2000 |
-84.21 |
2,200.17 |
-3.69% |
|
52 Wk Highs |
291 |
|
|
52 Wk Highs |
272 |
|
|
S&P 600 |
-40.03 |
1,283.73 |
-3.02% |
|
52 Wk Lows |
61 |
|
|
52 Wk Lows |
87 |
|
|
 |
Major Indices Slide With Heavier Institutional Selling Pressure
Kenneth J. Gruneisen - Passed the CAN SLIM® Master's Exam
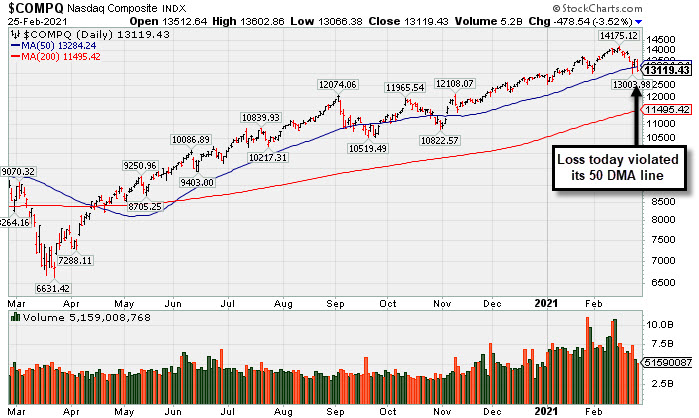
The Dow and S&P 500 both notched their biggest one-day decline in February, tumbling 559 points and 2.5%, respectively. Weakness in growth-oriented companies weighed on the tech-heavy Nasdaq Composite, with the index capping its worst day since October with a 3.5% decline. The volume totals were higher than the prior session on the NYSE and on the Nasdaq exchange, indicative of heavier institutional selling pressure termed "distribution". Breadth was negative as decliners led advancers by a 6-1 margin on the NYSE and on the Nasdaq exchange. There were 85 high-ranked companies from the Leaders List that hit new 52-week highs and were listed on the BreakOuts Page, versus the total of 99 on the prior session. New 52-week highs totals contracted but still outnumbered the expanding new 52-week lows totals on both exchanges. The major indices' uptrend (M criteria) has clearly come under pressure. It remains very important for healthy leadership to continue, for any rally can only be sustained if it is supported by many stocks hitting new highs. Investors are reminded to always make buying and selling decisions based based on the strict criteria and rules of the fact-based investment system. PICTURED: The Nasdaq Composite Index violated and closed Thursday's session below its 50-day moving average (DMA) line.
U.S. stocks ended broadly lower on Thursday, as investors monitored a sell-off in Treasuries. The yield on the 10-year note briefly soared to 1.61%, its highest level in a year. The benchmark yield pared the spike, but still ended 15 basis points higher at 1.52% and remains on track for its largest monthly increase since November 2016.
All 11 S&P 500 sectors finished in negative territory, with nine groups falling more than 1%. Consumer Discretionary stocks led laggards as Tesla (TSLA -8.06%) slumped. Retailers also weighed on the sector, with Best Buy (BBY -9.27%) diving after comparable-store sales fell short of consensus forecasts during the holiday quarter. Information Technology also underperformed, with chipmakers under pressure. Shares of NVDIA (NVDA -8.22%) sank as a top and bottom line beat was overshadowed by a miss on data-center growth metrics. Shares of Moderna (MRNA +2.48%) bucked the downtrend after the drugmaker noted it has topped $18 billion worth of agreements for its Covid-19 vaccine in 2021.
Economic data was also in focus, with the second print of U.S. fourth-quarter GDP showing the economy expanded at an improved annualized rate of 4.1% during the October-December period. Separately, Initial jobless claims came in at 730,000 in the latest week, below the projected 825,000 increase and easing from the previous 841,000 figure. |
 Kenneth J. Gruneisen started out as a licensed stockbroker in August 1987, a couple of months prior to the historic stock market crash that took the Dow Jones Industrial Average down -22.6% in a single day. He has published daily fact-based fundamental and technical analysis on high-ranked stocks online for two decades. Through FACTBASEDINVESTING.COM, Kenneth provides educational articles, news, market commentary, and other information regarding proven investment systems that work in good times and bad.
Comments contained in the body of this report are technical opinions only and are not necessarily those of Gruneisen Growth Corp. The material herein has been obtained from sources believed to be reliable and accurate, however, its accuracy and completeness cannot be guaranteed. Our firm, employees, and customers may effect transactions, including transactions contrary to any recommendation herein, or have positions in the securities mentioned herein or options with respect thereto. Any recommendation contained in this report may not be suitable for all investors and it is not to be deemed an offer or solicitation on our part with respect to the purchase or sale of any securities. |
|
 |
Retail, Financial, Tech, and Commodity-Linked Groups Fell
Kenneth J. Gruneisen - Passed the CAN SLIM® Master's Exam
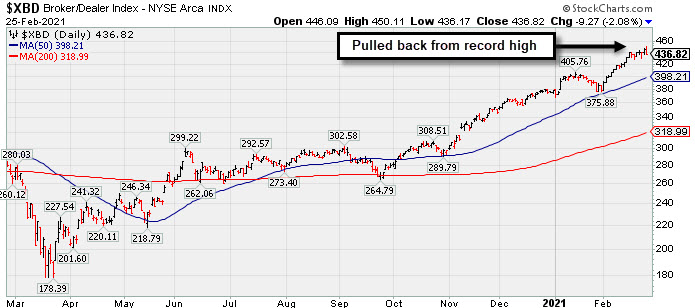
The Retail Index ($RLX -3.06%) created a drag on the major indices along with weaker financial shares as the Broker/Dealer Index ($XBD -2.08%) and Bank Index ($BKX -2.67%) both fell. The Semiconductor Index ($SOX -5.80%) led the tech retreat while the Biotech Index ($BTK -2.80%) and Networking Index ($NWX -1.78%) also lost ground. Commodity-linked groups also had a negative bias as the Gold & Silver Index ($XAU -4.18%) outpaced the Integrated Oil Index ($XOI -2.21%) and Oil Services Index ($OSX -0.77%) to the downside.
PICTURED: The Broker/Dealer Index ($XBD -2.08%) pulled back from its record high.
| Oil Services |
$OSX |
56.64 |
-0.44 |
-0.77% |
+27.77% |
| Integrated Oil |
$XOI |
1,009.78 |
-22.84 |
-2.21% |
+27.42% |
| Semiconductor |
$SOX |
2,999.16 |
-184.57 |
-5.80% |
+7.29% |
| Networking |
$NWX |
776.86 |
-14.12 |
-1.78% |
+8.33% |
| Broker/Dealer |
$XBD |
436.82 |
-9.27 |
-2.08% |
+15.68% |
| Retail |
$RLX |
3,449.78 |
-108.80 |
-3.06% |
-3.18% |
| Gold & Silver |
$XAU |
137.36 |
-5.99 |
-4.18% |
-4.73% |
| Bank |
$BKX |
116.57 |
-3.20 |
-2.67% |
+19.06% |
| Biotech |
$BTK |
5,755.37 |
-165.57 |
-2.80% |
+0.28% |
|
|
|
 |
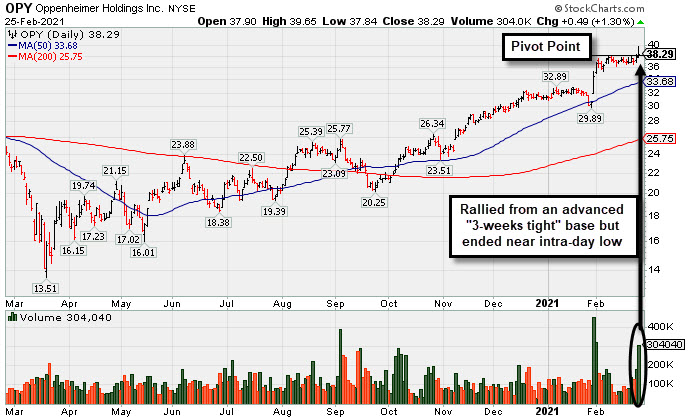
Rose From "3-weeks Tight" Base But Ended Near Session Low
Kenneth J. Gruneisen - Passed the CAN SLIM® Master's Exam
Oppenheimer Holdings Inc (OPY +$0.49 or +1.30% to $38.29) finished near the intra-day low after highlighted in yellow with pivot point cited based on its 2/05/21 high plus 10 cents in the earlier mid-day report (read here). It powered to new multi-year highs with volume-driven gains after an advanced "3-weeks tight" base.
OPY stubbornly held its ground since noted in the 2/05/21 mid-day report - "Reported Dec '20 quarterly earnings +235% on +43% sales revenues versus the year ago period. Showed strong earnings increases over the year ago period in the past 3 quarterly comparisons. Annual earnings (A criteria) growth has been strong after a downturn and losses in FY '15 & '16." It has the highest possible Earnings Per Share Rating of 99.
The company hails from the FINANCIAL SERVICES - Investment Brokerage - Regional industry group which is now ranked 33rd on the 197 Industry Groups list(L criteria). There is a small supply of only 9 million shares in the publicly traded float (S criteria) which can contribute to greater price volatility in the event of institutional buying or selling. The number of top-rated funds owning its shares reported fell from 214 in Jun '2 to 199 in Dec '20, however, its current Up/Down Volume Ratio of 1.1 is an unbiased indication its shares have been under slight accumulation over the past 50 days (I criteria).
|
|
|
Color Codes Explained :
Y - Better candidates highlighted by our
staff of experts.
G - Previously featured
in past reports as yellow but may no longer be buyable under the
guidelines.
***Last / Change / Volume data in this table is the closing quote data***
Symbol/Exchange
Company Name
Industry Group |
PRICE |
CHANGE
(%Change) |
Day High |
Volume
(% DAV)
(% 50 day avg vol) |
52 Wk Hi
% From Hi |
Featured
Date |
Price
Featured |
Pivot Featured |
|
Max Buy |
 CRL
-
NYSE
CRL
-
NYSE
Charles River Labs Intl
DRUGS - Biotechnology
|
$280.18
|
-8.04
-2.79% |
$289.63
|
290,579
89.41% of 50 DAV
50 DAV is 325,000
|
$303.79
-7.77%
|
12/17/2020
|
$247.06
|
PP = $257.98
|
|
MB = $270.88
|
 Most Recent Note - 2/25/2021 6:00:28 PM
G - Pulled back today with below average volume. Slumping since it reported Dec '20 quarterly earnings +19% on +14% sales revenues versus the year ago period, below the +25% minimum earnings guideline (C criteria).
>>> FEATURED STOCK ARTICLE : Testing Important Support on Pullback - 1/29/2021 |
View all notes |
Set NEW NOTE alert |
Company Profile |
SEC
News |
Chart |
Request a new note
C
A
S
I |
AMRC
-
NYSE
Ameresco Inc Cl A
ENERGY - Alternative
|
$56.16
|
-4.04
-6.71% |
$59.71
|
409,516
89.41% of 50 DAV
50 DAV is 458,000
|
$70.26
-20.07%
|
12/15/2020
|
$46.72
|
PP = $47.10
|
|
MB = $49.46
|
Most Recent Note - 2/25/2021 5:26:38 PM
G - Finished near the session low and triggered a technical sell signal with today's 4th consecutive volume-driven loss. Violated its 50-day moving average (DMA) line ($57.74) which had been noted as important near-term support to watch. It will be dropped from the Featured Stocks list tonight.
>>> FEATURED STOCK ARTICLE : Rebounding After Retreat From Record High - 2/1/2021 |
View all notes |
Set NEW NOTE alert |
Company Profile |
SEC
News |
Chart |
Request a new note
C
A
S
I |
OPY
-
NYSE
Oppenheimer Holdings Inc
FINANCIAL SERVICES - Investment Brokerage - Regiona
|
$38.29
|
+0.49
1.30% |
$39.65
|
304,040
262.10% of 50 DAV
50 DAV is 116,000
|
$38.25
0.10%
|
2/25/2021
|
$38.95
|
PP = $38.11
|
|
MB = $40.02
|
Most Recent Note - 2/25/2021 5:21:13 PM
Y - Finished near the session low today after highlighted in yellow with pivot point cited based on its 2/05/21 high plus 10 cents in the earlier mid-day report. Powered to new multi-year highs with volume-driven gains after an advanced "3-weeks tight" base. Stubbornly held its ground since last noted in the 2/05/21 mid-day report - "Reported Dec '20 quarterly earnings +235% on +43% sales revenues versus the year ago period. Showed strong earnings increases over the year ago period in the past 3 quarterly comparisons. Annual earnings (A criteria) growth has been strong after a downturn and losses in FY '15 & '16." See the latest FSU analysis for more details and a new annotated graph.
>>> FEATURED STOCK ARTICLE : Rose From "3-weeks Tight" Base But Ended Near Session Low - 2/25/2021 |
View all notes |
Set NEW NOTE alert |
Company Profile |
SEC
News |
Chart |
Request a new note
C
A
S
I |
CLFD
-
NASDAQ
Clearfield Inc
TELECOMMUNICATIONS - Cables / Satalite Equipment
|
$32.56
|
-1.35
-3.98% |
$34.24
|
133,577
84.01% of 50 DAV
50 DAV is 159,000
|
$38.75
-15.97%
|
1/20/2021
|
$31.38
|
PP = $28.42
|
|
MB = $29.84
|
Most Recent Note - 2/24/2021 5:18:41 PM
G - Halted its slide today with a gain after a gap down on the prior session and damaging volume-driven loss raised concerns. It is very extended from any sound base. Its 50 DMA line ($29.87) and prior highs in the $28 area define important near-term support to watch. Reported Dec '20 quarterly earnings +475% on +40% sales revenues versus the year ago period, continuing its strong earning track record. See the latest FSU analysis for more details and a new annotated graph.
>>> FEATURED STOCK ARTICLE : Consolidating Well Above 50-Day Moving Average Line - 2/24/2021 |
View all notes |
Set NEW NOTE alert |
Company Profile |
SEC
News |
Chart |
Request a new note
C
A
S
I |
NOW
-
NYSE
Servicenow Inc
Computer Sftwr-Enterprse
|
$528.79
|
-23.04
-4.18% |
$556.49
|
1,753,917
129.90% of 50 DAV
50 DAV is 1,350,200
|
$598.37
-11.63%
|
8/20/2020
|
$453.34
|
PP = $454.79
|
|
MB = $477.53
|
Most Recent Note - 2/25/2021 5:31:10 PM
Damaging volume-driven loss today violated its 50 DMA line ($549) raising concerns and triggering a technical sell signal. Relative Strength rating has slumped to 58, well below the 80+ minimum guideline for buy candidates. It will be dropped from the Featured Stocks list tonight. A new pivot point was not cited due to fundamental concerns noted after it reported Dec '20 quarterly earnings +22% on +31% sales revenues versus the year ago period, its 2nd consecutive comparison below the +25% minimum guideline (C criteria) of the fact-based investment system.
>>> FEATURED STOCK ARTICLE : Hit New Highs With Latest Gains Backed by Light Volume - 2/5/2021 |
View all notes |
Set NEW NOTE alert |
Company Profile |
SEC
News |
Chart |
Request a new note
C
A
S
I |
Symbol/Exchange
Company Name
Industry Group |
PRICE |
CHANGE
(%Change) |
Day High |
Volume
(% DAV)
(% 50 day avg vol) |
52 Wk Hi
% From Hi |
Featured
Date |
Price
Featured |
Pivot Featured |
|
Max Buy |
SMPL
-
NASDAQ
Simply Good Foods Co
Food-Confectionery
|
$28.99
|
-0.39
-1.33% |
$29.97
|
396,900
34.83% of 50 DAV
50 DAV is 1,139,600
|
$32.03
-9.49%
|
12/28/2020
|
$30.40
|
PP = $31.44
|
|
MB = $33.01
|
Most Recent Note - 2/24/2021 11:47:36 AM
Y - Color code is changed to yellow after rebounding above its 50 DMA line ($28.59) helping its outlook improve. Its Relative Strength Rating is 64, still well below the 80+ minimum guideline. Its prior low ($26.78) defines the next important near term support to watch.
>>> FEATURED STOCK ARTICLE : Pulling Back Quietly After Rebounding Near All-Time High - 2/17/2021 |
View all notes |
Set NEW NOTE alert |
Company Profile |
SEC
News |
Chart |
Request a new note
C
A
S
I |
ALRM
-
NASDAQ
Alarm.com Holdings Inc
Security/Sfty
|
$88.74
|
-4.13
-4.45% |
$94.20
|
597,447
131.31% of 50 DAV
50 DAV is 455,000
|
$108.67
-18.34%
|
2/9/2021
|
$71.88
|
PP = $108.67
|
|
MB = $114.10
|
Most Recent Note - 2/25/2021 5:24:14 PM
Slumped further below its 50 DMA line ($98) with heavier volume behind today's damaging 4th consecutive loss. Reported Dec '20 quarterly earnings +5% on +18% sales revenues versus the year ago period, below the +25% minimum earnings guideline (C criteria) raising fundamental concerns. It will be dropped from the Featured Stocks list tonight.
>>> FEATURED STOCK ARTICLE : Perched Near Prior High After Finding Support at 10 WMA - 2/11/2021 |
View all notes |
Set NEW NOTE alert |
Company Profile |
SEC
News |
Chart |
Request a new note
C
A
S
I |
TEAM
-
NASDAQ
Atlassian Corp Plc
Comp Sftwr-Spec Enterprs
|
$232.40
|
-7.53
-3.14% |
$241.99
|
1,183,526
82.54% of 50 DAV
50 DAV is 1,433,800
|
$262.40
-11.43%
|
10/12/2020
|
$193.77
|
PP = $199.60
|
|
MB = $209.58
|
Most Recent Note - 2/25/2021 5:36:36 PM
G - Violated its 50 DMA line ($238) with today's big loss on below average volume. The recent low ($208.62 on 1/27/21) defines the next important near-term support to watch. Its current Relative Strength Rating is 61, below the +80 minimum guideline for buy candidates. Fundamental concerns remain after earnings rose +0% on +23% sales revenues for the Dec '20 quarter versus the year ago period, its 2nd comparison below the +25% minimum earnings guideline (C criteria).
>>> FEATURED STOCK ARTICLE : Quietly Touched a New High Despite Fundamental Concerns Noted - 2/8/2021 |
View all notes |
Set NEW NOTE alert |
Company Profile |
SEC
News |
Chart |
Request a new note
C
A
S
I |
SHOP
-
NYSE
Shopify Inc Cl A
Computer Sftwr-Enterprse
|
$1,245.10
|
-56.05
-4.31% |
$1,321.19
|
1,847,311
134.06% of 50 DAV
50 DAV is 1,378,000
|
$1,499.75
-16.98%
|
2/2/2021
|
$1,218.72
|
PP = $1,285.28
|
|
MB = $1,349.54
|
Most Recent Note - 2/25/2021 5:32:59 PM
G - Down considerably today undercutting the prior high ($1,285 on 12/22/20) raising concerns. Retesting important support near its 50 DMA line ($1,228) where more damaging losses would raise serious concerns. Reported Dec '20 quarterly earnings +267% on +94% sales revenues versus the year ago period.
>>> FEATURED STOCK ARTICLE : Perched Within Striking Distance of New Pivot Point - 2/3/2021 |
View all notes |
Set NEW NOTE alert |
Company Profile |
SEC
News |
Chart |
Request a new note
C
A
S
I |
YETI
-
NYSE
Yeti Holdings Inc
Leisure-Products
|
$67.42
|
-3.25
-4.60% |
$71.91
|
1,390,433
93.88% of 50 DAV
50 DAV is 1,481,000
|
$80.89
-16.65%
|
2/19/2021
|
$74.99
|
PP = $80.99
|
|
MB = $85.04
|
Most Recent Note - 2/25/2021 5:35:00 PM
G - Sank below its 50 DMA line ($71.59) with today's big loss on average volume raising concerns and its color code is changed to green. Prior low ($64.80) on 2/01/21) defines important near term support where a violation may trigger a more worrisome technical sell signal. Fundamentals remain strong.
>>> FEATURED STOCK ARTICLE : Rebounded Just Above 50-Day Moving Average Line - 2/18/2021 |
View all notes |
Set NEW NOTE alert |
Company Profile |
SEC
News |
Chart |
Request a new note
C
A
S
I |
Symbol/Exchange
Company Name
Industry Group |
PRICE |
CHANGE
(%Change) |
Day High |
Volume
(% DAV)
(% 50 day avg vol) |
52 Wk Hi
% From Hi |
Featured
Date |
Price
Featured |
Pivot Featured |
|
Max Buy |
DOCU
-
NASDAQ
Docusign Inc
Computer Sftwr-Enterprse
|
$225.73
|
-13.93
-5.81% |
$242.49
|
4,539,034
156.20% of 50 DAV
50 DAV is 2,906,000
|
$290.23
-22.22%
|
1/12/2021
|
$253.50
|
PP = $256.10
|
|
MB = $268.91
|
Most Recent Note - 2/25/2021 5:28:56 PM
G - Color code is changed to green after it suffered a big volume-driven loss today. Slumped well below its 50 DMA line ($243) again raising greater concerns and triggering a technical sell signal. Fundamentals remain strong.
>>> FEATURED STOCK ARTICLE : Consolidating Back Above 50-Day Moving Average Near Prior High - 2/9/2021 |
View all notes |
Set NEW NOTE alert |
Company Profile |
SEC
News |
Chart |
Request a new note
C
A
S
I |
XPEL
-
NASDAQ
Xpel Inc
Auto/Truck-Tires andamp; Misc
|
$46.17
|
-0.23
-0.50% |
$47.00
|
558,909
207.77% of 50 DAV
50 DAV is 269,000
|
$60.77
-24.03%
|
2/22/2021
|
$59.00
|
PP = $60.87
|
|
MB = $63.91
|
Most Recent Note - 2/25/2021 5:40:04 PM
Suffered a 3rd consecutive damaging volume-driven loss today after violating its 50 DMA line triggering a technical sell signal. Disciplined investors will note that it did not trigger a technical buy signal after featured in the 2/22/21 mid-day report. It will be dropped from the Featured Stocks list tonight.
>>> FEATURED STOCK ARTICLE : Damaging Loss Indicative of Distributional Pressure - 2/23/2021 |
View all notes |
Set NEW NOTE alert |
Company Profile |
SEC
News |
Chart |
Request a new note
C
A
S
I |
DT
-
NYSE
Dynatrace Inc
Computer Sftwr-Enterprse
|
$50.06
|
-1.80
-3.47% |
$51.98
|
5,781,713
239.21% of 50 DAV
50 DAV is 2,417,000
|
$56.77
-11.82%
|
2/4/2021
|
$51.39
|
PP = $48.95
|
|
MB = $51.40
|
Most Recent Note - 2/25/2021 5:59:25 PM
G - Pulled back further with above average volume behind today's loss. Its Relative Strength Rating has slumped to 69, below the 80+ minimum guideline for buy candidates. Prior highs in the $48 area define initial support to watch above its 50 DMA line ($46). Fundamentals remain strong after it reported Dec '20 earnings +70% on +28% sales revenues versus the year ago period.
>>> FEATURED STOCK ARTICLE : Breakout Action Returns Dynatrace to Featured Stocks List - 2/4/2021 |
View all notes |
Set NEW NOTE alert |
Company Profile |
SEC
News |
Chart |
Request a new note
C
A
S
I |
MRBK
-
NASDAQ
Meridian Corp
Banks-Northeast
|
$25.97
|
+0.20
0.78% |
$26.83
|
50,104
185.57% of 50 DAV
50 DAV is 27,000
|
$26.94
-3.60%
|
2/22/2021
|
$25.58
|
PP = $26.10
|
|
MB = $27.41
|
Most Recent Note - 2/24/2021 5:32:58 PM
Y - Posted a solid gain today with +95% above average volume for a best ever close. Pivot point cited was based on its 12/18/21 high plus 10 cents. Subsequent gains and a strong close above its pivot point backed by at least +40% above average volume may help clinch a convincing technical buy signal. The past 3 quarterly comparisons through Dec '20 had earnings increases well above the +25% minimum guideline (C criteria). Annual earnings growth has been good since it Nov '17 IPO at $17. See the latest FSU analysis for more details and an annotated graph.
>>> FEATURED STOCK ARTICLE : Negative Reversal When Poised to Convincingly Breakout - 2/22/2021 |
View all notes |
Set NEW NOTE alert |
Company Profile |
SEC
News |
Chart |
Request a new note
C
A
S
I |
AXON
-
NASDAQ
Axon Enterprise Inc
Security/Sfty
|
$159.90
|
-1.55
-0.96% |
$168.74
|
564,453
80.18% of 50 DAV
50 DAV is 704,000
|
$212.37
-24.71%
|
12/22/2020
|
$127.84
|
PP = $130.51
|
|
MB = $137.04
|
Most Recent Note - 2/24/2021 5:24:08 PM
G - Suffered a 3rd consecutive loss today on higher volume, slumping toward its 50 DMA line ($151.85). Due to report Dec '20 quarterly results after the market closes on Thursday, February 25, 2021. Volume and volatility often increase near earnings news. Formerly traded under the ticker symbol AAXN where prior notes and detailed analysis may be reviewed.
>>> FEATURED STOCK ARTICLE : Extended From Prior Base Following Streak fo Volume-Driven Gains - 2/2/2021 |
View all notes |
Set NEW NOTE alert |
Company Profile |
SEC
News |
Chart |
Request a new note
C
A
S
I |
Symbol/Exchange
Company Name
Industry Group |
PRICE |
CHANGE
(%Change) |
Day High |
Volume
(% DAV)
(% 50 day avg vol) |
52 Wk Hi
% From Hi |
Featured
Date |
Price
Featured |
Pivot Featured |
|
Max Buy |
|
|
|
THESE ARE NOT BUY RECOMMENDATIONS!
Comments contained in the body of this report are technical
opinions only. The material herein has been obtained
from sources believed to be reliable and accurate, however,
its accuracy and completeness cannot be guaranteed.
This site is not an investment advisor, hence it does
not endorse or recommend any securities or other investments.
Any recommendation contained in this report may not
be suitable for all investors and it is not to be deemed
an offer or solicitation on our part with respect to
the purchase or sale of any securities. All trademarks,
service marks and trade names appearing in this report
are the property of their respective owners, and are
likewise used for identification purposes only.
This report is a service available
only to active Paid Premium Members.
You may opt-out of receiving report notifications
at any time. Questions or comments may be submitted
by writing to Premium Membership Services 665 S.E. 10 Street, Suite 201 Deerfield Beach, FL 33441-5634 or by calling 1-800-965-8307
or 954-785-1121.
|
|
|