You are not logged in.
This means you
CAN ONLY VIEW reports that were published prior to Wednesday, April 9, 2025.
You
MUST UPGRADE YOUR MEMBERSHIP if you want to see any current reports.
AFTER MARKET UPDATE - FRIDAY, FEBRUARY 26TH, 2021
Previous After Market Report Next After Market Report >>>
|
|
|
|
DOW |
-469.64 |
30,932.37 |
-1.50% |
|
Volume |
1,662,437,173 |
+34% |
|
Volume |
5,891,323,800 |
-7% |
|
NASDAQ |
+72.91 |
13,192.35 |
+0.56% |
|
Advancers |
1,355 |
43% |
|
Advancers |
1,337 |
34% |
|
S&P 500 |
-18.19 |
3,811.15 |
-0.48% |
|
Decliners |
1,813 |
57% |
|
Decliners |
2,544 |
66% |
|
Russell 2000 |
+0.88 |
2,201.05 |
+0.04% |
|
52 Wk Highs |
57 |
|
|
52 Wk Highs |
63 |
|
|
S&P 600 |
-5.17 |
1,278.56 |
-0.40% |
|
52 Wk Lows |
65 |
|
|
52 Wk Lows |
132 |
|
|
 |
Pressure Remains With Breadth Negative as Leadership Wanes
Kenneth J. Gruneisen - Passed the CAN SLIM® Master's Exam
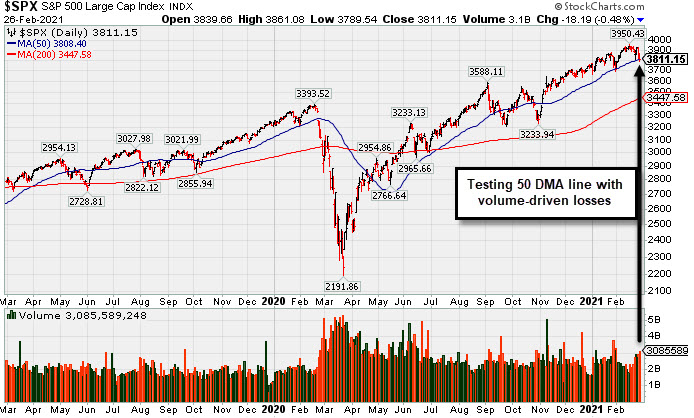
The Dow shed 469 points, extending its weekly decline to 1.8%. The S&P 500 erased afternoon gains to end 0.5% lower, closing the week with a 2.5% drop. The Nasdaq Composite rebounded 0.6%, still ending its worst week since October, down 4.9%. All three major averages advanced in February, with the Dow rallying 3.2%, the S&P 500 gaining 2.6%, and the Nasdaq Composite rising 0.9%. The volume totals were mixed, higher than the prior session on the NYSE and lighter on the Nasdaq exchange. Breadth was negative as decliners led advancers by a 9-7 margin on the NYSE and 5-3 on the Nasdaq exchange. There were 20 high-ranked companies from the Leaders List that hit new 52-week highs and were listed on the BreakOuts Page, down abruptly from the total of 85 on the prior session. New 52-week lows outnumbered shrinking new 52-week highs totals on both exchanges. The major indices' uptrend (M criteria) has clearly come under pressure. It remains very important for healthy leadership to continue, for any rally can only be sustained if it is supported by many stocks hitting new highs. Investors are reminded to always make buying and selling decisions based based on the strict criteria and rules of the fact-based investment system. PICTURED: The S&P 500 Index violated tested its 50-day moving average (DMA) line with another volume-driven loss.
U.S. stocks finished mixed on Friday, ending a volatile week that capped a largely upbeat month. Tech shares stabilized on the heels of Thursday’s steep sell-off in both the bond and equity markets.
Treasuries strengthened on Friday, with the yield on the 10-year note down 12 basis points 1.40%. The benchmark yield still notched its largest monthly increase since November 2016, having climbed nearly 50 basis points year-to-date. On the data front, personal income surged 10% in January, while personal spending rose by the most in seven months, up 2.4%. Separately, the core PCE deflator (the Fed's preferred proxy of inflation) increased 1.5% year-over-year last month, helping ease price pressure worries. Additionally, the final reading of the University of Michigan’s measure of consumer sentiment improved slightly in February.
Eight of 11 S&P 500 sectors closed lower, with Energy shares (the best performing sector of February) leading laggards. The Technology group outperformed, recouping 0.6%. In earnings, Salesforce.com (CRM -6.31%) fell on the heels of disappointing forward guidance. In other corporate news, shares of Beyond Meat (BYND +1.20%) rose after the company struck an agreement to supply its plant-based products to both McDonald’s (MCD -2.28%) and Taco Bell parent Yum! Brands (YUM -1.12%) . |
 Kenneth J. Gruneisen started out as a licensed stockbroker in August 1987, a couple of months prior to the historic stock market crash that took the Dow Jones Industrial Average down -22.6% in a single day. He has published daily fact-based fundamental and technical analysis on high-ranked stocks online for two decades. Through FACTBASEDINVESTING.COM, Kenneth provides educational articles, news, market commentary, and other information regarding proven investment systems that work in good times and bad.
Comments contained in the body of this report are technical opinions only and are not necessarily those of Gruneisen Growth Corp. The material herein has been obtained from sources believed to be reliable and accurate, however, its accuracy and completeness cannot be guaranteed. Our firm, employees, and customers may effect transactions, including transactions contrary to any recommendation herein, or have positions in the securities mentioned herein or options with respect thereto. Any recommendation contained in this report may not be suitable for all investors and it is not to be deemed an offer or solicitation on our part with respect to the purchase or sale of any securities. |
|
 |
Commodity-Linked Groups and Financials Led Decliners
Kenneth J. Gruneisen - Passed the CAN SLIM® Master's Exam
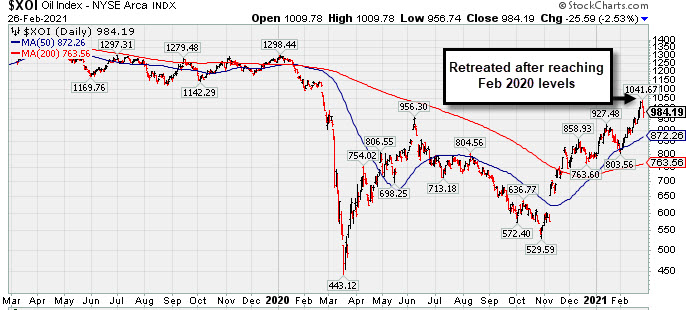
The Broker/Dealer Index ($XBD -1.66%) and Bank Index ($BKX -2.72%) both created a drag on the major averages while the Retail Index ($RLX +0.89%) helped partially offset other weakness. The Semiconductor Index ($SOX +2.28%) posted a solid gain, repairing part of the prior session's loss, meanwhile, the Networking Index ($NWX -0.36%) and Biotech Index ($BTK -0.20%) both edged lower. Commodity-linked groups were standout decliners as the Gold & Silver Index ($XAU -4.79%) outpaced the Oil Services Index ($OSX -1.52%) and Integrated Oil Index ($XOI -2.53%) to the downside. PICTURED: The Integrated Oil Index ($XOI -2.53%) retreated after reaching Feb 2020 levels.
| Oil Services |
$OSX |
55.78 |
-0.86 |
-1.52% |
+25.83% |
| Integrated Oil |
$XOI |
984.19 |
-25.59 |
-2.53% |
+24.19% |
| Semiconductor |
$SOX |
3,067.62 |
+68.46 |
+2.28% |
+9.73% |
| Networking |
$NWX |
774.07 |
-2.79 |
-0.36% |
+7.94% |
| Broker/Dealer |
$XBD |
429.58 |
-7.24 |
-1.66% |
+13.77% |
| Retail |
$RLX |
3,480.38 |
+30.60 |
+0.89% |
-2.33% |
| Gold & Silver |
$XAU |
130.79 |
-6.58 |
-4.79% |
-9.30% |
| Bank |
$BKX |
113.40 |
-3.17 |
-2.72% |
+15.82% |
| Biotech |
$BTK |
5,744.01 |
-11.36 |
-0.20% |
+0.09% |
|
|
|
 |
Slumping Toward 50-Day Average Following Great Rally
Kenneth J. Gruneisen - Passed the CAN SLIM® Master's Exam
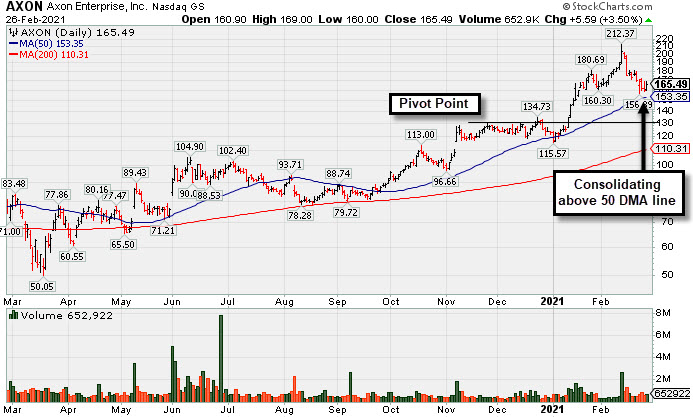
Axon Enterprise Inc (AXON +$5.59 or +3.50% to $165.49) posted a gain today breaking a streak of 4 consecutive losses while slumping toward its 50-day moving average DMA line ($153.35). It reported Dec '20 quarterly earnings +144% on +32% sales revenues versus the year ago period. Fundamentals remain strong. Five of the past 6 quarterly comparisons versus the year ago periods showed earnings increases above the +25% minimum guideline (C criteria) with strong underlying sales revenues increases. Its annual earnings (A criteria) history has also been strong, helping it get an 98 Earnings Per Share Rating.
The company has a small supply of only 63.5 million shares outstanding (S criteria) which can contribute to greater price volatility in the event of institutional buying or selling. The number of top-rated funds owning its shares rose from 400 in Sep '19 to 579 in Dec '20, a reassuring sign concerning the I criteria. AXON has a Timeliness Rating of B and an Accumulation/Distribution Rating of B. The Security/Safety industry group currently has a Group Relative Strength Rating of B+ (70). AXON completed a new Pubic Offering on 6/17/20. Such offerings often hinder price progress temporarily, yet they help companies attract greater institutional ownership interest (I criteria). |
|
|
Color Codes Explained :
Y - Better candidates highlighted by our
staff of experts.
G - Previously featured
in past reports as yellow but may no longer be buyable under the
guidelines.
***Last / Change / Volume data in this table is the closing quote data***
Symbol/Exchange
Company Name
Industry Group |
PRICE |
CHANGE
(%Change) |
Day High |
Volume
(% DAV)
(% 50 day avg vol) |
52 Wk Hi
% From Hi |
Featured
Date |
Price
Featured |
Pivot Featured |
|
Max Buy |
 CRL
-
NYSE
CRL
-
NYSE
Charles River Labs Intl
DRUGS - Biotechnology
|
$286.14
|
+5.96
2.13% |
$288.12
|
336,401
103.51% of 50 DAV
50 DAV is 325,000
|
$303.79
-5.81%
|
12/17/2020
|
$247.06
|
PP = $257.98
|
|
MB = $270.88
|
Most Recent Note - 2/25/2021 6:00:28 PM
G - Pulled back today with below average volume. Slumping since it reported Dec '20 quarterly earnings +19% on +14% sales revenues versus the year ago period, below the +25% minimum earnings guideline (C criteria).
>>> FEATURED STOCK ARTICLE : Testing Important Support on Pullback - 1/29/2021 |
View all notes |
Set NEW NOTE alert |
Company Profile |
SEC
News |
Chart |
Request a new note
C
A
S
I |
OPY
-
NYSE
Oppenheimer Holdings Inc
FINANCIAL SERVICES - Investment Brokerage - Regiona
|
$37.90
|
-0.39
-1.02% |
$38.48
|
134,371
111.05% of 50 DAV
50 DAV is 121,000
|
$39.65
-4.41%
|
2/25/2021
|
$38.95
|
PP = $38.11
|
|
MB = $40.02
|
Most Recent Note - 2/25/2021 5:21:13 PM
Y - Finished near the session low today after highlighted in yellow with pivot point cited based on its 2/05/21 high plus 10 cents in the earlier mid-day report. Powered to new multi-year highs with volume-driven gains after an advanced "3-weeks tight" base. Stubbornly held its ground since last noted in the 2/05/21 mid-day report - "Reported Dec '20 quarterly earnings +235% on +43% sales revenues versus the year ago period. Showed strong earnings increases over the year ago period in the past 3 quarterly comparisons. Annual earnings (A criteria) growth has been strong after a downturn and losses in FY '15 & '16." See the latest FSU analysis for more details and a new annotated graph.
>>> FEATURED STOCK ARTICLE : Rose From "3-weeks Tight" Base But Ended Near Session Low - 2/25/2021 |
View all notes |
Set NEW NOTE alert |
Company Profile |
SEC
News |
Chart |
Request a new note
C
A
S
I |
CLFD
-
NASDAQ
Clearfield Inc
TELECOMMUNICATIONS - Cables / Satalite Equipment
|
$32.41
|
-0.15
-0.46% |
$33.21
|
107,783
66.95% of 50 DAV
50 DAV is 161,000
|
$38.75
-16.36%
|
1/20/2021
|
$31.38
|
PP = $28.42
|
|
MB = $29.84
|
 Most Recent Note - 2/26/2021 7:01:28 PM
G - It is very extended from any sound base and slumping toward its 50 DMA line ($30.13) which defines important near-term support to watch above its prior highs in the $28 area. Reported Dec '20 quarterly earnings +475% on +40% sales revenues versus the year ago period, continuing its strong earning track record. See the latest FSU analysis for more details and an annotated graph.
>>> FEATURED STOCK ARTICLE : Consolidating Well Above 50-Day Moving Average Line - 2/24/2021 |
View all notes |
Set NEW NOTE alert |
Company Profile |
SEC
News |
Chart |
Request a new note
C
A
S
I |
SMPL
-
NASDAQ
Simply Good Foods Co
Food-Confectionery
|
$29.17
|
+0.18
0.62% |
$29.67
|
761,708
67.05% of 50 DAV
50 DAV is 1,136,000
|
$32.03
-8.93%
|
12/28/2020
|
$30.40
|
PP = $31.44
|
|
MB = $33.01
|
Most Recent Note - 2/26/2021 7:02:43 PM
Y - Consolidating above its 50 DMA line ($28.74) which has been acting as support. Its Relative Strength Rating is 72, still below the 80+ minimum guideline. Its prior low ($26.78) defines the next important near term support to watch.
>>> FEATURED STOCK ARTICLE : Pulling Back Quietly After Rebounding Near All-Time High - 2/17/2021 |
View all notes |
Set NEW NOTE alert |
Company Profile |
SEC
News |
Chart |
Request a new note
C
A
S
I |
TEAM
-
NASDAQ
Atlassian Corp Plc
Comp Sftwr-Spec Enterprs
|
$237.70
|
+5.30
2.28% |
$239.70
|
1,306,621
91.21% of 50 DAV
50 DAV is 1,432,500
|
$262.40
-9.41%
|
10/12/2020
|
$193.77
|
PP = $199.60
|
|
MB = $209.58
|
Most Recent Note - 2/25/2021 5:36:36 PM
G - Violated its 50 DMA line ($238) with today's big loss on below average volume. The recent low ($208.62 on 1/27/21) defines the next important near-term support to watch. Its current Relative Strength Rating is 61, below the +80 minimum guideline for buy candidates. Fundamental concerns remain after earnings rose +0% on +23% sales revenues for the Dec '20 quarter versus the year ago period, its 2nd comparison below the +25% minimum earnings guideline (C criteria).
>>> FEATURED STOCK ARTICLE : Quietly Touched a New High Despite Fundamental Concerns Noted - 2/8/2021 |
View all notes |
Set NEW NOTE alert |
Company Profile |
SEC
News |
Chart |
Request a new note
C
A
S
I |
Symbol/Exchange
Company Name
Industry Group |
PRICE |
CHANGE
(%Change) |
Day High |
Volume
(% DAV)
(% 50 day avg vol) |
52 Wk Hi
% From Hi |
Featured
Date |
Price
Featured |
Pivot Featured |
|
Max Buy |
SHOP
-
NYSE
Shopify Inc Cl A
Computer Sftwr-Enterprse
|
$1,280.97
|
+35.87
2.88% |
$1,298.00
|
1,321,904
94.35% of 50 DAV
50 DAV is 1,401,000
|
$1,499.75
-14.59%
|
2/2/2021
|
$1,218.72
|
PP = $1,285.28
|
|
MB = $1,349.54
|
Most Recent Note - 2/25/2021 5:32:59 PM
G - Down considerably today undercutting the prior high ($1,285 on 12/22/20) raising concerns. Retesting important support near its 50 DMA line ($1,228) where more damaging losses would raise serious concerns. Reported Dec '20 quarterly earnings +267% on +94% sales revenues versus the year ago period.
>>> FEATURED STOCK ARTICLE : Perched Within Striking Distance of New Pivot Point - 2/3/2021 |
View all notes |
Set NEW NOTE alert |
Company Profile |
SEC
News |
Chart |
Request a new note
C
A
S
I |
YETI
-
NYSE
Yeti Holdings Inc
Leisure-Products
|
$68.77
|
+1.35
2.00% |
$69.53
|
1,351,695
91.58% of 50 DAV
50 DAV is 1,476,000
|
$80.89
-14.98%
|
2/19/2021
|
$74.99
|
PP = $80.99
|
|
MB = $85.04
|
Most Recent Note - 2/25/2021 5:35:00 PM
G - Sank below its 50 DMA line ($71.59) with today's big loss on average volume raising concerns and its color code is changed to green. Prior low ($64.80) on 2/01/21) defines important near term support where a violation may trigger a more worrisome technical sell signal. Fundamentals remain strong.
>>> FEATURED STOCK ARTICLE : Rebounded Just Above 50-Day Moving Average Line - 2/18/2021 |
View all notes |
Set NEW NOTE alert |
Company Profile |
SEC
News |
Chart |
Request a new note
C
A
S
I |
DOCU
-
NASDAQ
Docusign Inc
Computer Sftwr-Enterprse
|
$226.66
|
+0.93
0.41% |
$228.56
|
7,420,186
251.79% of 50 DAV
50 DAV is 2,947,000
|
$290.23
-21.90%
|
1/12/2021
|
$253.50
|
PP = $256.10
|
|
MB = $268.91
|
Most Recent Note - 2/25/2021 5:28:56 PM
G - Color code is changed to green after it suffered a big volume-driven loss today. Slumped well below its 50 DMA line ($243) again raising greater concerns and triggering a technical sell signal. Fundamentals remain strong.
>>> FEATURED STOCK ARTICLE : Consolidating Back Above 50-Day Moving Average Near Prior High - 2/9/2021 |
View all notes |
Set NEW NOTE alert |
Company Profile |
SEC
News |
Chart |
Request a new note
C
A
S
I |
DT
-
NYSE
Dynatrace Inc
Computer Sftwr-Enterprse
|
$49.76
|
-0.30
-0.60% |
$50.95
|
2,966,364
115.52% of 50 DAV
50 DAV is 2,567,900
|
$56.77
-12.35%
|
2/4/2021
|
$51.39
|
PP = $48.95
|
|
MB = $51.40
|
Most Recent Note - 2/25/2021 5:59:25 PM
G - Pulled back further with above average volume behind today's loss. Its Relative Strength Rating has slumped to 69, below the 80+ minimum guideline for buy candidates. Prior highs in the $48 area define initial support to watch above its 50 DMA line ($46). Fundamentals remain strong after it reported Dec '20 earnings +70% on +28% sales revenues versus the year ago period.
>>> FEATURED STOCK ARTICLE : Breakout Action Returns Dynatrace to Featured Stocks List - 2/4/2021 |
View all notes |
Set NEW NOTE alert |
Company Profile |
SEC
News |
Chart |
Request a new note
C
A
S
I |
MRBK
-
NASDAQ
Meridian Corp
Banks-Northeast
|
$24.44
|
-0.53
-2.12% |
$25.18
|
71,626
265.28% of 50 DAV
50 DAV is 27,000
|
$26.94
-9.28%
|
2/22/2021
|
$25.58
|
PP = $26.10
|
|
MB = $27.41
|
Most Recent Note - 2/26/2021 12:50:11 PM
Y - Gapped down today following a Special Dividend. Posted 3 consecutive gains with above average volume for new high closes. Pivot point cited was based on its 12/18/21 high plus 10 cents. Subsequent gains and a strong close above its pivot point backed by at least +40% above average volume may help clinch a convincing technical buy signal. Fundamentals are strong.
>>> FEATURED STOCK ARTICLE : Negative Reversal When Poised to Convincingly Breakout - 2/22/2021 |
View all notes |
Set NEW NOTE alert |
Company Profile |
SEC
News |
Chart |
Request a new note
C
A
S
I |
Symbol/Exchange
Company Name
Industry Group |
PRICE |
CHANGE
(%Change) |
Day High |
Volume
(% DAV)
(% 50 day avg vol) |
52 Wk Hi
% From Hi |
Featured
Date |
Price
Featured |
Pivot Featured |
|
Max Buy |
AXON
-
NASDAQ
Axon Enterprise Inc
Security/Sfty
|
$165.49
|
+5.59
3.50% |
$169.00
|
652,922
92.48% of 50 DAV
50 DAV is 706,000
|
$212.37
-22.07%
|
12/22/2020
|
$127.84
|
PP = $130.51
|
|
MB = $137.04
|
Most Recent Note - 2/26/2021 6:58:41 PM
G - Posted a gain today breaking a streak of 4 consecutive losses while slumping toward its 50 DMA line ($153.35). Reported strong Dec '20 quarterly results. See the the latest FSU analysis for more details and a new annotated graph.
>>> FEATURED STOCK ARTICLE : Slumping Toward 50-Day Average Following Great Rally - 2/26/2021 |
View all notes |
Set NEW NOTE alert |
Company Profile |
SEC
News |
Chart |
Request a new note
C
A
S
I |
|
|
|
THESE ARE NOT BUY RECOMMENDATIONS!
Comments contained in the body of this report are technical
opinions only. The material herein has been obtained
from sources believed to be reliable and accurate, however,
its accuracy and completeness cannot be guaranteed.
This site is not an investment advisor, hence it does
not endorse or recommend any securities or other investments.
Any recommendation contained in this report may not
be suitable for all investors and it is not to be deemed
an offer or solicitation on our part with respect to
the purchase or sale of any securities. All trademarks,
service marks and trade names appearing in this report
are the property of their respective owners, and are
likewise used for identification purposes only.
This report is a service available
only to active Paid Premium Members.
You may opt-out of receiving report notifications
at any time. Questions or comments may be submitted
by writing to Premium Membership Services 665 S.E. 10 Street, Suite 201 Deerfield Beach, FL 33441-5634 or by calling 1-800-965-8307
or 954-785-1121.
|
|
|