You are not logged in.
This means you
CAN ONLY VIEW reports that were published prior to Wednesday, April 9, 2025.
You
MUST UPGRADE YOUR MEMBERSHIP if you want to see any current reports.
AFTER MARKET UPDATE - FRIDAY, FEBRUARY 24TH, 2023
Previous After Market Report Next After Market Report >>>
|
|
|
|
DOW |
-336.99 |
32,816.92 |
-1.02% |
|
Volume |
860,235,558 |
+1% |
|
Volume |
4,421,597,100 |
-5% |
|
NASDAQ |
-195.46 |
11,394.94 |
-1.69% |
|
Advancers |
821 |
28% |
|
Advancers |
1,147 |
25% |
|
S&P 500 |
-42.28 |
3,970.04 |
-1.05% |
|
Decliners |
2,088 |
72% |
|
Decliners |
3,363 |
75% |
|
Russell 2000 |
-17.61 |
1,890.49 |
-0.92% |
|
52 Wk Highs |
44 |
|
|
52 Wk Highs |
60 |
|
|
S&P 600 |
-9.40 |
1,247.72 |
-0.75% |
|
52 Wk Lows |
47 |
|
|
52 Wk Lows |
171 |
|
|
 |
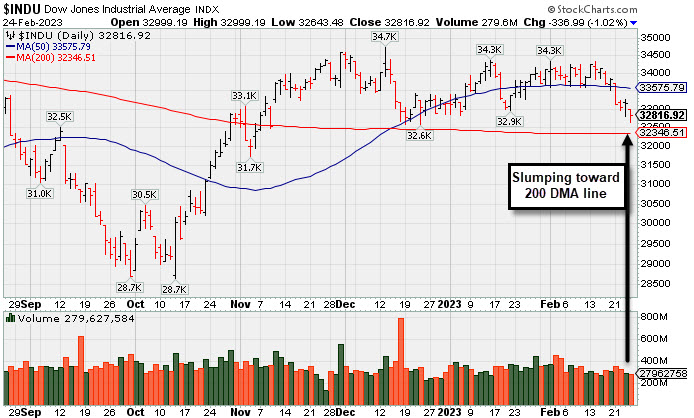
Losses for Major Averages Came With Less Leadership
Kenneth J. Gruneisen - Passed the CAN SLIM® Master's Exam
The Dow lost 336 points and shed 3% for the week, while the Nasdaq Composite lost 1.7% and notched a 3.3% weekly decline. The S&P 500 declined 1.1% and fell 2.7% for the week. Volume totals were mixed, higher than the prior session on the NYSE and lighter on the Nasdaq exchange. Decliners led advancers by more than a 2-1 margin on the NYSE and by almost a 3-1 margin on the Nasdaq exchange. There were 11 high-ranked companies from the Leaders List that hit new 52-week highs and were listed on the BreakOuts Page, versus 18 on the prior session. New 52-week lows totals outnumbered new 52-week highs on the NYSE and on the Nasdaq exchange. The major indices are in an uptrend under pressure (M criteria), raising a caution flag for investors. For any rally to be sustained there must be healthy leadership. It will be important to watch for improvement in the new highs totals in the immediate days ahead. Stay tuned!
PICTURED: The Dow Jones Industrial Average has been slumping toward its 200-day moving average line.
U.S. equities finished lower Friday as investors digested hotter-than-forecasted inflation data. The Personal Consumption Expenditures (PCE) Deflator, which is the Federal Reserve’s (Fed) preferred proxy for inflation, rose 0.6% month-over-month (mom) in January, up from December’s revised 0.2% monthly gain, while the annualized figure unexpectedly accelerated to 5.4%. The Core PCE Deflator (which excludes food and energy prices) climbed 0.6% mom, while the annual figure unexpectedly rose to 4.7% year-over-year. Real personal spending, which is adjusted for inflation, rose 1.1% in January after falling 0.3% in December. The uptick in inflation data and resilience in consumer spending has heightened concerns the Fed may raise interest rates higher and maintain them for longer.
On the data front, pending home sales climbed 7.2% mom in January. Meanwhile, the University of Michigan Consumer Sentiment Index was upwardly revised to 67 in February, while the short-term inflation expectations component eased to 4.1% from 4.2%. The long-term inflation expectations component remained unchanged at 2.9%. Treasuries weakened, with the yield on the 10-year note up seven basis points (0.07%) to 3.95%, while the 30-year bond yield climbed five basis points (0.05%) to 3.93%. The yield on the more policy-sensitive two-year note advanced 11 basis points (0.11%) to 4.81%, its highest since 2007. In commodities, West Texas Intermediate (WTI) crude climbed 1.6% to $76.61/barrel amid reports Russia is curtailing its exports to Western countries.
|
 Kenneth J. Gruneisen started out as a licensed stockbroker in August 1987, a couple of months prior to the historic stock market crash that took the Dow Jones Industrial Average down -22.6% in a single day. He has published daily fact-based fundamental and technical analysis on high-ranked stocks online for two decades. Through FACTBASEDINVESTING.COM, Kenneth provides educational articles, news, market commentary, and other information regarding proven investment systems that work in good times and bad.
Comments contained in the body of this report are technical opinions only and are not necessarily those of Gruneisen Growth Corp. The material herein has been obtained from sources believed to be reliable and accurate, however, its accuracy and completeness cannot be guaranteed. Our firm, employees, and customers may effect transactions, including transactions contrary to any recommendation herein, or have positions in the securities mentioned herein or options with respect thereto. Any recommendation contained in this report may not be suitable for all investors and it is not to be deemed an offer or solicitation on our part with respect to the purchase or sale of any securities. |
|
 |
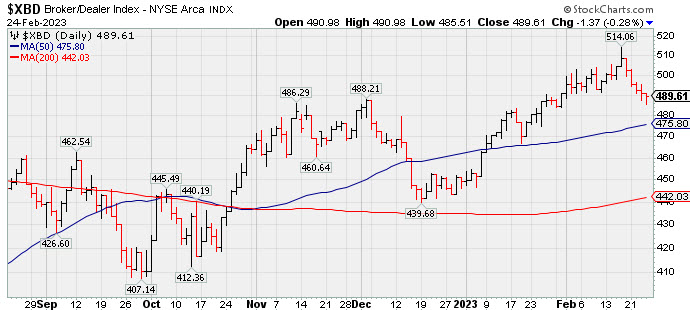
Tech Sector and Retail Index Led Declining Groups Lower
Kenneth J. Gruneisen - Passed the CAN SLIM® Master's Exam
The Retail Index ($RLX -1.47%) created a drag on the major averages while the financials were mixed, the Bank Index ($BKX +0.20%) edging higher and the Broker/Dealer Index ($XBD -0.28%) edging lower. The tech sector had a negative bias as the Semiconductor Index ($SOX -1.80%), Networking Index ($NWX -2.51%), and Biotech Index ($BTK -1.66%) each lost ground. Commodity-linked groups were mixed as the Oil Services Index ($OSX +1.54%) posted a solid gain and the Integrated Oil Index ($XOI +0.14%) inched higher, meanwhile the Gold & Silver Index ($XAU -0.92%) lost ground.
PICTURED: The Broker/Dealer Index ($XBD -0.28%) pulled back for a 5th consecutiev small loss, slumping back toward the prior high and its 50-day moving average (DMA) line.
| Oil Services |
$OSX |
86.85 |
+1.32 |
+1.54% |
+3.56% |
| Integrated Oil |
$XOI |
1,756.53 |
+2.43 |
+0.14% |
-1.72% |
| Semiconductor |
$SOX |
2,935.11 |
-53.69 |
-1.80% |
+15.92% |
| Networking |
$NWX |
806.86 |
-20.77 |
-2.51% |
+3.01% |
| Broker/Dealer |
$XBD |
489.61 |
-1.37 |
-0.28% |
+9.01% |
| Retail |
$RLX |
2,871.30 |
-42.87 |
-1.47% |
+4.26% |
| Gold & Silver |
$XAU |
111.84 |
-1.04 |
-0.92% |
-7.47% |
| Bank |
$BKX |
109.07 |
+0.22 |
+0.20% |
+8.15% |
| Biotech |
$BTK |
5,223.35 |
-87.96 |
-1.66% |
-1.09% |
|
|
|
 |
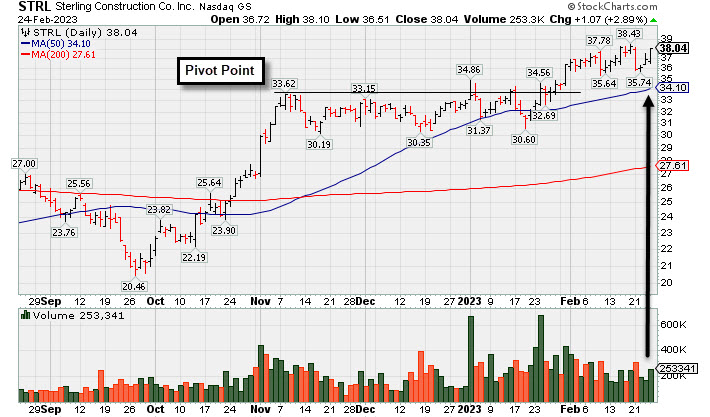
Sterling Perched Near High, Extended From Prior Base
Kenneth J. Gruneisen - Passed the CAN SLIM® Master's Exam
Sterling Infrastructure (STRL +$1.07 or +2.89% to $38.04) is perched near its all-time high, extended from the previously noted base. Prior highs in the $34-33 area and its 50-day moving average (DMA) line ($34.10) define important near-term support to watch.
STRL was highlighted in yellow with pivot point cited based on its 11/08/22 high plus 10 cents in the 12/14/22 mid-day report (read here). Confirming volume-driven gains for new highs were a reassuring sign of fresh institutional buying demand. STRL was last covered in detail on 1/26/23 with an annotated graph under the headline, "Gain With Average Volume While Perched Near Recent Highs".
STRL hails from the Building - Heavy Construction industry group which is currently ranked 62nd on the 197 Industry Groups list (L criteria). It has a 97 Earnings Per Share Rating. It reported Sep '22 quarterly earnings +35% on +20% sales revenues versus the year ago period, its 5th quarterly comparison at or above the +25% minimum earnings guideline (C criteria). Annual earnings (A criteria) growth has been strong and steady since FY '17.
The company has a small supply of only 30.3 million shares outstanding. That can lead to greater price volatility in the event of institutional buying or selling. The number of top rated funds owning its shares rose from 337 in Dec '21 to 352 in Dec '22. Its current Up/Down Volume Ratio of 1.6 is an unbiased indication its shares have been under accumulation over the past 50 days.
|
|
|
Color Codes Explained :
Y - Better candidates highlighted by our
staff of experts.
G - Previously featured
in past reports as yellow but may no longer be buyable under the
guidelines.
***Last / Change / Volume data in this table is the closing quote data***
Symbol/Exchange
Company Name
Industry Group |
PRICE |
CHANGE
(%Change) |
Day High |
Volume
(% DAV)
(% 50 day avg vol) |
52 Wk Hi
% From Hi |
Featured
Date |
Price
Featured |
Pivot Featured |
|
Max Buy |
 CMC
-
NYSE
CMC
-
NYSE
Commercial Metals Co
METALS and MINING - Steel and Iron
|
$52.13
|
-0.31
-0.59% |
$52.17
|
867,662
78.24% of 50 DAV
50 DAV is 1,109,000
|
$58.09
-10.26%
|
10/14/2022
|
$41.61
|
PP = $44.45
|
|
MB = $46.67
|
Most Recent Note - 2/23/2023 10:42:29 AM
G - Pulling back today testing its 50 DMA line ($52.56) which defines important near-term support to watch. Fundamentals remain strong.
>>> FEATURED STOCK ARTICLE : Metals Firm Extended From Base and Perched Near High - 2/6/2023 |
View all notes |
Set NEW NOTE alert |
Company Profile |
SEC
News |
Chart |
Request a new note
C
A
S
I |
GPK
-
NYSE
Graphic Packaging Hldg
CONSUMER NON-DURABLES - Packaging and Containers
|
$23.72
|
+0.16
0.68% |
$23.78
|
2,333,052
71.24% of 50 DAV
50 DAV is 3,275,000
|
$24.20
-1.98%
|
10/25/2022
|
$22.75
|
PP = $24.17
|
|
MB = $25.38
|
Most Recent Note - 2/23/2023 6:15:23 PM
Y - Posted a gain with average volume and closed only -2.6% off its all-time high. Showed resilience after briefly violating its 50 DMA line on 2/07/23. Members were reminded - "Disciplined investors know that gains above a stock's pivot point must be backed by at least +40% above average volume to trigger a proper technical buy signal."
>>> FEATURED STOCK ARTICLE : Graphic Packaging Perched Near Pivot Point - 1/27/2023 |
View all notes |
Set NEW NOTE alert |
Company Profile |
SEC
News |
Chart |
Request a new note
C
A
S
I |
GFF
-
NYSE
Griffon Corporation
MATERIALS and CONSTRUCTION - General Building Materials
|
$36.47
|
-0.65
-1.75% |
$36.96
|
400,423
77.00% of 50 DAV
50 DAV is 520,000
|
$43.74
-16.62%
|
11/10/2022
|
$34.13
|
PP = $35.02
|
|
MB = $36.77
|
Most Recent Note - 2/21/2023 10:02:18 AM
G - Pulling back near its "max buy" level and today's early loss was nearly testing its 50 DMA line ($38) which defines important support to watch. Reported Dec '22 quarterly earnings +121 on +10% sales revenues versus the year ago period.
>>> FEATURED STOCK ARTICLE : Extended From Any Sound Base and Still Hitting New Highs - 2/2/2023 |
View all notes |
Set NEW NOTE alert |
Company Profile |
SEC
News |
Chart |
Request a new note
C
A
S
I |
TITN
-
NASDAQ
Titan Machinery Inc
SPECIALTY RETAIL
|
$45.79
|
-0.23
-0.50% |
$46.54
|
172,911
80.80% of 50 DAV
50 DAV is 214,000
|
$46.62
-1.78%
|
1/13/2023
|
$40.10
|
PP = $44.45
|
|
MB = $46.67
|
Most Recent Note - 2/23/2023 10:46:04 AM
Y - Quietly challenging its all-time high with today's gain. Its 50 DMA line ($41.79) definies important near-term support to watch on pullbacks. It wedged into new high territory with gains lacking great volume conviction since a new pivot point was recently cited based on its 12/01/22 high plus 10 cents.
>>> FEATURED STOCK ARTICLE : 7th Consecutive Gain for Titan - 1/30/2023 |
View all notes |
Set NEW NOTE alert |
Company Profile |
SEC
News |
Chart |
Request a new note
C
A
S
I |
MYE
-
NYSE
Myers Industries Inc
Containers/Packaging
|
$24.62
|
+0.19
0.78% |
$24.64
|
118,365
75.88% of 50 DAV
50 DAV is 156,000
|
$25.55
-3.64%
|
12/8/2022
|
$23.94
|
PP = $25.65
|
|
MB = $26.93
|
Most Recent Note - 2/21/2023 10:06:16 AM
Y - Found prompt support near its 50 DMA line ($23.54) on recent pullbacks. It still faces very little resistance due to overhead supply up to the $25.50 level.
>>> FEATURED STOCK ARTICLE : Perched Near High After Finding Support at 50 DMA - 2/3/2023 |
View all notes |
Set NEW NOTE alert |
Company Profile |
SEC
News |
Chart |
Request a new note
C
A
S
I |
Symbol/Exchange
Company Name
Industry Group |
PRICE |
CHANGE
(%Change) |
Day High |
Volume
(% DAV)
(% 50 day avg vol) |
52 Wk Hi
% From Hi |
Featured
Date |
Price
Featured |
Pivot Featured |
|
Max Buy |
BOX
-
NYSE
Box Inc Cl A
Computer Sftwr-Database
|
$33.24
|
-0.44
-1.31% |
$33.60
|
920,572
65.24% of 50 DAV
50 DAV is 1,411,000
|
$34.98
-4.97%
|
2/2/2023
|
$34.68
|
PP = $33.14
|
|
MB = $34.80
|
Most Recent Note - 2/21/2023 9:57:17 AM
Y - Consolidating above prior highs and its 50 DMA line which coincide in the $32 area defining important near term support to watch.
>>> FEATURED STOCK ARTICLE : Perched Near High After Recent Breakout - 2/7/2023 |
View all notes |
Set NEW NOTE alert |
Company Profile |
SEC
News |
Chart |
Request a new note
C
A
S
I |
STRL
-
NASDAQ
Sterling Infrastructure
MATERIALS and; CONSTRUCTION - Heavy Construction
|
$38.04
|
+1.07
2.89% |
$38.10
|
253,091
98.86% of 50 DAV
50 DAV is 256,000
|
$38.43
-1.01%
|
12/14/2022
|
$32.41
|
PP = $33.72
|
|
MB = $35.41
|
 Most Recent Note - 2/24/2023 11:36:37 PM
G - Perched near its all-time high, extended from the previously noted base. Prior highs in the $34-33 area and its 50 DMA line ($34.10) define important near-term support to watch. See the latest FSU analysis for more details and a new annotated graph.
>>> FEATURED STOCK ARTICLE : Sterling Perched Near High, Extended From Prior Base - 2/24/2023 |
View all notes |
Set NEW NOTE alert |
Company Profile |
SEC
News |
Chart |
Request a new note
C
A
S
I |
PERI
-
NASDAQ
Perion Networks Ltd
Comml Svcs-Advertising
|
$33.46
|
-0.60
-1.76% |
$33.74
|
421,501
64.45% of 50 DAV
50 DAV is 654,000
|
$35.16
-4.84%
|
1/25/2023
|
$31.79
|
PP = $33.19
|
|
MB = $34.85
|
Most Recent Note - 2/22/2023 6:53:43 PM
Y - Hovering near its 52-week high stubbornly holding ground. Showed resilience after undercutting its pivot point. The next important suppport to watch is its 50 DMA line ($29.50). See the latest FSU analysis for more details and a new annotated graph.
>>> FEATURED STOCK ARTICLE : Perion Stubbornly Holding Ground Near High After Spurt of Gains - 2/22/2023 |
View all notes |
Set NEW NOTE alert |
Company Profile |
SEC
News |
Chart |
Request a new note
C
A
S
I |
ALGM
-
NASDAQ
Allegro Microsystems Inc
Elec-Semiconductor Mfg
|
$43.23
|
-0.56
-1.28% |
$43.54
|
884,446
53.73% of 50 DAV
50 DAV is 1,646,000
|
$45.99
-6.00%
|
1/31/2023
|
$37.80
|
PP = $38.38
|
|
MB = $40.30
|
Most Recent Note - 2/21/2023 9:55:27 AM
G - Holding its ground stubbornly after rising above its "max buy" level. Prior high in the $38 area defines initial support to watch on pullbacks.
>>> FEATURED STOCK ARTICLE : Big Volume-Driven Gain for Best-Ever Close - 1/31/2023 |
View all notes |
Set NEW NOTE alert |
Company Profile |
SEC
News |
Chart |
Request a new note
C
A
S
I |
WCC
-
NYSE
Wesco International Inc
WHOLESALE - Electronics Wholesale
|
$163.88
|
+1.16
0.71% |
$164.86
|
308,702
66.67% of 50 DAV
50 DAV is 463,000
|
$172.91
-5.22%
|
2/10/2023
|
$148.50
|
PP = $147.15
|
|
MB = $154.51
|
Most Recent Note - 2/21/2023 7:01:16 PM
G - Color code was changed to green after rallying above its "max buy" level. Prior highs in the $144-147 area define initial support to watch. Reported Dec '22 quarterly earnings +40% on +15% sales revenues versus the year ago period. See the latest FSU analysis for more details and a new annotated graph.
>>> FEATURED STOCK ARTICLE : Powered Higher After Recently Highlighted in Feb 10th Report - 2/21/2023 |
View all notes |
Set NEW NOTE alert |
Company Profile |
SEC
News |
Chart |
Request a new note
C
A
S
I |
Symbol/Exchange
Company Name
Industry Group |
PRICE |
CHANGE
(%Change) |
Day High |
Volume
(% DAV)
(% 50 day avg vol) |
52 Wk Hi
% From Hi |
Featured
Date |
Price
Featured |
Pivot Featured |
|
Max Buy |
FIX
-
NYSE
Comfort Systems U S A
MATERIALS and CONSTRUCTION - General Contractors
|
$146.81
|
+10.81
7.95% |
$146.86
|
688,166
352.91% of 50 DAV
50 DAV is 195,000
|
$140.05
4.83%
|
2/23/2023
|
$136.52
|
PP = $128.78
|
|
MB = $135.22
|
Most Recent Note - 2/24/2023 1:20:06 PM
G - Color code is changed to green after rallying above its "max buy" level, quickly getting extended from the recely noted base. Finished strong after highlighted in yellow in the 2/23/23 mid-day report with a pivot point cited based on its 11/23/22 high plus 10 cents. It broke out hitting a new 52-week high with volume +131% above average behind the gain, triggering a technical buy signal while rising from an orderly 3-month base. Bullish action came after it reported earnings +48% on +31% sales revenues for the Dec '22 quarter versus the year ago period, its 4th strong quarter above the +25% minimum guideline (C criteria). Annual earning history has been strong and steady.
>>> FEATURED STOCK ARTICLE : Powerful Technical Breakout After Earnings Report - 2/23/2023 |
View all notes |
Set NEW NOTE alert |
Company Profile |
SEC
News |
Chart |
Request a new note
C
A
S
I |
|
|
|
THESE ARE NOT BUY RECOMMENDATIONS!
Comments contained in the body of this report are technical
opinions only. The material herein has been obtained
from sources believed to be reliable and accurate, however,
its accuracy and completeness cannot be guaranteed.
This site is not an investment advisor, hence it does
not endorse or recommend any securities or other investments.
Any recommendation contained in this report may not
be suitable for all investors and it is not to be deemed
an offer or solicitation on our part with respect to
the purchase or sale of any securities. All trademarks,
service marks and trade names appearing in this report
are the property of their respective owners, and are
likewise used for identification purposes only.
This report is a service available
only to active Paid Premium Members.
You may opt-out of receiving report notifications
at any time. Questions or comments may be submitted
by writing to Premium Membership Services 665 S.E. 10 Street, Suite 201 Deerfield Beach, FL 33441-5634 or by calling 1-800-965-8307
or 954-785-1121.
|
|
|