You are not logged in.
This means you
CAN ONLY VIEW reports that were published prior to Wednesday, April 9, 2025.
You
MUST UPGRADE YOUR MEMBERSHIP if you want to see any current reports.
AFTER MARKET UPDATE - THURSDAY, FEBRUARY 23RD, 2023
Previous After Market Report Next After Market Report >>>
|
|
|
|
DOW |
+108.82 |
33,153.91 |
+0.33% |
|
Volume |
854,992,943 |
-7% |
|
Volume |
4,646,585,200 |
-0% |
|
NASDAQ |
+83.33 |
11,590.40 |
+0.72% |
|
Advancers |
1,969 |
67% |
|
Advancers |
2,517 |
57% |
|
S&P 500 |
+21.27 |
4,012.32 |
+0.53% |
|
Decliners |
987 |
33% |
|
Decliners |
1,934 |
43% |
|
Russell 2000 |
+13.42 |
1,908.09 |
+0.71% |
|
52 Wk Highs |
57 |
|
|
52 Wk Highs |
84 |
|
|
S&P 600 |
+8.46 |
1,257.12 |
+0.68% |
|
52 Wk Lows |
28 |
|
|
52 Wk Lows |
130 |
|
|
 |
Major Averages Rose With Lighter Volume Totals
Kenneth J. Gruneisen - Passed the CAN SLIM® Master's Exam
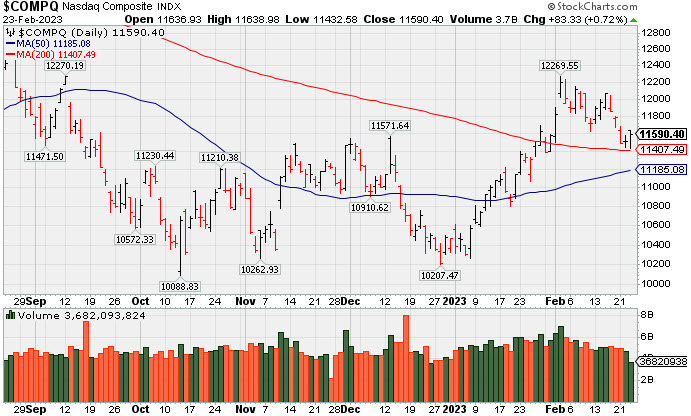
The Dow climbed 108 points, while the Nasdaq Composite added 0.7%. The S&P 500 snapped a four-day losing streak, advancing 0.5%. Seven of 11 sectors in the S&P 500 finished in positive territory. Volume totals were lighter than the prior session on the NYSE and on the Nasdaq exchange. Advancers led decliners by almost a 2-1 margin on the NYSE and by a 5-4 margin on the Nasdaq exchange. There were 18 high-ranked companies from the Leaders List that hit new 52-week highs and were listed on the BreakOuts Page, versus 9 on the prior session. New 52-week lows totals outnumbered new 52-week highs on the NYSE and on the Nasdaq exchange. The major indices are in an uptrend under pressure (M criteria). Disciplined investors still have a green light for making new buys only in stocks matching all key criteria of the fact-based investment system.
PICTURED: The Nasdaq Composite Index is consolidating above its 200-day moving average line.
U.S. equities finished higher Thursday in volatile trading as investors braced for tomorrow’s inflation data. The Personal Consumption Expenditures (PCE) index, which is the Federal Reserve’s (Fed) preferred proxy for inflation, is forecasted to show inflation accelerated on a monthly basis. Investors will parse through the report for any clues as to the future course of monetary policy.
On the data front, initial jobless claims for the week ended February 18 unexpectedly fell to 192,000, signaling the labor market remains tight despite the central bank’s efforts to soften it. Meanwhile, the second reading for fourth quarter Gross Domestic Product (GDP) unexpectedly ticked lower to an annualized 2.7% quarter-over-quarter, while the Personal Consumption component of the report was downwardly revised more than expected to 1.4% from 2.1%. Longer-dated Treasuries strengthened, with the yield on the benchmark 10-year note and the 30-bond yield both down four basis points (0.04%) to 3.88%. The yield on the two-year note, which is more sensitive to changes in Fed policy, increased one basis point (0.01%) to 4.70%. In commodities, West Texas Intermediate (WTI) crude climbed 2.1% to $75.52 /barrel despite reports of rising domestic crude inventories. This morning, the Energy Information Administration reported U.S. crude stockpiles climbed for the ninth-straight week, heightening concerns over demand. |
 Kenneth J. Gruneisen started out as a licensed stockbroker in August 1987, a couple of months prior to the historic stock market crash that took the Dow Jones Industrial Average down -22.6% in a single day. He has published daily fact-based fundamental and technical analysis on high-ranked stocks online for two decades. Through FACTBASEDINVESTING.COM, Kenneth provides educational articles, news, market commentary, and other information regarding proven investment systems that work in good times and bad.
Comments contained in the body of this report are technical opinions only and are not necessarily those of Gruneisen Growth Corp. The material herein has been obtained from sources believed to be reliable and accurate, however, its accuracy and completeness cannot be guaranteed. Our firm, employees, and customers may effect transactions, including transactions contrary to any recommendation herein, or have positions in the securities mentioned herein or options with respect thereto. Any recommendation contained in this report may not be suitable for all investors and it is not to be deemed an offer or solicitation on our part with respect to the purchase or sale of any securities. |
|
 |
Semiconductor, Networking, and Energy-Linked Groups Led Gainers
Kenneth J. Gruneisen - Passed the CAN SLIM® Master's Exam
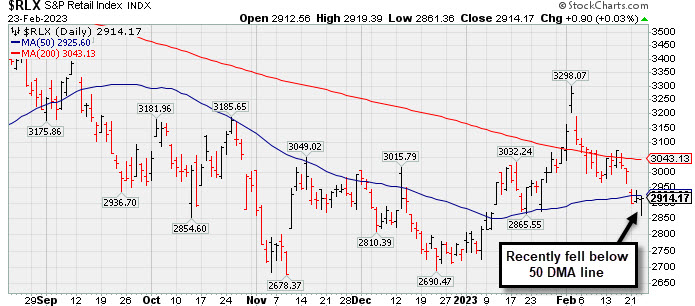
Financials were mixed and little changed as the Bank Index ($BKX +0.32%) edged higher and the Broker/Dealer Index ($XBD -0.27%) edged lower, meanwhile the Retail Index ($RLX +0.03%) finished flat. The Semiconductor Index ($SOX +3.33%) and Networking Index ($NWX +1.62%) both posted gains, meanwhile the Biotech Index ($BTK -0.51%) edged lower. Commodity-linked groups were mixed as the Oil Services Index ($OSX +2.08%) and Integrated Oil Index ($XOI +1.68%) both lost ground while the Gold & Silver Index ($XAU -1.11%) ended lower.
PICTURED: The Retail Index ($RLX +0.03%) was little changed on Thursday after overcoming early weakness. It recently slumped below its 50-day moving average (DMA) line.
| Oil Services |
$OSX |
85.53 |
+1.74 |
+2.08% |
+1.99% |
| Integrated Oil |
$XOI |
1,754.10 |
+29.02 |
+1.68% |
-1.86% |
| Semiconductor |
$SOX |
2,988.81 |
+96.42 |
+3.33% |
+18.04% |
| Networking |
$NWX |
827.63 |
+13.23 |
+1.62% |
+5.66% |
| Broker/Dealer |
$XBD |
490.98 |
-1.35 |
-0.27% |
+9.32% |
| Retail |
$RLX |
2,914.17 |
+0.90 |
+0.03% |
+5.82% |
| Gold & Silver |
$XAU |
112.87 |
-1.27 |
-1.11% |
-6.61% |
| Bank |
$BKX |
108.85 |
+0.35 |
+0.32% |
+7.93% |
| Biotech |
$BTK |
5,311.31 |
-27.43 |
-0.51% |
+0.57% |
|
|
|
 |
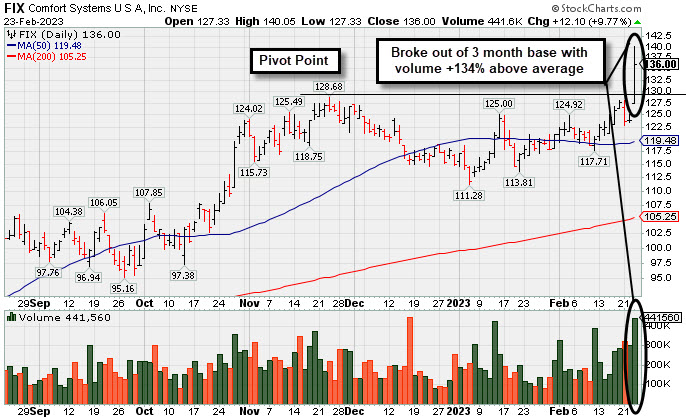
Powerful Technical Breakout After Earnings Report
Kenneth J. Gruneisen - Passed the CAN SLIM® Master's Exam
Comfort Systems U S A (FIX +$12.10 or +9.77% to $136.00) finished strong today after highlighted in yellow in the mid-day report (read here) with a pivot point cited based on its 11/23/22 high plus 10 cents. It broke out hitting a new 52-week high (N criteria) with volume +131% above average behind the gain, triggering a technical buy signal while rising from an orderly 3-month base. Volume and volatility often increase near earnings news. The bullish action came after it reported earnings +48% on +31% sales revenues for the Dec '22 quarter versus the year ago period, its 4th strong quarter above the +25% minimum guideline (C criteria). Annual earning history has been strong and steady.
It hails from the Building - A/C & Heating Products group which is currently ranked 93rd on the 197 Industry Groups list. It has a small supply of only 35.8 million shares outstanding (S criteria) which can contribute to greater price volatility in the event of institutional buying or selling. The number of top-rated funds that own its shares rose from 487 in Jun '22 to 554 in Dec '22, a reassuring sign regarding the I criteria. Its current Up/Down Volume Ratio is 1.5, an unbiased indication its shares have been under acumulation over the past 50 days. .
|
|
|
Color Codes Explained :
Y - Better candidates highlighted by our
staff of experts.
G - Previously featured
in past reports as yellow but may no longer be buyable under the
guidelines.
***Last / Change / Volume data in this table is the closing quote data***
Symbol/Exchange
Company Name
Industry Group |
PRICE |
CHANGE
(%Change) |
Day High |
Volume
(% DAV)
(% 50 day avg vol) |
52 Wk Hi
% From Hi |
Featured
Date |
Price
Featured |
Pivot Featured |
|
Max Buy |
 CMC
-
NYSE
CMC
-
NYSE
Commercial Metals Co
METALS and MINING - Steel and Iron
|
$52.44
|
-3.15
-5.67% |
$54.86
|
1,490,297
135.98% of 50 DAV
50 DAV is 1,096,000
|
$58.09
-9.73%
|
10/14/2022
|
$41.61
|
PP = $44.45
|
|
MB = $46.67
|
 Most Recent Note - 2/23/2023 10:42:29 AM
G - Pulling back today testing its 50 DMA line ($52.56) which defines important near-term support to watch. Fundamentals remain strong.
>>> FEATURED STOCK ARTICLE : Metals Firm Extended From Base and Perched Near High - 2/6/2023 |
View all notes |
Set NEW NOTE alert |
Company Profile |
SEC
News |
Chart |
Request a new note
C
A
S
I |
GPK
-
NYSE
Graphic Packaging Hldg
CONSUMER NON-DURABLES - Packaging and Containers
|
$23.56
|
+0.59
2.57% |
$23.58
|
3,255,527
99.45% of 50 DAV
50 DAV is 3,273,500
|
$24.20
-2.64%
|
10/25/2022
|
$22.75
|
PP = $24.17
|
|
MB = $25.38
|
Most Recent Note - 2/23/2023 6:15:23 PM
Y - Posted a gain with average volume and closed only -2.6% off its all-time high. Showed resilience after briefly violating its 50 DMA line on 2/07/23. Members were reminded - "Disciplined investors know that gains above a stock's pivot point must be backed by at least +40% above average volume to trigger a proper technical buy signal."
>>> FEATURED STOCK ARTICLE : Graphic Packaging Perched Near Pivot Point - 1/27/2023 |
View all notes |
Set NEW NOTE alert |
Company Profile |
SEC
News |
Chart |
Request a new note
C
A
S
I |
GFF
-
NYSE
Griffon Corporation
MATERIALS and CONSTRUCTION - General Building Materials
|
$37.12
|
+0.18
0.49% |
$37.80
|
443,133
85.22% of 50 DAV
50 DAV is 520,000
|
$43.74
-15.13%
|
11/10/2022
|
$34.13
|
PP = $35.02
|
|
MB = $36.77
|
Most Recent Note - 2/21/2023 10:02:18 AM
G - Pulling back near its "max buy" level and today's early loss was nearly testing its 50 DMA line ($38) which defines important support to watch. Reported Dec '22 quarterly earnings +121 on +10% sales revenues versus the year ago period.
>>> FEATURED STOCK ARTICLE : Extended From Any Sound Base and Still Hitting New Highs - 2/2/2023 |
View all notes |
Set NEW NOTE alert |
Company Profile |
SEC
News |
Chart |
Request a new note
C
A
S
I |
TITN
-
NASDAQ
Titan Machinery Inc
SPECIALTY RETAIL
|
$46.02
|
+1.54
3.46% |
$46.62
|
284,954
134.41% of 50 DAV
50 DAV is 212,000
|
$46.40
-0.82%
|
1/13/2023
|
$40.10
|
PP = $44.45
|
|
MB = $46.67
|
Most Recent Note - 2/23/2023 10:46:04 AM
Y - Quietly challenging its all-time high with today's gain. Its 50 DMA line ($41.79) definies important near-term support to watch on pullbacks. It wedged into new high territory with gains lacking great volume conviction since a new pivot point was recently cited based on its 12/01/22 high plus 10 cents.
>>> FEATURED STOCK ARTICLE : 7th Consecutive Gain for Titan - 1/30/2023 |
View all notes |
Set NEW NOTE alert |
Company Profile |
SEC
News |
Chart |
Request a new note
C
A
S
I |
MYE
-
NYSE
Myers Industries Inc
Containers/Packaging
|
$24.43
|
+0.38
1.58% |
$24.44
|
108,658
69.21% of 50 DAV
50 DAV is 157,000
|
$25.55
-4.38%
|
12/8/2022
|
$23.94
|
PP = $25.65
|
|
MB = $26.93
|
Most Recent Note - 2/21/2023 10:06:16 AM
Y - Found prompt support near its 50 DMA line ($23.54) on recent pullbacks. It still faces very little resistance due to overhead supply up to the $25.50 level.
>>> FEATURED STOCK ARTICLE : Perched Near High After Finding Support at 50 DMA - 2/3/2023 |
View all notes |
Set NEW NOTE alert |
Company Profile |
SEC
News |
Chart |
Request a new note
C
A
S
I |
Symbol/Exchange
Company Name
Industry Group |
PRICE |
CHANGE
(%Change) |
Day High |
Volume
(% DAV)
(% 50 day avg vol) |
52 Wk Hi
% From Hi |
Featured
Date |
Price
Featured |
Pivot Featured |
|
Max Buy |
BOX
-
NYSE
Box Inc Cl A
Computer Sftwr-Database
|
$33.68
|
+0.02
0.06% |
$34.05
|
932,215
65.83% of 50 DAV
50 DAV is 1,416,000
|
$34.98
-3.72%
|
2/2/2023
|
$34.68
|
PP = $33.14
|
|
MB = $34.80
|
Most Recent Note - 2/21/2023 9:57:17 AM
Y - Consolidating above prior highs and its 50 DMA line which coincide in the $32 area defining important near term support to watch.
>>> FEATURED STOCK ARTICLE : Perched Near High After Recent Breakout - 2/7/2023 |
View all notes |
Set NEW NOTE alert |
Company Profile |
SEC
News |
Chart |
Request a new note
C
A
S
I |
STRL
-
NASDAQ
Sterling Infrastructure
MATERIALS and; CONSTRUCTION - Heavy Construction
|
$36.97
|
+0.84
2.32% |
$37.59
|
165,110
64.75% of 50 DAV
50 DAV is 255,000
|
$38.43
-3.80%
|
12/14/2022
|
$32.41
|
PP = $33.72
|
|
MB = $35.41
|
Most Recent Note - 2/23/2023 10:44:01 AM
G - Perched near its all-time high, extended from the previously noted base. Prior highs in the $34-33 area and its 50 DMA line ($34) define important near-term support to watch.
>>> FEATURED STOCK ARTICLE : Gain With Average Volume While Perched Near Recent Highs - 1/26/2023 |
View all notes |
Set NEW NOTE alert |
Company Profile |
SEC
News |
Chart |
Request a new note
C
A
S
I |
PERI
-
NASDAQ
Perion Networks Ltd
Comml Svcs-Advertising
|
$34.06
|
+0.63
1.88% |
$34.17
|
853,634
132.35% of 50 DAV
50 DAV is 645,000
|
$35.16
-3.13%
|
1/25/2023
|
$31.79
|
PP = $33.19
|
|
MB = $34.85
|
Most Recent Note - 2/22/2023 6:53:43 PM
Y - Hovering near its 52-week high stubbornly holding ground. Showed resilience after undercutting its pivot point. The next important suppport to watch is its 50 DMA line ($29.50). See the latest FSU analysis for more details and a new annotated graph.
>>> FEATURED STOCK ARTICLE : Perion Stubbornly Holding Ground Near High After Spurt of Gains - 2/22/2023 |
View all notes |
Set NEW NOTE alert |
Company Profile |
SEC
News |
Chart |
Request a new note
C
A
S
I |
ALGM
-
NASDAQ
Allegro Microsystems Inc
Elec-Semiconductor Mfg
|
$43.79
|
+0.75
1.74% |
$45.08
|
1,662,425
101.37% of 50 DAV
50 DAV is 1,640,000
|
$45.99
-4.78%
|
1/31/2023
|
$37.80
|
PP = $38.38
|
|
MB = $40.30
|
Most Recent Note - 2/21/2023 9:55:27 AM
G - Holding its ground stubbornly after rising above its "max buy" level. Prior high in the $38 area defines initial support to watch on pullbacks.
>>> FEATURED STOCK ARTICLE : Big Volume-Driven Gain for Best-Ever Close - 1/31/2023 |
View all notes |
Set NEW NOTE alert |
Company Profile |
SEC
News |
Chart |
Request a new note
C
A
S
I |
WCC
-
NYSE
Wesco International Inc
WHOLESALE - Electronics Wholesale
|
$162.72
|
+0.91
0.56% |
$164.16
|
395,343
85.76% of 50 DAV
50 DAV is 461,000
|
$172.91
-5.89%
|
2/10/2023
|
$148.50
|
PP = $147.15
|
|
MB = $154.51
|
Most Recent Note - 2/21/2023 7:01:16 PM
G - Color code was changed to green after rallying above its "max buy" level. Prior highs in the $144-147 area define initial support to watch. Reported Dec '22 quarterly earnings +40% on +15% sales revenues versus the year ago period. See the latest FSU analysis for more details and a new annotated graph.
>>> FEATURED STOCK ARTICLE : Powered Higher After Recently Highlighted in Feb 10th Report - 2/21/2023 |
View all notes |
Set NEW NOTE alert |
Company Profile |
SEC
News |
Chart |
Request a new note
C
A
S
I |
Symbol/Exchange
Company Name
Industry Group |
PRICE |
CHANGE
(%Change) |
Day High |
Volume
(% DAV)
(% 50 day avg vol) |
52 Wk Hi
% From Hi |
Featured
Date |
Price
Featured |
Pivot Featured |
|
Max Buy |
FIX
-
NYSE
Comfort Systems U S A
MATERIALS and CONSTRUCTION - General Contractors
|
$136.00
|
+12.10
9.77% |
$140.05
|
441,560
233.63% of 50 DAV
50 DAV is 189,000
|
$128.68
5.69%
|
2/23/2023
|
$136.52
|
PP = $128.78
|
|
MB = $135.22
|
Most Recent Note - 2/23/2023 6:12:05 PM
Y - Finished strong today after highlighted in yellow in the mid-day report with a pivot point cited based on its 11/23/22 high plus 10 cents. It broke out hitting a new 52-week high with volume +131% above average behind the gain, triggering a technical buy signal while rising from an orderly 3-month base. Bullish action came after it reported earnings +48% on +31% sales revenues for the Dec '22 quarter versus the year ago period, its 4th strong quarter above the +25% minimum guideline (C criteria). Annual earning history has been strong and steady. See the latest FSU analysis for more details and a new annotated graph.
>>> FEATURED STOCK ARTICLE : Powerful Technical Breakout After Earnings Report - 2/23/2023 |
View all notes |
Set NEW NOTE alert |
Company Profile |
SEC
News |
Chart |
Request a new note
C
A
S
I |
|
|
|
THESE ARE NOT BUY RECOMMENDATIONS!
Comments contained in the body of this report are technical
opinions only. The material herein has been obtained
from sources believed to be reliable and accurate, however,
its accuracy and completeness cannot be guaranteed.
This site is not an investment advisor, hence it does
not endorse or recommend any securities or other investments.
Any recommendation contained in this report may not
be suitable for all investors and it is not to be deemed
an offer or solicitation on our part with respect to
the purchase or sale of any securities. All trademarks,
service marks and trade names appearing in this report
are the property of their respective owners, and are
likewise used for identification purposes only.
This report is a service available
only to active Paid Premium Members.
You may opt-out of receiving report notifications
at any time. Questions or comments may be submitted
by writing to Premium Membership Services 665 S.E. 10 Street, Suite 201 Deerfield Beach, FL 33441-5634 or by calling 1-800-965-8307
or 954-785-1121.
|
|
|