You are not logged in.
This means you
CAN ONLY VIEW reports that were published prior to Saturday, April 5, 2025.
You
MUST UPGRADE YOUR MEMBERSHIP if you want to see any current reports.
AFTER MARKET UPDATE - MONDAY, OCTOBER 31ST, 2022
Previous After Market Report Next After Market Report >>>
|
|
|
|
DOW |
-128.85 |
32,732.95 |
-0.39% |
|
Volume |
1,210,945,823 |
+33% |
|
Volume |
4,632,049,100 |
-1% |
|
NASDAQ |
-114.31 |
10,988.15 |
-1.03% |
|
Advancers |
1,434 |
46% |
|
Advancers |
1,993 |
43% |
|
S&P 500 |
-28.81 |
3,872.25 |
-0.74% |
|
Decliners |
1,658 |
54% |
|
Decliners |
2,621 |
57% |
|
Russell 2000 |
-0.06 |
1,846.86 |
-0.00% |
|
52 Wk Highs |
94 |
|
|
52 Wk Highs |
138 |
|
|
S&P 600 |
-1.28 |
1,195.57 |
-0.11% |
|
52 Wk Lows |
109 |
|
|
52 Wk Lows |
167 |
|
|
 |
Decliners Led Advancers as Major Averages Pulled Back
Kenneth J. Gruneisen - Passed the CAN SLIM® Master's Exam
The Dow lost 128 points, while the Nasdaq Composite shed 1% amid a sell-off in growth-related shares. The S&P 500 fell 0.8%. Despite the retreat, the major indexes ended the month higher and snapped a two-month losing streak. The Dow climbed 14%, its best monthly performance since 1976, while the Nasdaq Composite and S&P 500 climbed 3.9% and 8%, respectively. The volume totals reported were mixed, higher than the prior session on the NYSE and slightly lower on the Nasdaq exchange. Breadth was slightly negative as decliners led advancers by an 8-7 margin on the NYSE and by a 5-4 margin on the Nasdaq exchange. Leadership remained strong as there were 61 high-ranked companies from the Leaders List that hit new 52-week highs and were listed on the BreakOuts Page, versus the total of 60 on the prior session. New 52-week lows totals still outnumbered new 52-week highs totals on both the NYSE and the Nasdaq exchange. The recent follow-through day helped establish a confirmed uptrend (M criteria). Healthy leadership (new 52-week highs totals) will be essential in the near-term for the rally to be productive. Only stocks meeting all key-criteria of the fact-based investment system should be considered as buy candidates.
Chart courtesy of www.stockcharts.com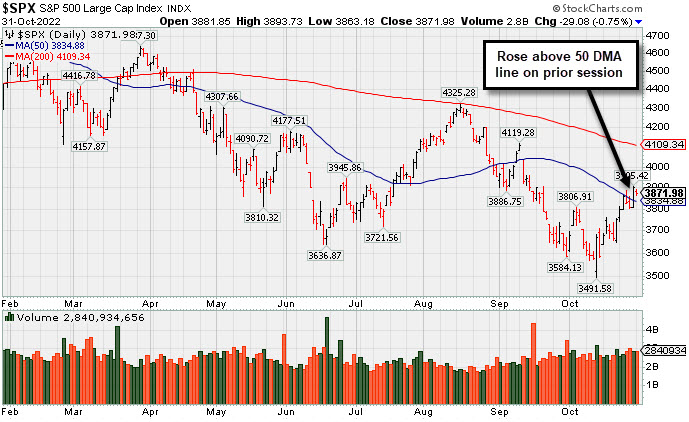 PICTURED: The S&P 500 Index pulled back slightly with higher volume. It rose above its 50-day moving average (DMA) line on the prior session.
U.S. equities finished lower Monday as investors await a decision from the Federal Reserve’s (Fed) monetary policy meeting which concludes on Wednesday afternoon. The central bank is expected to raise interest rates by 75 basis points (0.75%). Following the announcement, market participants will parse through statements from Fed officials for any clues as to the future course of rate hikes.
Treasuries weakened, with the yield on the benchmark 10-year note climbing five basis points (0.05%) to 4.05%, while the 30-year bond yield rose two basis points (0.02%) to 4.15%. The yield on the more Fed-sensitive two-year note advanced seven basis points (0.07%) to 4.48%. West Texas Intermediate (WTI) crude shed 2.1% to $86.10/barrel amid reports China is ramping up COVID-19 restrictions. The crude benchmark notched its first monthly gain since May as tight supply conditions outweighed demand concerns. Elsewhere, spot gold has fallen for the seventh-straight month amid pressure from a hawkish Fed and a strong U.S. dollar. On the data front today, the MNI Chicago Purchasing Managers’ Index (PMI) unexpectedly declined to its lowest level since May 2020, while the Dallas Fed’s Manufacturing Activity Outlook Survey fell more than forecasted in October.
|
 Kenneth J. Gruneisen started out as a licensed stockbroker in August 1987, a couple of months prior to the historic stock market crash that took the Dow Jones Industrial Average down -22.6% in a single day. He has published daily fact-based fundamental and technical analysis on high-ranked stocks online for two decades. Through FACTBASEDINVESTING.COM, Kenneth provides educational articles, news, market commentary, and other information regarding proven investment systems that work in good times and bad.
Comments contained in the body of this report are technical opinions only and are not necessarily those of Gruneisen Growth Corp. The material herein has been obtained from sources believed to be reliable and accurate, however, its accuracy and completeness cannot be guaranteed. Our firm, employees, and customers may effect transactions, including transactions contrary to any recommendation herein, or have positions in the securities mentioned herein or options with respect thereto. Any recommendation contained in this report may not be suitable for all investors and it is not to be deemed an offer or solicitation on our part with respect to the purchase or sale of any securities. |
|
 |
Retail, Tech, and Gold & Silver Indexes Fell
Kenneth J. Gruneisen - Passed the CAN SLIM® Master's Exam
The Retail Index ($RLX -0.97%) created a drag on the major averages and the Bank Index ($BKX -0.48%) edged lower while the Broker/Dealer Index ($XBD -0.06%) finished flat. The tech sector had a negative bias as the Semiconductor Index ($SOX -2.02%) Networking Index ($NWX -0.72%), and Biotech Index ($BTK -0.79%) each lost ground. Commodity-linked groups were mixed as the Gold & Silver Index ($XAU -1.49%) fell while the Oil Services Index ($OSX +1.97%) and Integrated Oil Index ($XOI +0.40%) posted gains.
PICTURED: The Networking Index ($NWX -0.72%) recently rebounded above its 50-day and 200-day moving average (DMA) lines toward its August high.
| Oil Services |
$OSX |
82.31 |
+1.59 |
+1.97% |
+56.13% |
| Integrated Oil |
$XOI |
1,838.48 |
+7.40 |
+0.40% |
+56.04% |
| Semiconductor |
$SOX |
2,384.45 |
-49.20 |
-2.02% |
-39.58% |
| Networking |
$NWX |
839.39 |
-6.07 |
-0.72% |
-13.56% |
| Broker/Dealer |
$XBD |
464.16 |
-0.26 |
-0.06% |
-4.66% |
| Retail |
$RLX |
2,957.58 |
-29.12 |
-0.97% |
-30.02% |
| Gold & Silver |
$XAU |
103.31 |
-1.57 |
-1.49% |
-22.00% |
| Bank |
$BKX |
104.12 |
-0.50 |
-0.48% |
-21.25% |
| Biotech |
$BTK |
4,900.72 |
-39.20 |
-0.79% |
-11.19% |
|
|
|
 |
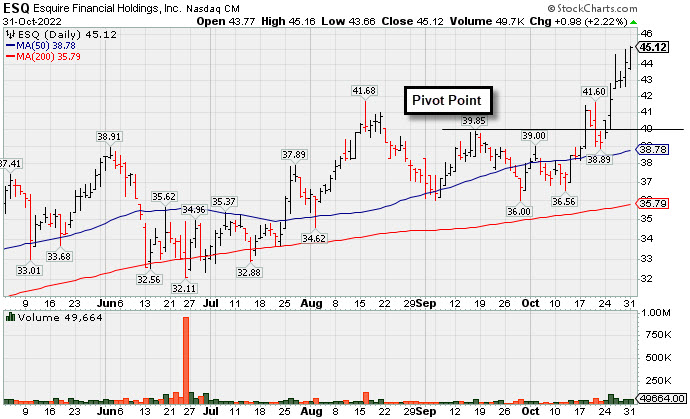
New High With 6th Consecutive Volume-Driven Gain
Kenneth J. Gruneisen - Passed the CAN SLIM® Master's Exam
Esquire Financial Hldgs (ESQ +$1.04 or +2.36% to $45.18) hit another new 52-week high with today's 6th consecutive volume-driven gain, getting extended from the previously noted base. Prior highs in the $41 area define initial support to watch on pullbacks.
ESQ was highlighted in yellow in the 7/26/22 mid-day report (read here) with pivot point cited based on its 4/25/22 high plus 10 cents. It was last shown in this FSU section on 10/07/22 with an annotated graph under the headline, "Rebound Above 50-Day Moving Average Needed for Outlook to Improve". This thinly-traded holding company in the Finance - Commercial Loans industry group has a small supply (S criteria) of only 6.5 million shares in the public float, which can contribute to greater price volatility in the event of institutional buying or selling. It completed its $14 IPO on 6/29/17. The number of top-rated funds owning its shares rose form 64 in Sep '21 to 167 in Sep '22, a reassuring sign concerning the I criteria. Its current Up/Down Volume Ratio of 1.5 is an unbiased indication its shares have been under accumulation over the past 50 days.
ESQ has a 98 Earnings Per Share Rating. It reported earnings +49% on +36% sales revenues for the Sep '22 quarter versus the year-ago period, the 5th consecutive quarterly comparison with an earnings increase above the +25% minimum guideline. Its annual earnings growth (A criteria) history has been strong.
|
|
|
Color Codes Explained :
Y - Better candidates highlighted by our
staff of experts.
G - Previously featured
in past reports as yellow but may no longer be buyable under the
guidelines.
***Last / Change / Volume data in this table is the closing quote data***
Symbol/Exchange
Company Name
Industry Group |
PRICE |
CHANGE
(%Change) |
Day High |
Volume
(% DAV)
(% 50 day avg vol) |
52 Wk Hi
% From Hi |
Featured
Date |
Price
Featured |
Pivot Featured |
|
Max Buy |
 CI
-
NYSE
CI
-
NYSE
Cigna Corp
Medical-Managed Care
|
$323.13
|
-1.64
-0.50% |
$324.15
|
1,289,737
67.07% of 50 DAV
50 DAV is 1,923,000
|
$325.16
-0.63%
|
7/7/2022
|
$276.55
|
PP = $273.68
|
|
MB = $287.36
|
Most Recent Note - 10/27/2022 5:25:48 PM
G - Posted a 6th consecutive gain today with below average volume for yet another new all-time high. Its 50 DMA line ($290) defines near-term support to watch above the recent low ($283.79 on 10/10/22). Due to report Sep '22 quarterly results on 11/03/22. Volume and volatility often increase near earnings news.
>>> FEATURED STOCK ARTICLE : No Resistance Remains Due to Overhead Supply - 10/4/2022 |
View all notes |
Set NEW NOTE alert |
Company Profile |
SEC
News |
Chart |
Request a new note
C
A
S
I |
ESQ
-
NASDAQ
Esquire Financial Hldgs
Finance-Commercial Loans
|
$45.18
|
+1.04
2.36% |
$45.20
|
60,078
222.51% of 50 DAV
50 DAV is 27,000
|
$45.01
0.38%
|
10/18/2022
|
$40.02
|
PP = $39.95
|
|
MB = $41.95
|
 Most Recent Note - 10/31/2022 4:34:16 PM
G - Hit yet another new 52-week high with today's 6th consecutive volume-driven gain, getting extended from the previously noted base. Prior highs in the $41 area define initial support to watch on pullbacks. See the latest FSU analysis for more details and a new annotated graph.
>>> FEATURED STOCK ARTICLE : New High With 6th Consecutive Volume-Driven Gain - 10/31/2022 |
View all notes |
Set NEW NOTE alert |
Company Profile |
SEC
News |
Chart |
Request a new note
C
A
S
I |
CCRN
-
NASDAQ
Cross Country Healthcare
DIVERSIFIED SERVICES - Staffing and Outsourcing Service
|
$37.09
|
-1.01
-2.65% |
$38.68
|
854,864
98.71% of 50 DAV
50 DAV is 866,000
|
$38.47
-3.59%
|
9/9/2022
|
$27.32
|
PP = $30.61
|
|
MB = $32.14
|
Most Recent Note - 10/31/2022 2:21:20 PM
G - Reversed into the red today after touching a new high following 3 consecutive gains. Extended from the previously noted base. Prior highs in the $30.50 area define important near-term support to watch along with its 50 DMA line.
>>> FEATURED STOCK ARTICLE : Healthcare Staffing Firm Hovering Near All-Time High - 10/17/2022 |
View all notes |
Set NEW NOTE alert |
Company Profile |
SEC
News |
Chart |
Request a new note
C
A
S
I |
CMC
-
NYSE
Commercial Metals Co
METALS and MINING - Steel and Iron
|
$45.50
|
+0.91
2.04% |
$45.81
|
1,092,518
107.00% of 50 DAV
50 DAV is 1,021,000
|
$46.68
-2.53%
|
10/14/2022
|
$41.61
|
PP = $44.45
|
|
MB = $46.67
|
Most Recent Note - 10/31/2022 2:16:23 PM
Y - Posting a gain today, on track for its second best ever close, approaching its "max buy" level and all-time high. Reported Aug '22 quarterly earnings +94% on +19% sales revenues versus the year ago period and prior quarterly comparisons were well above the +25% minimum earnings guideline (C criteria) of the fact-based investment system. Annual earnings growth has been strong.
>>> FEATURED STOCK ARTICLE : Little Resistance Remains for Strong Steel/Metal Products Firm - 10/14/2022 |
View all notes |
Set NEW NOTE alert |
Company Profile |
SEC
News |
Chart |
Request a new note
C
A
S
I |
VRTX
-
NASDAQ
Vertex Pharmaceuticals
Medical-Biomed/Biotech
|
$312.00
|
-1.89
-0.60% |
$314.09
|
1,571,373
113.29% of 50 DAV
50 DAV is 1,387,000
|
$316.48
-1.42%
|
10/24/2022
|
$308.47
|
PP = $306.05
|
|
MB = $321.35
|
Most Recent Note - 10/28/2022 1:43:46 PM
Y - Color code is changed to yellow after quickly rebounding above its 50 DMA line and back above its pivot point with today's big volume-driven gain. Reported Sep '22 quarterly earnings +14% on +18% sales revenues versus the year ago period, below the +25% minimum earnings guideline raising concerns (C criteria). Annual earnings (A criteria) history has been strong.
>>> FEATURED STOCK ARTICLE : Volume-Driven Gain Triggered Technical Buy Signal - 10/24/2022 |
View all notes |
Set NEW NOTE alert |
Company Profile |
SEC
News |
Chart |
Request a new note
C
A
S
I |
Symbol/Exchange
Company Name
Industry Group |
PRICE |
CHANGE
(%Change) |
Day High |
Volume
(% DAV)
(% 50 day avg vol) |
52 Wk Hi
% From Hi |
Featured
Date |
Price
Featured |
Pivot Featured |
|
Max Buy |
CLFD
-
NASDAQ
Clearfield Inc
TELECOMMUNICATIONS - Cables / Satalite Equipment
|
$121.46
|
-1.16
-0.95% |
$125.83
|
140,302
58.22% of 50 DAV
50 DAV is 241,000
|
$130.01
-6.58%
|
10/25/2022
|
$117.96
|
PP = $130.11
|
|
MB = $136.62
|
Most Recent Note - 10/28/2022 5:40:15 PM
Y - Posted another gain today with average volume, rising toward its 52-week high. New pivot point was cited based on its 8/25/22 high plus 10 cents. Subsequent gains above the pivot point backed by at least +40% above average volume may trigger a technical buy signal. Fundamentals remain strong. Due to report Sep '22 quarterly results on 11/04/22. Showed resilience since dropped from the Featured Stocks list on 9/01/22. See the latest FSU analysis for more details and an annotated graph.
>>> FEATURED STOCK ARTICLE : Clearfield Perched -8.6% Off High After Recent Rebound - 10/27/2022 |
View all notes |
Set NEW NOTE alert |
Company Profile |
SEC
News |
Chart |
Request a new note
C
A
S
I |
GPK
-
NYSE
Graphic Packaging Hldg
CONSUMER NON-DURABLES - Packaging and Containers
|
$22.96
|
-0.07
-0.30% |
$23.19
|
2,707,741
96.43% of 50 DAV
50 DAV is 2,808,000
|
$24.07
-4.61%
|
10/25/2022
|
$22.75
|
PP = $24.17
|
|
MB = $25.38
|
Most Recent Note - 10/31/2022 2:18:04 PM
Y - Pulling back today for a 3rd consecutive loss after spiking higher last week challenging its 52-week high. Subsequent gains above the pivot point backed by at least +40% above average volume may trigger a technical buy signal. Reported Sep '22 quarterly earnings +79% on +38% sales revenues versus the year ago period.
>>> FEATURED STOCK ARTICLE : Rebound Above 50-Day Moving Average Helped Outlook Improve - 10/25/2022 |
View all notes |
Set NEW NOTE alert |
Company Profile |
SEC
News |
Chart |
Request a new note
C
A
S
I |
CBZ
-
NYSE
C B I Z Inc
Comml Svcs-Consulting
|
$49.64
|
-0.38
-0.76% |
$50.57
|
410,204
166.07% of 50 DAV
50 DAV is 247,000
|
$50.27
-1.25%
|
10/26/2022
|
$47.83
|
PP = $48.57
|
|
MB = $51.00
|
Most Recent Note - 10/27/2022 5:21:27 PM
Y - Hit a new 52-week high today with a gain above its pivot point backed by +87% above average volume triggering a technical buy signal. Reported Sep '22 quarterly earnings +24% on +28% sales revenues versus the year ago period. Volume and volatility often increase near earnings news. Earnings rose +26% on +30% sales revenues for the Jun '22 quarter versus the year ago period. Annual earnings history has been strong and it has a 94 Earnings Per Share Rating. See the latest FSU analysis for more details and an annotated graph.
>>> FEATURED STOCK ARTICLE : Earnings Report Due for Commercial Services and Consulting Firm - 10/26/2022 |
View all notes |
Set NEW NOTE alert |
Company Profile |
SEC
News |
Chart |
Request a new note
C
A
S
I |
ENPH
-
NASDAQ
Enphase Energy Inc
Energy-Solar
|
$306.95
|
+1.70
0.56% |
$308.28
|
2,408,955
61.72% of 50 DAV
50 DAV is 3,903,000
|
$324.84
-5.51%
|
10/26/2022
|
$301.55
|
PP = $324.94
|
|
MB = $341.19
|
Most Recent Note - 10/28/2022 5:21:59 PM
Y - Paused today after 6 consecutive volume-driven gains. Highlighted in yellow in the 10/26/22 mid-day report with new pivot point cited based on its 9/08/22 high plus 10 cents. Rebound above its 50 DMA line ($281.92) helped its outlook improve. Faces little resistance due to overhead supply up to the $324 level. Reported Sep '22 quarterly earnings +108% on +81% sales revenues versus the year ago period, continuing its strong earnings history above the +25% minimum guideline (C criteria). See the latest FSU analysis for more details and an annotated graph.
>>> FEATURED STOCK ARTICLE : Enphase Energy Rebound Above 50-Day Moving Average Helped Outlook - 10/28/2022 |
View all notes |
Set NEW NOTE alert |
Company Profile |
SEC
News |
Chart |
Request a new note
C
A
S
I |
|
|
|
THESE ARE NOT BUY RECOMMENDATIONS!
Comments contained in the body of this report are technical
opinions only. The material herein has been obtained
from sources believed to be reliable and accurate, however,
its accuracy and completeness cannot be guaranteed.
This site is not an investment advisor, hence it does
not endorse or recommend any securities or other investments.
Any recommendation contained in this report may not
be suitable for all investors and it is not to be deemed
an offer or solicitation on our part with respect to
the purchase or sale of any securities. All trademarks,
service marks and trade names appearing in this report
are the property of their respective owners, and are
likewise used for identification purposes only.
This report is a service available
only to active Paid Premium Members.
You may opt-out of receiving report notifications
at any time. Questions or comments may be submitted
by writing to Premium Membership Services 665 S.E. 10 Street, Suite 201 Deerfield Beach, FL 33441-5634 or by calling 1-800-965-8307
or 954-785-1121.
|
|
|