***Last / Change / Volume data in this table is the closing quote data***
Symbol/Exchange
Company Name
Industry Group |
PRICE |
CHANGE
(%Change) |
Day High |
Volume
(% DAV)
(% 50 day avg vol) |
52 Wk Hi
% From Hi |
Featured
Date |
Price
Featured |
Pivot Featured |
|
Max Buy |
 SIVB
-
NASDAQ
SIVB
-
NASDAQ
S V B Financial Group
BANKING - Regional - Pacific Banks
|
$649.35
|
-15.18
-2.28% |
$669.00
|
331,439
84.55% of 50 DAV
50 DAV is 392,000
|
$677.14
-4.10%
|
8/6/2021
|
$589.70
|
PP = $608.94
|
|
MB = $639.39
|
Most Recent Note - 9/28/2021 5:39:42 PM
G - Pulled back today after 5 consecutive gains into new all-time high territory. Prior highs in the $608 area define initial support to watch above its 50 DMA line ($580). Completed a new Public Offering on 8/11/21. See the latest FSU analysis for more details and a new annotated graph.
>>> FEATURED STOCK ARTICLE : Pullback After 5 Straight Gains into New High Territory - 9/28/2021 |
View all notes |
Set NEW NOTE alert |
Company Profile |
SEC
News |
Chart |
Request a new note
C
A
S
I |
BLDR
-
NYSE
Builders Firstsource Inc
Bldg-Constr Prds/Misc
|
$52.58
|
-0.38
-0.72% |
$53.17
|
1,950,690
93.56% of 50 DAV
50 DAV is 2,085,000
|
$55.54
-5.33%
|
8/12/2021
|
$52.38
|
PP = $54.09
|
|
MB = $56.79
|
Most Recent Note - 10/1/2021 5:27:31 PM
Y - Sputtering after wedging to a new all-time high. Its 50 DMA line ($50.79) defines important near term support. Subsequent gains above the pivot point backed by at least +40% above average volume may clinch a proper technical buy signal. Fundamentals remain strong. See the latest FSU analysis for more details and a new annotated graph.
>>> FEATURED STOCK ARTICLE : Sputtering After Wedging to New Highs - 10/1/2021 |
View all notes |
Set NEW NOTE alert |
Company Profile |
SEC
News |
Chart |
Request a new note
C
A
S
I |
SNPS
-
NASDAQ
Synopsys Inc
COMPUTER SOFTWARE and SERVICES - Technical and System Software
|
$289.25
|
-13.24
-4.38% |
$300.35
|
893,430
132.20% of 50 DAV
50 DAV is 675,800
|
$340.66
-15.09%
|
8/18/2021
|
$293.22
|
PP = $301.01
|
|
MB = $316.06
|
 Most Recent Note - 10/4/2021 5:49:57 PM
Sank well below the prior high in the $300 area and its Relative Strength Rating has slumped to 73, well below the 80+ minimum guideline for buy candidates. A rebound above the 50 DMA line ($311) is needed for its outlook to improve. It will be dropped from the Featured Stocks list tonight.
>>> FEATURED STOCK ARTICLE : Latest Earnings Report Missed the +25% Minimum Guideline - 8/18/2021 |
View all notes |
Set NEW NOTE alert |
Company Profile |
SEC
News |
Chart |
Request a new note
C
A
S
I |
CROX
-
NASDAQ
Crocs Inc
CONSUMER NON-DURABLES - Textile - Apparel Footwear
|
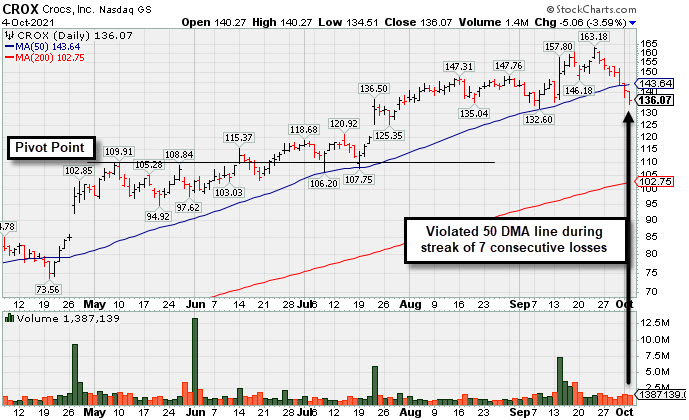
$136.07
|
-5.06
-3.59% |
$140.27
|
1,386,531
103.63% of 50 DAV
50 DAV is 1,338,000
|
$163.18
-16.61%
|
6/14/2021
|
$112.64
|
PP = $110.01
|
|
MB = $115.51
|
Most Recent Note - 10/4/2021 5:26:01 PM
G - Pulled back from its all-time high with 7 consecutive losses violating its 50 DMA line ($143). The prior low ($132.60) defines the next important support where a violation may raise more serious concerns and trigger a worrisome technical sell signal. See the latest FSU analysis for more details and a new annotated graph.
>>> FEATURED STOCK ARTICLE : Streak of Losses Violated 50-day Moving Average Line - 10/4/2021 |
View all notes |
Set NEW NOTE alert |
Company Profile |
SEC
News |
Chart |
Request a new note
C
A
S
I |
KFRC
-
NASDAQ
Kforce Inc
Comml Svcs-Staffing
|
$62.18
|
+0.64
1.04% |
$62.46
|
87,023
76.34% of 50 DAV
50 DAV is 114,000
|
$64.38
-3.42%
|
9/10/2021
|
$59.53
|
PP = $64.48
|
|
MB = $67.70
|
Most Recent Note - 9/30/2021 5:27:29 PM
G - Slumped to close below its 50 DMA line ($59.96) with today's loss and its color code is changed to green. Subsequent gains above its pivot point backed by at least +40% above average volume are needed to trigger a technical buy signal. Reported earnings +113% on +18% sales revenues for the Jun '21 quarter versus the year ago period, its 4th quarterly earnings increase above the +25% minimum earnings guideline (C criteria). Annual earnings (A criteria) growth has been steady.
>>> FEATURED STOCK ARTICLE : Staffing Firm Still Faces Some Overhead Supply - 9/13/2021 |
View all notes |
Set NEW NOTE alert |
Company Profile |
SEC
News |
Chart |
Request a new note
C
A
S
I |
Symbol/Exchange
Company Name
Industry Group |
PRICE |
CHANGE
(%Change) |
Day High |
Volume
(% DAV)
(% 50 day avg vol) |
52 Wk Hi
% From Hi |
Featured
Date |
Price
Featured |
Pivot Featured |
|
Max Buy |
CRL
-
NYSE
Charles River Labs Intl
DRUGS - Biotechnology
|
$398.46
|
-18.23
-4.37% |
$412.99
|
641,994
195.73% of 50 DAV
50 DAV is 328,000
|
$460.21
-13.42%
|
6/9/2021
|
$345.91
|
PP = $349.23
|
|
MB = $366.69
|
Most Recent Note - 10/4/2021 5:38:13 PM
Pulled back further today with +87% above average volume, encountering distributional pressure after recently wedging to a new all-time high. Violated its 50 DMA line ($425) and prior low in the $423 with recent losses triggering technical sell signals. A rebound above the 50 DMA line is needed for its outlook to improve. It will be dropped from the Featured Stocks list tonight.
>>> FEATURED STOCK ARTICLE : Wedging Higher With Gains Lacking Volume Conviction - 8/24/2021 |
View all notes |
Set NEW NOTE alert |
Company Profile |
SEC
News |
Chart |
Request a new note
C
A
S
I |
GNRC
-
NYSE
Generac Hldgs Inc
Electrical-Power/Equipmt
|
$402.09
|
-2.86
-0.71% |
$405.00
|
622,933
87.49% of 50 DAV
50 DAV is 712,000
|
$466.92
-13.88%
|
8/30/2021
|
$449.36
|
PP = $457.10
|
|
MB = $479.96
|
Most Recent Note - 9/29/2021 3:59:06 PM
G - Slumping further below its 50 DMA line ($428) with today's damaging volume-driven loss. A prompt rebound above the 50 DMA line is needed for its outlook to improve.
>>> FEATURED STOCK ARTICLE : Rebound Above 50-Day Moving Average Helps Outlook - 8/23/2021 |
View all notes |
Set NEW NOTE alert |
Company Profile |
SEC
News |
Chart |
Request a new note
C
A
S
I |
CAMT
-
NASDAQ
Camtek Ltd
ELECTRONICS - Scientific and Technical Instrum
|
$38.81
|
-2.00
-4.90% |
$40.09
|
246,328
148.39% of 50 DAV
50 DAV is 166,000
|
$46.01
-15.65%
|
8/4/2021
|
$39.67
|
PP = $40.57
|
|
MB = $42.60
|
Most Recent Note - 10/4/2021 5:28:44 PM
G - Violated prior highs in the $40 area and sank below its 50 DMA line ($39.68) with today's volume-driven loss raising concerns and triggering a technical sell signal. Color code is changed to green. The prior low ($34.68 on 8/17/21) defines the next important near-term support to watch. Fundamentals remain strong.
>>> FEATURED STOCK ARTICLE : Recent 50-Day Moving Average Violation Again Raised Concerns - 8/17/2021 |
View all notes |
Set NEW NOTE alert |
Company Profile |
SEC
News |
Chart |
Request a new note
C
A
S
I |
PKI
-
NYSE
Perkinelmer Inc
ELECTRONICS - Scientific and Technical Instrum
|
$171.09
|
-2.51
-1.45% |
$174.26
|
560,720
75.16% of 50 DAV
50 DAV is 746,000
|
$192.00
-10.89%
|
8/18/2021
|
$181.07
|
PP = $188.50
|
|
MB = $197.93
|
Most Recent Note - 9/30/2021 5:30:59 PM
G - Met resistance last week near prior highs then slumped below its 50 DMA line ($182) and its color code is changed to green. A rebound above the 50 DMA line is needed for its outlook to improve. Fundamentals remain strong.
>>> FEATURED STOCK ARTICLE : Stalled But Holding Ground After Recent "3 Weeks Tight" - 9/17/2021 |
View all notes |
Set NEW NOTE alert |
Company Profile |
SEC
News |
Chart |
Request a new note
C
A
S
I |
UMC
-
NYSE
United Microelectrnc Adr
ELECTRONICS - Semiconductor - Integrated Cir
|
$10.69
|
-0.61
-5.40% |
$11.00
|
9,547,170
131.12% of 50 DAV
50 DAV is 7,281,000
|
$12.62
-15.29%
|
8/5/2021
|
$11.62
|
PP = $11.38
|
|
MB = $11.95
|
Most Recent Note - 10/4/2021 5:44:17 PM
G - Today's big loss with higher volume raised concerns while violating its 50 DMA line ($11.15) triggering a technical sell signal and its color code is changed to green. Only a prompt rebound above the 50 DMA line would help its outlook improve.
>>> FEATURED STOCK ARTICLE : Consolidating Above 50-day Moving Average Near "Max Buy" Level - 9/27/2021 |
View all notes |
Set NEW NOTE alert |
Company Profile |
SEC
News |
Chart |
Request a new note
C
A
S
I |
Symbol/Exchange
Company Name
Industry Group |
PRICE |
CHANGE
(%Change) |
Day High |
Volume
(% DAV)
(% 50 day avg vol) |
52 Wk Hi
% From Hi |
Featured
Date |
Price
Featured |
Pivot Featured |
|
Max Buy |
BRKS
-
NASDAQ
Brooks Automation
ELECTRONICS - Semiconductor Equipment and Mate
|
$100.98
|
-2.38
-2.30% |
$103.00
|
628,049
99.53% of 50 DAV
50 DAV is 631,000
|
$110.40
-8.53%
|
9/20/2021
|
$101.21
|
PP = $108.82
|
|
MB = $114.26
|
Most Recent Note - 9/28/2021 5:42:35 PM
Y - Pulled back from its 52-week high with today's loss on average volume after a streak of 8 consecutive gains. Pivot point cited was based on its 4/27/21 high plus 10 cents. Subsequent gains above the pivot point backed by at least 40% above average volume may trigger a technical buy signal.
>>> FEATURED STOCK ARTICLE : Rallying Near High After Brief Consolidation Below 200 DMA Line - 9/20/2021 |
View all notes |
Set NEW NOTE alert |
Company Profile |
SEC
News |
Chart |
Request a new note
C
A
S
I |
ENTG
-
NASDAQ
Entegris Inc
ELECTRONICS - Semiconductor Equipment and Mate
|
$120.15
|
-4.71
-3.77% |
$124.46
|
990,002
143.06% of 50 DAV
50 DAV is 692,000
|
$135.99
-11.65%
|
8/4/2021
|
$125.33
|
PP = $126.51
|
|
MB = $132.84
|
Most Recent Note - 10/4/2021 5:41:12 PM
G - Violated its 50 DMA line ($121.75) wit today's volume driven loss triggering a technical sell signal. Only a prompt rebound above the 50 DMA line would help its outlook improve. Its prior low and 200 DMA line define the next important support in the $109 area.
>>> FEATURED STOCK ARTICLE : Hit New High and Rose Above its Max Buy Level - 9/23/2021 |
View all notes |
Set NEW NOTE alert |
Company Profile |
SEC
News |
Chart |
Request a new note
C
A
S
I |
CPRT
-
NASDAQ
Copart Inc
SPECIALTY RETAIL - Auto Dealerships
|
$136.57
|
-3.36
-2.40% |
$140.23
|
1,054,379
109.25% of 50 DAV
50 DAV is 965,100
|
$152.75
-10.59%
|
9/15/2021
|
$146.44
|
PP = $149.17
|
|
MB = $156.63
|
Most Recent Note - 10/4/2021 5:34:05 PM
Slumped further below its 50 DMA line ($143.72) again with today's big loss on near average volume. Its Relative Strength rating has slumped to 71, below the 80+ minimum guideline for buy candidates. A rebound above the 50 DMA line is needed for its outlook to improve. It will be dropped from the Featured Stocks list tonight.
>>> FEATURED STOCK ARTICLE : Volume-Driven Gain Challenging High - 9/15/2021 |
View all notes |
Set NEW NOTE alert |
Company Profile |
SEC
News |
Chart |
Request a new note
C
A
S
I |
CLFD
-
NASDAQ
Clearfield Inc
TELECOMMUNICATIONS - Cables / Satalite Equipment
|
$45.56
|
+0.48
1.06% |
$46.10
|
122,924
133.61% of 50 DAV
50 DAV is 92,000
|
$46.93
-2.92%
|
7/23/2021
|
$40.23
|
PP = $43.74
|
|
MB = $45.93
|
Most Recent Note - 10/4/2021 5:30:43 PM
Y - Posted a 3rd consecutive gain today, staying above its 50 DMA line ($43.79) after testing the prior low ($42.34) where more damaging losses may trigger a technical sell signal. Fundamentals remain strong.
>>> FEATURED STOCK ARTICLE : Quietly Consolidating Near All-Time High - 9/14/2021 |
View all notes |
Set NEW NOTE alert |
Company Profile |
SEC
News |
Chart |
Request a new note
C
A
S
I |
POOL
-
NASDAQ
Pool Corp
WHOLESALE - Basic Materials Wholesale
|
$435.92
|
-1.48
-0.34% |
$438.95
|
326,111
157.39% of 50 DAV
50 DAV is 207,200
|
$500.85
-12.96%
|
8/19/2021
|
$484.37
|
PP = $495.32
|
|
MB = $520.09
|
Most Recent Note - 10/4/2021 5:46:19 PM
Recent damaging losses raised concerns. A rebound above the 50 DMA line ($475) is needed for its outlook to improve. Its Relative Strength rating has slumped to 73, below the 80+ minimum guideline for buy candidates. I will be dropped from the Featured Stocks list tonight.
>>> FEATURED STOCK ARTICLE : Touched New High With a Gain on Light Volume - 9/8/2021 |
View all notes |
Set NEW NOTE alert |
Company Profile |
SEC
News |
Chart |
Request a new note
C
A
S
I |
Symbol/Exchange
Company Name
Industry Group |
PRICE |
CHANGE
(%Change) |
Day High |
Volume
(% DAV)
(% 50 day avg vol) |
52 Wk Hi
% From Hi |
Featured
Date |
Price
Featured |
Pivot Featured |
|
Max Buy |
SMPL
-
NASDAQ
Simply Good Foods Co
Food-Confectionery
|
$35.33
|
-0.17
-0.48% |
$35.81
|
209,661
63.38% of 50 DAV
50 DAV is 330,800
|
$38.50
-8.23%
|
12/28/2020
|
$30.40
|
PP = $31.44
|
|
MB = $33.01
|
Most Recent Note - 9/29/2021 5:12:12 PM
G - Posted a quiet gain today, rebounding near its 50 DMA line ($35.70) which recently has acted as resistance. Recent low ($33.55 on 9/20/21) defines important support where more damaging losses would raise greater concerns. Fundamentals remain strong.
>>> FEATURED STOCK ARTICLE : Still Lingering Below 50-Day Moving Average Line - 8/30/2021 |
View all notes |
Set NEW NOTE alert |
Company Profile |
SEC
News |
Chart |
Request a new note
C
A
S
I |
WDAY
-
NYSE
Workday Inc Cl A
Computer Sftwr-Enterprse
|
$249.68
|
-4.87
-1.91% |
$254.02
|
1,592,213
94.78% of 50 DAV
50 DAV is 1,679,900
|
$282.77
-11.70%
|
9/7/2021
|
$275.69
|
PP = $282.87
|
|
MB = $297.01
|
Most Recent Note - 9/28/2021 1:34:16 PM
Y - Gapped down today slumping toward its 50 DMA line ($250.73) which defines important near-term support. Faces resistance due to overhead supply up to the $278 level after trading in a tight range for the past month. Fundamentals remain strong.
>>> FEATURED STOCK ARTICLE : Gap Up and Recent Gains Challenge All-Time High - 9/7/2021 |
View all notes |
Set NEW NOTE alert |
Company Profile |
SEC
News |
Chart |
Request a new note
C
A
S
I |
CTLT
-
NYSE
Catalent Inc
DRUGS - Biotechnology
|
$129.02
|
-2.91
-2.21% |
$131.79
|
1,009,807
114.10% of 50 DAV
50 DAV is 885,000
|
$142.64
-9.55%
|
8/25/2021
|
$128.72
|
PP = $127.78
|
|
MB = $134.17
|
Most Recent Note - 9/28/2021 5:45:18 PM
G - Retreated from its all-time high with today's loss on above average volume while slumping below its "max buy" level. Prior highs in the $124-127 area define important support to watch along with its 50 DMA line ($127.62). Fundamentals remain strong.
>>> FEATURED STOCK ARTICLE : Strong Gain Triggered Technical Buy Signal - 8/25/2021 |
View all notes |
Set NEW NOTE alert |
Company Profile |
SEC
News |
Chart |
Request a new note
C
A
S
I |
BLD
-
NYSE
Topbuild Corp
Bldg-Constr Prds/Misc
|
$208.42
|
+1.81
0.88% |
$208.85
|
196,413
76.96% of 50 DAV
50 DAV is 255,200
|
$235.50
-11.50%
|
9/9/2021
|
$227.02
|
PP = $229.89
|
|
MB = $241.38
|
Most Recent Note - 9/28/2021 4:35:13 PM
G - Color code is changed to green after today's damaging volume-driven loss violated its 50 DMA line ($215) triggering a technical sell signal. Only a prompt rebound above the 50 DMA line would help its outlook improve. Its Relative Strength rating has slumped to 73, well below the 80+ minimum for buy candidates.
>>> FEATURED STOCK ARTICLE : Close in Lower Half of Range Indicates Distributional Pressure - 9/9/2021 |
View all notes |
Set NEW NOTE alert |
Company Profile |
SEC
News |
Chart |
Request a new note
C
A
S
I |
MEDP
-
NASDAQ
Medpace Holdings Inc
Medical-Research Eqp/Svc
|
$191.50
|
-4.13
-2.11% |
$194.75
|
205,996
116.38% of 50 DAV
50 DAV is 177,000
|
$199.04
-3.79%
|
9/10/2021
|
$196.32
|
PP = $196.22
|
|
MB = $206.03
|
Most Recent Note - 10/1/2021 5:32:57 PM
Y - Rose near its 52-week high with today's 3rd consecutive gain. Found prompt support near its 50 DMA line ($182.97). Highlighted in yellow with pivot point cited based on its 4/26/21 high plus 10 cents in the 9/10/21 mid-day report. Subsequent gains and strong close above the pivot point backed by at least +40% above average volume may trigger a technical buy signal.
>>> FEATURED STOCK ARTICLE : Negative Reversal Indicative of Distributional Pressure - 9/10/2021 |
View all notes |
Set NEW NOTE alert |
Company Profile |
SEC
News |
Chart |
Request a new note
C
A
S
I |
Symbol/Exchange
Company Name
Industry Group |
PRICE |
CHANGE
(%Change) |
Day High |
Volume
(% DAV)
(% 50 day avg vol) |
52 Wk Hi
% From Hi |
Featured
Date |
Price
Featured |
Pivot Featured |
|
Max Buy |
JEF
-
NYSE
Jefferies Financial Grp
Finance-Invest Bnk/Bkrs
|
$37.95
|
+0.04
0.11% |
$38.97
|
2,644,009
168.19% of 50 DAV
50 DAV is 1,572,000
|
$38.54
-1.53%
|
6/28/2021
|
$31.81
|
PP = $34.42
|
|
MB = $36.14
|
Most Recent Note - 10/1/2021 12:30:56 PM
G - Reported Aug '21 quarterly earnings +713% on +70% sales revenues versus the year ago period. Holding its ground stubbornly following a "negative reversal" on 9/28/21 after wedging to a new all-time high. Found support near prior highs in the $34-35 range and above its 50 DMA line ($35.69) during its recent consolidation.
>>> FEATURED STOCK ARTICLE : Perched at 52-week High With Earnings News Due - 9/29/2021 |
View all notes |
Set NEW NOTE alert |
Company Profile |
SEC
News |
Chart |
Request a new note
C
A
S
I |
DBX
-
NASDAQ
Dropbox Inc Cl A
Computer Sftwr-Database
|
$27.84
|
-1.60
-5.43% |
$29.24
|
4,368,922
122.79% of 50 DAV
50 DAV is 3,557,900
|
$33.00
-15.64%
|
9/3/2021
|
$32.45
|
PP = $33.00
|
|
MB = $34.65
|
Most Recent Note - 10/4/2021 5:23:21 PM
Suffered another big volume-driven loss today and it will be dropped from the Featured Stocks list tonight. A rebound above the 50 DMA line ($31) is needed for its outlook to improve.
>>> FEATURED STOCK ARTICLE : Volume Higher on 6th Consecutive Gain for Dropbox - 9/3/2021 |
View all notes |
Set NEW NOTE alert |
Company Profile |
SEC
News |
Chart |
Request a new note
C
A
S
I |
AVTR
-
NYSE
Avantor Inc
Medical-Research Eqp/Svc
|
$40.28
|
-1.27
-3.06% |
$41.25
|
4,379,251
115.06% of 50 DAV
50 DAV is 3,806,000
|
$44.37
-9.22%
|
6/10/2021
|
$32.94
|
PP = $34.09
|
|
MB = $35.79
|
Most Recent Note - 10/1/2021 12:04:55 PM
G - Finding support while testing support at its 50 DMA line ($39.97). A damaging violation may trigger a technical sell signal. Completed a Secondary Offering on 9/13/21 while perched at its all-time high, very extended from any sound base.
>>> FEATURED STOCK ARTICLE : Steady Progress Made Since Featured - 8/27/2021 |
View all notes |
Set NEW NOTE alert |
Company Profile |
SEC
News |
Chart |
Request a new note
C
A
S
I |
MIME
-
NASDAQ
Mimecast Limited
Computer Sftwr-Security
|
$63.40
|
-1.66
-2.55% |
$64.75
|
401,285
39.26% of 50 DAV
50 DAV is 1,022,000
|
$71.45
-11.27%
|
8/2/2021
|
$56.12
|
PP = $59.58
|
|
MB = $62.56
|
Most Recent Note - 9/28/2021 5:12:16 PM
G - Volume totals have been cooling while consolidating above its 50 DMA line ($62.70) and prior highs in the $59 area defining near-term support to watch. Fundamentals remain strong.
>>> FEATURED STOCK ARTICLE : Consolidating After Getting Extended from Previous Base Noted - 9/21/2021 |
View all notes |
Set NEW NOTE alert |
Company Profile |
SEC
News |
Chart |
Request a new note
C
A
S
I |