You are not logged in.
This means you
CAN ONLY VIEW reports that were published prior to Friday, March 21, 2025.
You
MUST UPGRADE YOUR MEMBERSHIP if you want to see any current reports.
AFTER MARKET UPDATE - WEDNESDAY, JULY 31ST, 2019
Previous After Market Report Next After Market Report >>>
|
|
|
|
DOW |
-333.75 |
26,864.27 |
-1.23% |
|
Volume |
1,253,341,640 |
+62% |
|
Volume |
2,671,392,190 |
+43% |
|
NASDAQ |
-99.31 |
8,174.30 |
-1.20% |
|
Advancers |
1,031 |
36% |
|
Advancers |
1,040 |
33% |
|
S&P 500 |
-32.80 |
2,980.38 |
-1.09% |
|
Decliners |
1,808 |
64% |
|
Decliners |
2,064 |
66% |
|
Russell 2000 |
-10.99 |
1,574.61 |
-0.69% |
|
52 Wk Highs |
319 |
|
|
52 Wk Highs |
146 |
|
|
S&P 600 |
-4.30 |
963.40 |
-0.44% |
|
52 Wk Lows |
50 |
|
|
52 Wk Lows |
78 |
|
|
 |
Major Indices Pulled Back After Small Cut in Fed's Rate Target
Kenneth J. Gruneisen - Passed the CAN SLIM® Master's Exam
The Dow slumped 333 points, posting its worst session since May, while the S&P 500 lost 1.1%. The Nasdaq Composite was down 1.2%. The major averages still notched solid monthly gains, with the Dow rising 1%, the S&P 500 climbing 1.3%, and the Nasdaq rallying 2.1% in July. Wednesday's volume totals reported were higher than the prior session totals on the NYSE and on the Nasdaq exchange, indicative of distributional pressure. Decliners led advancers by a 9-5 margin on the NYSE and a 2-1 margin on the Nasdaq exchange. There were 68 high-ranked companies from the Leaders List hit new 52-week highs and were listed on the BreakOuts Page, versus the total of 48 on the prior session. New 52-week highs totals expanded and outnumbered new 52-week lows totals on the NYSE and on the Nasdaq exchange. The major indices (M criteria) are in a "confirmed uptrend" under the fact-based system. The Featured Stocks Page provides the most timely analysis on high-ranked leaders.Charts used courtesy of www.stockcharts.com
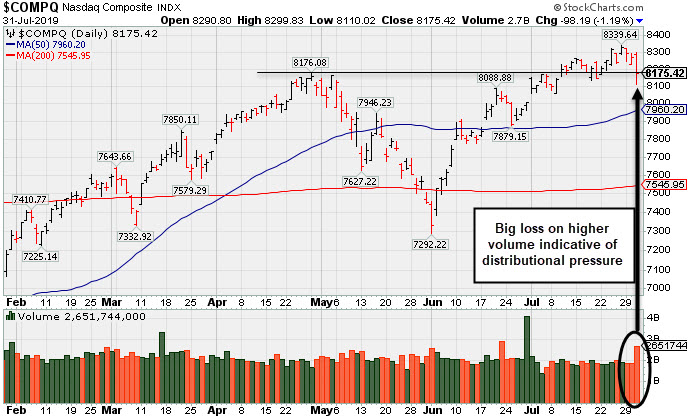
PICTURED: The Nasdaq Composite Index suffered a big loss on higher volume indicative of distributional pressure. It stalled after recently reaching a new record high.
Stocks finished firmly lower Wednesday, as investors assessed the Federal Reserve’s policy decision. Investor attention was squarely on the Fed, with policymakers opting to reduce the benchmark interest rate by 0.25% to a target range of 2.00% - 2.25%, marking the first cut in more than a decade. In the post-meeting press conference, Fed Chair Jerome Powell referred to the move as a “mid-cycle adjustment,” indicating future easing was not guaranteed. Treasuries were mixed, with the yield on the 10-year note down four basis points to 2.01% and the yield on the two-year note up two basis points to 1.87%.
In earnings, Apple (AAPL +2.04%) rose after the iPhone maker topped analyst estimates and provided a positive revenue outlook. General Electric (GE -0.67%) edged lower despite boosting its full-year guidance. Advanced Micro Devices (AMD -10.10%) sank after offering a disappointing revenue forecast.
On the data front, the ADP reported private payrolls increased by 156,000 this month after rising 112,000 in June. In commodities, WTI crude gained 0.9% to $58.58/barrel following a seventh consecutive weekly drawdown in U.S. stockpiles. COMEX gold slipped 1.2% to $1,412.90/ounce as the U.S. dollar touched its best level in more than two years. On the trade front, in-person talks between the U.S. and China concluded with no meaningful breakthroughs, though they agreed to reconvene in September.
|
 Kenneth J. Gruneisen started out as a licensed stockbroker in August 1987, a couple of months prior to the historic stock market crash that took the Dow Jones Industrial Average down -22.6% in a single day. He has published daily fact-based fundamental and technical analysis on high-ranked stocks online for two decades. Through FACTBASEDINVESTING.COM, Kenneth provides educational articles, news, market commentary, and other information regarding proven investment systems that work in good times and bad.
Comments contained in the body of this report are technical opinions only and are not necessarily those of Gruneisen Growth Corp. The material herein has been obtained from sources believed to be reliable and accurate, however, its accuracy and completeness cannot be guaranteed. Our firm, employees, and customers may effect transactions, including transactions contrary to any recommendation herein, or have positions in the securities mentioned herein or options with respect thereto. Any recommendation contained in this report may not be suitable for all investors and it is not to be deemed an offer or solicitation on our part with respect to the purchase or sale of any securities. |
|
 |
Gold & Silver and Semiconductor Indexes Led Group Decliners
Kenneth J. Gruneisen - Passed the CAN SLIM® Master's Exam
The Broker/Dealer Index ($XBD -0.23%) and the Bank Index ($BKX -0.28%) both edged lower while the Retail Index ($RLX -1.36%) suffered a larger loss. The Semiconductor Index ($SOX -3.22%) led the tech sector lower, meanwhile the Biotech Index ($BTK -0.88%) and the Networking Index ($NWX -0.78%) suffered smaller losses. The Gold & Silver Index ($XAU -5.00%) was a standout decliner while the Integrated Oil Index ($XOI -0.60%) edged lower, meanwhile the Oil Services Index ($OSX +0.72%) was a standout gainer.
Charts courtesy of www.stockcharts.com
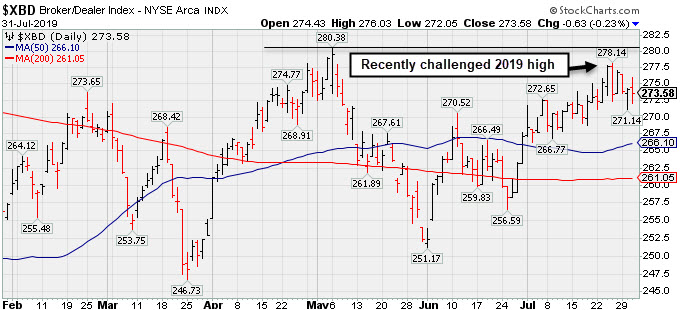
PICTURED: The Broker/Dealer Index ($XBD -0.23%) recently challenged its 2019 high.
| Oil Services |
$OSX |
79.41 |
+0.57 |
+0.72% |
-1.48% |
| Integrated Oil |
$XOI |
1,258.43 |
-7.60 |
-0.60% |
+8.57% |
| Semiconductor |
$SOX |
1,542.44 |
-51.38 |
-3.22% |
+33.52% |
| Networking |
$NWX |
598.65 |
-4.72 |
-0.78% |
+22.51% |
| Broker/Dealer |
$XBD |
273.58 |
-0.63 |
-0.23% |
+15.27% |
| Retail |
$RLX |
2,368.01 |
-32.55 |
-1.36% |
+21.35% |
| Gold & Silver |
$XAU |
87.64 |
-4.60 |
-4.99% |
+24.03% |
| Bank |
$BKX |
102.02 |
-0.29 |
-0.28% |
+18.92% |
| Biotech |
$BTK |
4,657.70 |
-41.23 |
-0.88% |
+10.35% |
|
|
|
 |
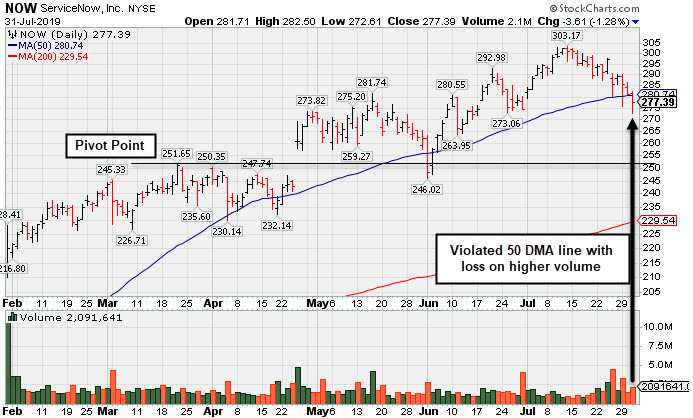
Slumped Below 50-Day Average With Loss on Higher Volume
Kenneth J. Gruneisen - Passed the CAN SLIM® Master's Exam
ServiceNow Inc (NOW -$3.61 or -1.28% to $277.39) slumped to a close below its 50-day moving average (DMA) line ($280) with today's loss on higher volume raising concerns. It also undercut its 7/29/19 low ($275.59) yet rebounded to end the session in the middle of its intra-day range.
Last week it reported earnings +45% on +32% sales revenues for the Jun '19 quarter, above the +25% minimum earnings guideline (C criteria). That was a welcome improvement after earnings rose +20% on +34% sales revenues for the Mar '19 quarter..
NOW was last shown in this FSU section on 6/26/19 with an annotated graph under the headline, "Pulling Back After Wedging to New Highs". It was highlighted in yellow with pivot point cited based on its 9/13/18 high plus 10 cents when highlighted in the 1/31/19 mid-day report (read here) as it triggered a technical buy signal with a big "breakaway gap". Bullish action came after it reported earnings +79% on +30% sales revenues for the Dec '18 quarter. Prior quarterly comparisons were above the +25% minimum earnings guideline.
Annual earnings (A criteria) growth has been strong since FY '15. It has an Earnings Per Share Rating of 97. The Computer Software - Enterprise group has a Group Relative Strength Rating of 98, a reassuring sign concerning the L criteria.
The number of top-rated funds owning its shares rose from 1,030 in Jun '17 to 1,637 in Mar '19, a reassuring sign concerning the I criteria. It has a Timeliness Rating of A and a Sponsorship Rating of B. However, its current Up/Down Volume Ratio of 0.9 is an unbiased indication its shares have faced mild distributional pressure over the past 50 days.
|
|
|
Color Codes Explained :
Y - Better candidates highlighted by our
staff of experts.
G - Previously featured
in past reports as yellow but may no longer be buyable under the
guidelines.
***Last / Change / Volume data in this table is the closing quote data***
Symbol/Exchange
Company Name
Industry Group |
PRICE |
CHANGE
(%Change) |
Day High |
Volume
(% DAV)
(% 50 day avg vol) |
52 Wk Hi
% From Hi |
Featured
Date |
Price
Featured |
Pivot Featured |
|
Max Buy |
 SPSC
-
NASDAQ
SPSC
-
NASDAQ
S P S Commerce Inc
COMPUTER SOFTWARE and SERVICES - Application Software
|
$111.83
|
-1.57
-1.38% |
$115.25
|
141,223
102.34% of 50 DAV
50 DAV is 138,000
|
$118.28
-5.45%
|
6/7/2019
|
$107.72
|
PP = $115.10
|
|
MB = $120.86
|
Most Recent Note - 7/26/2019
Y - Color code is changed to yellow after gapping up above its 50 DMA line ($103.95) helping its outlook improve. Touched a new high earlier with today's big volume-driven gain, and a strong close above the pivot point may clinch a convincing new (or add-on) technical buy signal. Reported earnings +22% on +12% sales revenues for the Jun '19 quarter, slightly under the +25% minimum earnings guideline (C criteria), raising fundamental concerns.
>>> FEATURED STOCK ARTICLE : Recently Sputtering Below 50-Day Moving Average - 7/9/2019 |
View all notes |
Set NEW NOTE alert |
Company Profile |
SEC
News |
Chart |
Request a new note
C
A
S
I |
EPAM
-
NYSE
Epam Systems Inc
COMPUTER SOFTWARE and SERVICES - Information Technology Service
|
$193.79
|
-3.69
-1.87% |
$199.00
|
418,577
85.25% of 50 DAV
50 DAV is 491,000
|
$201.00
-3.59%
|
5/9/2019
|
$169.25
|
PP = $180.55
|
|
MB = $189.58
|
Most Recent Note - 7/30/2019 4:37:45 PM
G - Perched at its 52-week high with volume-totals cooling after getting very extended from any sound base. Due to report earnings news before the open on Thursday, August 8, 2019. Prior highs in the $179-180 area coincide with its 50 DMA line ($180) defining important support.
>>> FEATURED STOCK ARTICLE : Winning Streak Leaves IT Firm Extended From Prior Base - 7/12/2019 |
View all notes |
Set NEW NOTE alert |
Company Profile |
SEC
News |
Chart |
Request a new note
C
A
S
I |
AUDC
-
NASDAQ
Audiocodes Ltd
ELECTRONICS - Scientific and Technical Instrum
|
$18.66
|
-0.77
-3.96% |
$19.54
|
308,531
178.34% of 50 DAV
50 DAV is 173,000
|
$19.74
-5.47%
|
7/15/2019
|
$17.10
|
PP = $17.54
|
|
MB = $18.42
|
 Most Recent Note - 7/31/2019 6:15:28 PM
G - Retreated from its all-time high with higher volume behind today's loss. Bullish action came after it recently reported earnings +57% on +14% sales revenues for the Jun '19 quarter, continuing its strong earnings track record. Big gain 7/23/19 and strong close above the pivot point was backed by 11 times average volume triggered a technical buy signal. Prior highs in the $17 area define initial support above its 50 DMA line ($16).
>>> FEATURED STOCK ARTICLE : Posted a Gain With Average Volume for Best Ever Close - 7/15/2019 |
View all notes |
Set NEW NOTE alert |
Company Profile |
SEC
News |
Chart |
Request a new note
C
A
S
I |
ENV
-
NYSE
Envestnet Inc
FINANCIAL SERVICES - Diversified Investments
|
$71.41
|
-0.08
-0.11% |
$72.92
|
273,401
103.95% of 50 DAV
50 DAV is 263,000
|
$73.94
-3.42%
|
3/15/2019
|
$66.05
|
PP = $64.90
|
|
MB = $68.15
|
Most Recent Note - 7/30/2019 4:34:15 PM
G - Pulled back from its 52-week high. Its 50 DMA ($69.62) line defines support above prior lows in the $65-66 area. Due to report second quarter financial results on Wednesday, August 7, 2019 after the close. Fundamental concerns were raised after it reported earnings +5% on +1% sales revenues for the Mar '19 quarter, below the +25% minimum earnings guideline (C criteria).
>>> FEATURED STOCK ARTICLE : Rebounded Above 50-Day Moving Average Line - 7/2/2019 |
View all notes |
Set NEW NOTE alert |
Company Profile |
SEC
News |
Chart |
Request a new note
C
A
S
I |
LHCG
-
NASDAQ
L H C Group Inc
HEALTH SERVICES - Home Health Care
|
$126.58
|
+0.00
0.00% |
$129.37
|
213,394
98.79% of 50 DAV
50 DAV is 216,000
|
$128.31
-1.35%
|
7/1/2019
|
$110.94
|
PP = $122.20
|
|
MB = $128.31
|
Most Recent Note - 7/30/2019 4:14:40 PM
Y - Posted a gain today with near average volume for a best ever close challenging its all-time high. Recent gains above its pivot point were not backed by the +40% above average volume needed to trigger a proper new (or add-on) technical buy signal. Its 50 DMA line ($118.76) defines near-term support above recent lows. Fundamentals remain strong.
>>> FEATURED STOCK ARTICLE : Consolidating Following a Negative Reversal at High - 7/22/2019 |
View all notes |
Set NEW NOTE alert |
Company Profile |
SEC
News |
Chart |
Request a new note
C
A
S
I |
Symbol/Exchange
Company Name
Industry Group |
PRICE |
CHANGE
(%Change) |
Day High |
Volume
(% DAV)
(% 50 day avg vol) |
52 Wk Hi
% From Hi |
Featured
Date |
Price
Featured |
Pivot Featured |
|
Max Buy |
ENSG
-
NASDAQ
Ensign Group Inc
HEALTH SERVICES - Long-Term Care Facilities
|
$60.26
|
+0.03
0.05% |
$63.00
|
429,022
166.93% of 50 DAV
50 DAV is 257,000
|
$60.37
-0.18%
|
4/30/2019
|
$51.46
|
PP = $53.30
|
|
MB = $55.97
|
Most Recent Note - 7/30/2019 4:30:21 PM
G - Due to report financial results after the close on Thursday, August 1, 2019. Volume and volatility often increase near earnings news. Perched at its all-time high following 6 consecutive small gains. Its 50 DMA line ($56.55) and recent low ($52.34 on 5/31/19) define near-term support to watch.
>>> FEATURED STOCK ARTICLE : Nursing Facility Operator Touched New High - 7/1/2019 |
View all notes |
Set NEW NOTE alert |
Company Profile |
SEC
News |
Chart |
Request a new note
C
A
S
I |
CHDN
-
NASDAQ
Churchill Downs Inc
LEISURE - Gaming Activities
|
$119.65
|
-3.06
-2.49% |
$122.78
|
479,378
183.67% of 50 DAV
50 DAV is 261,000
|
$123.05
-2.76%
|
7/22/2019
|
$118.45
|
PP = $118.89
|
|
MB = $124.83
|
Most Recent Note - 7/31/2019 6:20:09 PM
Y - Pulled back today with above average volume, retreating after 3 consecutive gains marked by light volume as it hit new all-time highs. Reported after the market close Jun '19 earnings rose +10% on +26% sales revenues versus the year ago period. Volume and volatility often increase near earnings news. Its 50 DMA line ($112) and prior low ($108.57 on 6/25/19) define important near-term support to watch.
>>> FEATURED STOCK ARTICLE : Volume Light While Hovering at Record High - 7/16/2019 |
View all notes |
Set NEW NOTE alert |
Company Profile |
SEC
News |
Chart |
Request a new note
C
A
S
I |
WWD
-
NASDAQ
Woodward Inc
MANUFACTURING - Diversified Machinery
|
$112.04
|
-2.77
-2.41% |
$115.10
|
417,956
81.47% of 50 DAV
50 DAV is 513,000
|
$119.20
-6.01%
|
6/18/2019
|
$112.34
|
PP = $114.65
|
|
MB = $120.38
|
Most Recent Note - 7/31/2019 6:22:21 PM
G - Color code is changed to green after violating its 50 DMA line ($113.50) with a big loss today on higher (but below average) volume. Subsequent gains for new highs backed by at least +40% above average volume may clinch a convincing technical buy signal. Due to report financial results after the close on Monday, August 5, 2019. Volume and volatility often increase near earnings news.
>>> FEATURED STOCK ARTICLE : Perched Near All-Time High After Gains Lacking Great Volume - 7/24/2019 |
View all notes |
Set NEW NOTE alert |
Company Profile |
SEC
News |
Chart |
Request a new note
C
A
S
I |
LULU
-
NASDAQ
Lululemon Athletica
MANUFACTURING - Textile Manufacturing
|
$191.09
|
-0.68
-0.35% |
$194.25
|
1,253,433
59.35% of 50 DAV
50 DAV is 2,112,000
|
$193.71
-1.35%
|
6/13/2019
|
$174.48
|
PP = $179.60
|
|
MB = $188.58
|
Most Recent Note - 7/30/2019 4:40:10 PM
G - Volume totals have been cooling while hovering near its all-time high, stubbornly holding its ground. Its 50 DMA line ($180) defines important near-term support. Reported Apr '19 quarterly earnings +35% on +20% sales revenues versus the year ago period.
>>> FEATURED STOCK ARTICLE : Quietly Hovering at All-Time High - 7/17/2019 |
View all notes |
Set NEW NOTE alert |
Company Profile |
SEC
News |
Chart |
Request a new note
C
A
S
I |
ULTA
-
NASDAQ
Ulta Beauty Inc
SPECIALTY RETAIL - Specialty Retail, Other
|
$349.25
|
+0.62
0.18% |
$354.00
|
521,088
69.20% of 50 DAV
50 DAV is 753,000
|
$368.83
-5.31%
|
3/15/2019
|
$341.27
|
PP = $322.59
|
|
MB = $338.72
|
Most Recent Note - 7/26/2019 6:15:54 PM
G - Volume totals have been cooling while hovering near its all-time high. Its 50 DMA line ($346.61) defines near-term support to watch. Reported earnings +17% on +13% sales revenues for the Apr '19 quarter, below the +25% minimum earnings guideline (C criteria), raising fundamental concerns.
>>> FEATURED STOCK ARTICLE : Stalled After Recently Wedging to New Record High - 7/5/2019 |
View all notes |
Set NEW NOTE alert |
Company Profile |
SEC
News |
Chart |
Request a new note
C
A
S
I |
Symbol/Exchange
Company Name
Industry Group |
PRICE |
CHANGE
(%Change) |
Day High |
Volume
(% DAV)
(% 50 day avg vol) |
52 Wk Hi
% From Hi |
Featured
Date |
Price
Featured |
Pivot Featured |
|
Max Buy |
CHGG
-
NYSE
Chegg Inc
Consumer Svcs-Education
|
$44.92
|
-0.85
-1.86% |
$46.04
|
2,249,266
150.96% of 50 DAV
50 DAV is 1,490,000
|
$48.22
-6.84%
|
7/8/2019
|
$44.11
|
PP = $41.79
|
|
MB = $43.88
|
Most Recent Note - 7/30/2019 4:02:17 PM
G - Gapped up today and rallied for a new high with heavy volume and its color code was changed to green after getting extended from the prior base. Prior highs in the $40-41 area define important support to watch above its 50 DMA line. Reported earnings +92% on +26% sales revenues for the Jun '19 quarter.
>>> FEATURED STOCK ARTICLE : Tallied a Big Volume-Driven Breakout Gain for a New High - 7/8/2019 |
View all notes |
Set NEW NOTE alert |
Company Profile |
SEC
News |
Chart |
Request a new note
C
A
S
I |
NOW
-
NYSE
Servicenow Inc
Computer Sftwr-Enterprse
|
$277.39
|
-3.61
-1.28% |
$282.50
|
2,091,641
132.80% of 50 DAV
50 DAV is 1,575,000
|
$303.17
-8.50%
|
4/22/2019
|
$242.64
|
PP = $251.75
|
|
MB = $264.34
|
Most Recent Note - 7/31/2019 6:32:35 PM
G - Sank below its 50 DMA line ($281) with today's loss on higher volume raising concerns and triggering a technical sell signal. Last week it reported earnings +45% on +32% sales revenues for the Jun '19 quarter, above the +25% minimum earnings guideline (C criteria). See the latest FSU analysis for more details and a new annotated graph.
>>> FEATURED STOCK ARTICLE : Slumped Below 50-Day Average With Loss on Higher Volume - 7/31/2019 |
View all notes |
Set NEW NOTE alert |
Company Profile |
SEC
News |
Chart |
Request a new note
C
A
S
I |
VEEV
-
NYSE
Veeva Systems Inc Cl A
Computer Sftwr-Medical
|
$165.90
|
+4.17
2.58% |
$168.12
|
1,803,324
110.57% of 50 DAV
50 DAV is 1,631,000
|
$176.90
-6.22%
|
5/30/2019
|
$154.32
|
PP = $145.80
|
|
MB = $153.09
|
Most Recent Note - 7/31/2019 6:27:42 PM
G - Posted a gain with average volume today after testing its 50 DMA line ($162) with volume-driven losses. That important short-term average defines near-term support above the prior low ($155 on 6/27/19). Fundamentals remain strong.
>>> FEATURED STOCK ARTICLE : Halted Slide After 4 Volume-Driven Losses From High - 6/27/2019 |
View all notes |
Set NEW NOTE alert |
Company Profile |
SEC
News |
Chart |
Request a new note
C
A
S
I |
PAYC
-
NYSE
Paycom Software Inc
COMPUTER SOFTWARE and SERVICES - Application Software
|
$240.75
|
+12.13
5.31% |
$246.04
|
1,906,143
275.06% of 50 DAV
50 DAV is 693,000
|
$246.85
-2.47%
|
2/6/2019
|
$171.66
|
PP = $164.18
|
|
MB = $172.39
|
Most Recent Note - 7/31/2019 1:15:36 PM
G - Reported earnings +27% on +31% sales revenues for the Jun '19 quarter, continuing its strong earnings track record. Gapped up today challenging its all-time high, however it is extended from any sound base. Volume and volatility often increase near earnings news. Found support at its 50 DMA line during consolidations throughout this year's ongoing ascent.
>>> FEATURED STOCK ARTICLE : Perched Near High Extended From Any Sound Base - 6/28/2019 |
View all notes |
Set NEW NOTE alert |
Company Profile |
SEC
News |
Chart |
Request a new note
C
A
S
I |
PYPL
-
NASDAQ
Paypal Holdings Inc
Finance-CrdtCard/PmtPr
|
$110.40
|
-1.64
-1.46% |
$112.30
|
9,981,160
168.32% of 50 DAV
50 DAV is 5,930,000
|
$121.48
-9.12%
|
1/24/2019
|
$92.56
|
PP = $93.80
|
|
MB = $98.49
|
Most Recent Note - 7/29/2019 12:36:47 PM
G - Slumping further below its 50 DMA line ($115.22) and undercutting the prior low ($113.08 on 6/27/19) with above average volume behind today's loss raising greater concerns. A prompt rebound above the 50 DMA line is needed for its outlook to improve. Reported Jun '19 quarterly earnings +48% on +12% sales revenues versus the year ago period.
>>> FEATURED STOCK ARTICLE : Perched Near Record High Ahead of Earnings News - 7/23/2019 |
View all notes |
Set NEW NOTE alert |
Company Profile |
SEC
News |
Chart |
Request a new note
C
A
S
I |
Symbol/Exchange
Company Name
Industry Group |
PRICE |
CHANGE
(%Change) |
Day High |
Volume
(% DAV)
(% 50 day avg vol) |
52 Wk Hi
% From Hi |
Featured
Date |
Price
Featured |
Pivot Featured |
|
Max Buy |
PLNT
-
NYSE
Planet Fitness Inc Cl A
Leisure-Services
|
$78.66
|
-0.04
-0.05% |
$79.46
|
822,952
54.36% of 50 DAV
50 DAV is 1,514,000
|
$81.90
-3.96%
|
7/26/2019
|
$79.15
|
PP = $82.00
|
|
MB = $86.10
|
Most Recent Note - 7/26/2019 5:41:58 PM
Y - Volume was light behind 3 consecutive gains as it rebounded above its 50 DMA line ($76.72). Color code is changed to yellow with new pivot point cited based on its 6/18/19 high plus 10 cents. Volume-driven gains above the pivot point are needed to trigger a new (or add-on) technical buy signal. See the latest FSU analysis for more details and a new annotated graph.
>>> FEATURED STOCK ARTICLE : Fitness Firm Forming a New Base - 7/26/2019 |
View all notes |
Set NEW NOTE alert |
Company Profile |
SEC
News |
Chart |
Request a new note
C
A
S
I |
BLD
-
NYSE
Topbuild Corp
Bldg-Constr Prds/Misc
|
$81.13
|
-0.93
-1.13% |
$83.45
|
435,976
146.79% of 50 DAV
50 DAV is 297,000
|
$86.96
-6.70%
|
5/17/2019
|
$82.19
|
PP = $87.31
|
|
MB = $91.68
|
Most Recent Note - 7/30/2019 4:20:09 PM
Y - Due to report earnings news prior to the open on 8/01/19. Volume and volatility often increase near earnings news. Consolidating above its 50 DMA line ($80.55). Subsequent gains above the pivot point backed by at least +40% above average volume may trigger a technical buy signal.
>>> FEATURED STOCK ARTICLE : Perched Near 52-Week High Finding Support - 7/25/2019 |
View all notes |
Set NEW NOTE alert |
Company Profile |
SEC
News |
Chart |
Request a new note
C
A
S
I |
TEAM
-
NASDAQ
Atlassian Corp Plc Cl A
Comp Sftwr-Spec Enterprs
|
$140.12
|
+3.12
2.28% |
$141.98
|
2,047,115
157.47% of 50 DAV
50 DAV is 1,300,000
|
$149.80
-6.46%
|
5/24/2019
|
$129.52
|
PP = $132.09
|
|
MB = $138.69
|
Most Recent Note - 7/31/2019 6:26:37 PM
G - Posted a gain with higher volume today. Color code is changed to green after rising back above its "max buy" level. The 50 DMA line ($132.287) and prior low ($123.43 on 6/25/19) define important near-term support to watch where violations would raise concerns and trigger technical sell signals. Reported earnings +43% on +36% sales revenues for the Jun '19 quarter, continuing its strong earnings track record.
>>> FEATURED STOCK ARTICLE : Abrupt Retreat After Getting Very Extended From Prior Base - 7/29/2019 |
View all notes |
Set NEW NOTE alert |
Company Profile |
SEC
News |
Chart |
Request a new note
C
A
S
I |
GLOB
-
NYSE
Globant SA
Computer-Tech Services
|
$106.00
|
-1.00
-0.93% |
$109.38
|
446,057
106.20% of 50 DAV
50 DAV is 420,000
|
$111.87
-5.25%
|
2/15/2019
|
$69.35
|
PP = $70.00
|
|
MB = $73.50
|
Most Recent Note - 7/30/2019 4:13:00 PM
G - Pulled back from its all-time high today with light volume following 4 consecutive gains with below average volume. Very extended from any sound base. Its 50 DMA line ($100) defines important support to watch on pullbacks. Fundamentals remain strong.
>>> FEATURED STOCK ARTICLE : Extended From Any Sound Base After Wedging Higher - 7/11/2019 |
View all notes |
Set NEW NOTE alert |
Company Profile |
SEC
News |
Chart |
Request a new note
C
A
S
I |
TTD
-
NASDAQ
The Trade Desk Inc Cl A
Comml Svcs-Advertising
|
$263.31
|
-1.82
-0.69% |
$271.53
|
1,164,071
80.50% of 50 DAV
50 DAV is 1,446,000
|
$279.71
-5.86%
|
7/18/2019
|
$240.61
|
PP = $258.10
|
|
MB = $271.01
|
Most Recent Note - 7/29/2019 12:57:34 PM
Y - Encountering distributional pressure and abruptly retreating from its all-time high with today's volume-driven loss after 3 consecutive gains. The prior gain above the pivot point was backed by +80% above average volume and triggered a technical buy signal. Prior high ($258) defines initial support to watch above its 50 DMA line ($232.77). Reported earnings +44% on +41% sales revenues for the Mar '19 quarter, continuing its strong earnings track record.
>>> FEATURED STOCK ARTICLE : Endured Distributional Pressure While Building on New Base - 7/18/2019 |
View all notes |
Set NEW NOTE alert |
Company Profile |
SEC
News |
Chart |
Request a new note
C
A
S
I |
Symbol/Exchange
Company Name
Industry Group |
PRICE |
CHANGE
(%Change) |
Day High |
Volume
(% DAV)
(% 50 day avg vol) |
52 Wk Hi
% From Hi |
Featured
Date |
Price
Featured |
Pivot Featured |
|
Max Buy |
PAGS
-
NYSE
Pagseguro Digital Cl A
Finance-CrdtCard/PmtPr
|
$43.48
|
-0.96
-2.16% |
$45.30
|
3,447,702
157.00% of 50 DAV
50 DAV is 2,196,000
|
$48.88
-11.05%
|
6/25/2019
|
$37.69
|
PP = $40.07
|
|
MB = $42.07
|
Most Recent Note - 7/30/2019 6:00:57 PM
G - Down considerably with above average volume today, retreating from its all-time high after getting very extended from any sound base. Prior high in the $40 area defines initial support to watch above its 50 DMA line ($38.62). See the latest FSU analysis for more details and a new annotated graph.
>>> FEATURED STOCK ARTICLE : Encountering Distributional Pressure After Impressive Sprint - 7/30/2019 |
View all notes |
Set NEW NOTE alert |
Company Profile |
SEC
News |
Chart |
Request a new note
C
A
S
I |
|
|
|
THESE ARE NOT BUY RECOMMENDATIONS!
Comments contained in the body of this report are technical
opinions only. The material herein has been obtained
from sources believed to be reliable and accurate, however,
its accuracy and completeness cannot be guaranteed.
This site is not an investment advisor, hence it does
not endorse or recommend any securities or other investments.
Any recommendation contained in this report may not
be suitable for all investors and it is not to be deemed
an offer or solicitation on our part with respect to
the purchase or sale of any securities. All trademarks,
service marks and trade names appearing in this report
are the property of their respective owners, and are
likewise used for identification purposes only.
This report is a service available
only to active Paid Premium Members.
You may opt-out of receiving report notifications
at any time. Questions or comments may be submitted
by writing to Premium Membership Services 665 S.E. 10 Street, Suite 201 Deerfield Beach, FL 33441-5634 or by calling 1-800-965-8307
or 954-785-1121.
|
|
|