You are not logged in.
This means you
CAN ONLY VIEW reports that were published prior to Thursday, March 20, 2025.
You
MUST UPGRADE YOUR MEMBERSHIP if you want to see any current reports.
AFTER MARKET UPDATE - TUESDAY, JULY 2ND, 2019
Previous After Market Report Next After Market Report >>>
|
|
|
|
DOW |
+69.25 |
26,786.68 |
+0.26% |
|
Volume |
733,382,090 |
-9% |
|
Volume |
1,929,005,519 |
-12% |
|
NASDAQ |
+17.93 |
8,109.09 |
+0.22% |
|
Advancers |
1,575 |
55% |
|
Advancers |
1,340 |
43% |
|
S&P 500 |
+8.68 |
2,973.01 |
+0.29% |
|
Decliners |
1,307 |
45% |
|
Decliners |
1,741 |
56% |
|
Russell 2000 |
-9.13 |
1,560.54 |
-0.58% |
|
52 Wk Highs |
155 |
|
|
52 Wk Highs |
101 |
|
|
S&P 600 |
-6.37 |
948.46 |
-0.67% |
|
52 Wk Lows |
30 |
|
|
52 Wk Lows |
58 |
|
|
 |
Less Leadership as Major Indices Rose
Kenneth J. Gruneisen - Passed the CAN SLIM® Master's Exam
The Dow added 69 points, while the S&P 500 gained 0.3%. The Nasdaq Composite was up 0.2%. The volume totals reported were lighter on the NYSE and on the Nasdaq exchange. Advancers led decliners by an 8-7 margin on the NYSE but decliners led advancers by about 4-3 on the Nasdaq exchange. There were 54 high-ranked companies from the Leaders List hit new 52-week highs and were listed on the BreakOuts Page, less than half of the total of 112 on the prior session. While new 52-week highs totals contracted they still easily outnumbered new 52-week lows on the NYSE and Nasdaq exchange. The major indices (M criteria) are in a "confirmed uptrend" under the fact-based system. The Featured Stocks Page provides the most timely analysis on high-ranked leaders. Charts used courtesy of www.stockcharts.com
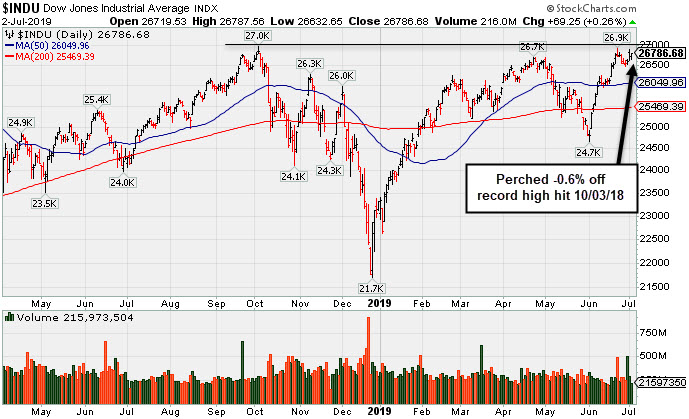
PICTURED: The Dow Jones Industrial Average posted a 3rd consecutive gain and ended perched -0.6% off its record high hit on 10/03/18.
Stocks fluctuated Tuesday, with the S&P 500 eking out another record close. Positive sentiment surrounding last weekend’s U.S.-China trade truce appeared to fade, though trade remained in focus. Washington is now considering additional tariffs on $4 billion of imports from the European Union, as part of a lingering dispute over aircraft subsidies. Meanwhile, President Trump reportedly said Monday that renewed negotiations with China have “already begun” since the G-20 summit sideline talks.
Treasuries rallied despite no notable economic releases, with the yield on the 10-year note down four basis points to 1.98%. U.S. government bond yields tracked U.K. rates lower following dovish comments from Bank of England Governor Carney. Following Thursday’s Fourth of July holiday, Friday’s non-farm payrolls report will likely garner attention, with 164,000 jobs expected to have been added in June, well above May’s disappointing 75,000 figure. This will follow Wednesday’s ADP report, which is anticipated to reveal 140,000 jobs were added in the private sector in June, bouncing back from the prior month’s 27,000 number.
Seven of 11 S&P 500 sectors closed in positive territory, with Real Estate, Utilities, and Communication Services jumping more than 1%. Energy shares lagged, with WTI crude reversing course from Monday’s five-week high, slumping -4.8% to $56.25/barrel amid renewed concerns of a slowdown in global demand. S&P 500 trading volume was roughly 12% below the 30-day average. COMEX gold climbed 1.9% to $1,415.70/ounce, rebounding from Monday’s largest one-day decline in over two years.
|
 Kenneth J. Gruneisen started out as a licensed stockbroker in August 1987, a couple of months prior to the historic stock market crash that took the Dow Jones Industrial Average down -22.6% in a single day. He has published daily fact-based fundamental and technical analysis on high-ranked stocks online for two decades. Through FACTBASEDINVESTING.COM, Kenneth provides educational articles, news, market commentary, and other information regarding proven investment systems that work in good times and bad.
Comments contained in the body of this report are technical opinions only and are not necessarily those of Gruneisen Growth Corp. The material herein has been obtained from sources believed to be reliable and accurate, however, its accuracy and completeness cannot be guaranteed. Our firm, employees, and customers may effect transactions, including transactions contrary to any recommendation herein, or have positions in the securities mentioned herein or options with respect thereto. Any recommendation contained in this report may not be suitable for all investors and it is not to be deemed an offer or solicitation on our part with respect to the purchase or sale of any securities. |
|
 |
Gold & Silver Index Rose, Energy-Linked Groups Fell
Kenneth J. Gruneisen - Passed the CAN SLIM® Master's Exam
The Retail Index ($RLX +0.35%) edged higher while the Broker/Dealer Index ($XBD -0.28%) and Bank Index ($BKX -0.93%) both ended the session lower. The Semiconductor Index ($SOX -1.38%) and Biotech Index ($BTK -0.24%) both ended lower while the Networking Index ($NWX +0.30%) posted a small gain. Commodity-linked groups were decisively mixed as the Gold & Silver Index ($XAU +3.24%) posted a big gain while the Oil Services Index ($OSX -2.98%) and the Integrated Oil Index ($XOI -1.69%) both ended solidly lower.
Charts courtesy of www.stockcharts.com
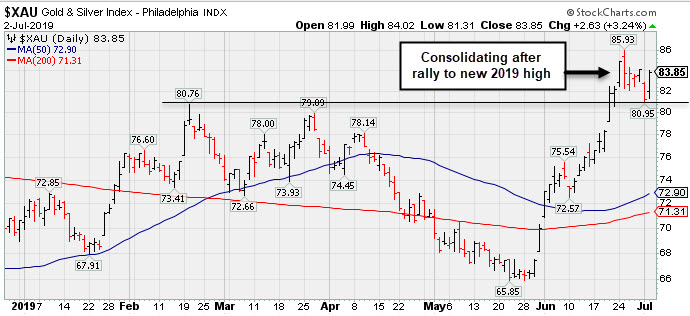 PICTURED: The Gold & Silver Index ($XAU +3.24%) posted a big gain while consolidating after rallying to a new 2019 high.
| Oil Services |
$OSX |
79.32 |
-2.44 |
-2.98% |
-1.59% |
| Integrated Oil |
$XOI |
1,256.14 |
-21.63 |
-1.69% |
+8.37% |
| Semiconductor |
$SOX |
1,476.83 |
-20.72 |
-1.38% |
+27.85% |
| Networking |
$NWX |
575.83 |
+1.71 |
+0.30% |
+17.84% |
| Broker/Dealer |
$XBD |
267.69 |
-0.76 |
-0.28% |
+12.79% |
| Retail |
$RLX |
2,398.49 |
+8.44 |
+0.35% |
+22.91% |
| Gold & Silver |
$XAU |
83.85 |
+2.63 |
+3.24% |
+18.67% |
| Bank |
$BKX |
98.10 |
-0.92 |
-0.93% |
+14.35% |
| Biotech |
$BTK |
4,795.56 |
-11.30 |
-0.24% |
+13.62% |
|
|
|
 |
Rebounded Above 50-Day Moving Average Line
Kenneth J. Gruneisen - Passed the CAN SLIM® Master's Exam
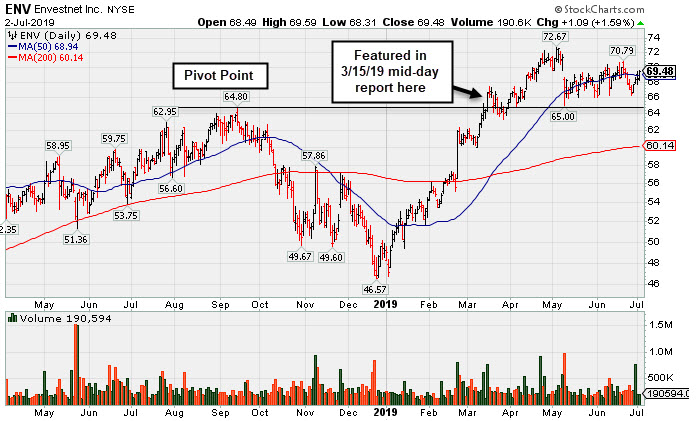
Envestnet Inc (ENV +$1.09 or +1.59% to $69.48) rebounded above its 50-day moving average (DMA) line ($68.94) with today's 4th consecutive gain. Prior lows in the $65-66 area define the next important near-term support to watch.
Recently it reported earnings +5% on +1% sales revenues for the Mar '19 quarter, below the +25% minimum earnings guideline (C criteria). That report broke a streak to 8 consecutive quarterly comparisons above the +25% minimum earnings guideline (C criteria). Annual earnings growth was flat in FY '16 but it has otherwise been strong. It still has a 91 Earnings Per Share Rating.
The high-ranked Financial Services - Specialty firm was last shown in this FSU section on 6/04/19 with an annotated graph under the headline, "Rebound Above 50-Day Moving Average Improved Technical Stance". It was highlighted in yellow with pivot point cited based on its 9/14/18 high plus 10 cents in the 3/15/19 mid-day report (read here).
The number of top-rated funds owning its shares rose from 284 in Jun '17 to 387 in Mar '19, a reassuring sign concerning the I criteria. Its current Up/Down Volume Ratio of 1.4 is an unbiased indication its shares have been under accumulation over the past 50 days. It has Timeliness Rating of A and Sponsorship Rating of C. Charts courtesy of www.stockcharts.com
|
|
|
Color Codes Explained :
Y - Better candidates highlighted by our
staff of experts.
G - Previously featured
in past reports as yellow but may no longer be buyable under the
guidelines.
***Last / Change / Volume data in this table is the closing quote data***
Symbol/Exchange
Company Name
Industry Group |
PRICE |
CHANGE
(%Change) |
Day High |
Volume
(% DAV)
(% 50 day avg vol) |
52 Wk Hi
% From Hi |
Featured
Date |
Price
Featured |
Pivot Featured |
|
Max Buy |
 SPSC
-
NASDAQ
SPSC
-
NASDAQ
S P S Commerce Inc
COMPUTER SOFTWARE and SERVICES - Application Software
|
$102.74
|
+1.33
1.31% |
$102.76
|
80,672
49.80% of 50 DAV
50 DAV is 162,000
|
$115.00
-10.66%
|
6/7/2019
|
$107.72
|
PP = $115.10
|
|
MB = $120.86
|
Most Recent Note - 7/1/2019
G - Recent lows in the $98-99 area define important near-term support to watch.Still sputtering below its 50 DMA line ($104.32). A rebound and subsequent volume-driven gains above the pivot point are needed to trigger a new (or add-on) technical buy signal. Faces some resistance due to overhead supply up to the $115 level. Fundamentals remain strong.
>>> FEATURED STOCK ARTICLE : Base Building Now Above 50-Day Moving Average Line - 6/7/2019 |
View all notes |
Set NEW NOTE alert |
Company Profile |
SEC
News |
Chart |
Request a new note
C
A
S
I |
EPAM
-
NYSE
Epam Systems Inc
COMPUTER SOFTWARE and SERVICES - Information Technology Service
|
$177.13
|
+0.42
0.24% |
$177.13
|
375,887
77.66% of 50 DAV
50 DAV is 484,000
|
$180.55
-1.89%
|
5/9/2019
|
$169.25
|
PP = $180.55
|
|
MB = $189.58
|
Most Recent Note - 7/1/2019 5:20:54 PM
Y - Gapped up today for a 4th consecutive gain but ended in the lower third of its intra-day range after challenging its 52-week high. Recently found support near its 50 DMA line ($172.59). Subsequent gains above the pivot point backed by at least +40% above average volume may trigger a new (or add-on) technical buy signal.
>>> FEATURED STOCK ARTICLE : Perched Near Pivot Point After a New Flat Base - 6/13/2019 |
View all notes |
Set NEW NOTE alert |
Company Profile |
SEC
News |
Chart |
Request a new note
C
A
S
I |
ENV
-
NYSE
Envestnet Inc
FINANCIAL SERVICES - Diversified Investments
|
$69.48
|
+1.09
1.59% |
$69.59
|
190,009
63.34% of 50 DAV
50 DAV is 300,000
|
$72.67
-4.39%
|
3/15/2019
|
$66.05
|
PP = $64.90
|
|
MB = $68.15
|
 Most Recent Note - 7/2/2019 5:33:46 PM
G - Rebounded above its 50 DMA line ($68.94) with today's 4th consecutive gain. Prior lows in the $65-66 area define the next important near-term support to watch. Recently reported earnings +5% on +1% sales revenues for the Mar '19 quarter, below the +25% minimum earnings guideline (C criteria). See the latest FSU analysis for more details and a new annotated graph.
>>> FEATURED STOCK ARTICLE : Rebounded Above 50-Day Moving Average Line - 7/2/2019 |
View all notes |
Set NEW NOTE alert |
Company Profile |
SEC
News |
Chart |
Request a new note
C
A
S
I |
LHCG
-
NASDAQ
L H C Group Inc
HEALTH SERVICES - Home Health Care
|
$120.42
|
-0.03
-0.02% |
$121.53
|
190,485
82.11% of 50 DAV
50 DAV is 232,000
|
$123.00
-2.10%
|
7/1/2019
|
$110.94
|
PP = $122.20
|
|
MB = $128.31
|
Most Recent Note - 7/1/2019 1:06:13 PM
Y - Touched a new all-time high earlier today following 4 consecutive gains marked by volume. Another new pivot point is cited based on its 5/20/19 high plus 10 cents. Subsequent gains above its pivot point backed by at least +40% above average volume may trigger a new (or add-on) technical buy signal. Its 50 DMA line ($114.57) defines near-term support above recent lows. Fundamentals remain strong.
>>> FEATURED STOCK ARTICLE : Prior Gains Lacked Volume; 50-Day Moving Average Defines Support - 6/17/2019 |
View all notes |
Set NEW NOTE alert |
Company Profile |
SEC
News |
Chart |
Request a new note
C
A
S
I |
ENSG
-
NASDAQ
Ensign Group Inc
HEALTH SERVICES - Long-Term Care Facilities
|
$57.53
|
+0.52
0.91% |
$58.14
|
225,554
73.23% of 50 DAV
50 DAV is 308,000
|
$58.88
-2.29%
|
4/30/2019
|
$51.46
|
PP = $53.30
|
|
MB = $55.97
|
Most Recent Note - 7/1/2019 5:16:54 PM
G - Touched a new high today. Its 50 DMA line ($54.24) and recent low ($52.34 on 5/31/19) define near-term support to watch. Recently reported earnings +22% on +12% sales revenues for the Mar '19 quarter, below the +25% minimum earnings guideline (C criteria), raising fundamental concerns. See the latest FSU analysis for more details and a new annotated graph.
>>> FEATURED STOCK ARTICLE : Nursing Facility Operator Touched New High - 7/1/2019 |
View all notes |
Set NEW NOTE alert |
Company Profile |
SEC
News |
Chart |
Request a new note
C
A
S
I |
Symbol/Exchange
Company Name
Industry Group |
PRICE |
CHANGE
(%Change) |
Day High |
Volume
(% DAV)
(% 50 day avg vol) |
52 Wk Hi
% From Hi |
Featured
Date |
Price
Featured |
Pivot Featured |
|
Max Buy |
CHDN
-
NASDAQ
Churchill Downs Inc
LEISURE - Gaming Activities
|
$117.14
|
+0.72
0.62% |
$117.77
|
184,223
53.09% of 50 DAV
50 DAV is 347,000
|
$117.14
0.00%
|
6/5/2019
|
$108.87
|
PP = $104.96
|
|
MB = $110.21
|
Most Recent Note - 7/1/2019 12:59:03 PM
G - Challenging its all-time high with today's 4th consecutive gain. Prior highs in the $104 area define initial support to watch above its 50 DMA line ($103). Share price was impacted by a 3:1 split when noted on 1/28/19.
>>> FEATURED STOCK ARTICLE : Consolidating Near 50-Day Moving Average - 6/29/2018 |
View all notes |
Set NEW NOTE alert |
Company Profile |
SEC
News |
Chart |
Request a new note
C
A
S
I |
WWD
-
NASDAQ
Woodward Inc
MANUFACTURING - Diversified Machinery
|
$113.86
|
-0.73
-0.64% |
$114.89
|
454,953
80.38% of 50 DAV
50 DAV is 566,000
|
$116.46
-2.23%
|
6/18/2019
|
$112.34
|
PP = $114.65
|
|
MB = $120.38
|
Most Recent Note - 6/28/2019 5:57:36 PM
Y - Churned heavy volume today without making price progress, yet it remains perched near its all-time high. Subsequent gains above the pivot point backed by at least +40% above average volume may clinch a convincing technical buy signal. Fundamentals remain strong.
>>> FEATURED STOCK ARTICLE : High Ranked Industrial Firm Perched Near All-Time High - 6/18/2019 |
View all notes |
Set NEW NOTE alert |
Company Profile |
SEC
News |
Chart |
Request a new note
C
A
S
I |
LULU
-
NASDAQ
Lululemon Athletica
MANUFACTURING - Textile Manufacturing
|
$180.86
|
+0.91
0.51% |
$182.70
|
1,842,855
85.32% of 50 DAV
50 DAV is 2,160,000
|
$190.52
-5.07%
|
6/13/2019
|
$174.48
|
PP = $179.60
|
|
MB = $188.58
|
Most Recent Note - 7/1/2019
Y - Consolidating near the prior high ($179.50 on 4/24/19) and above its 50 DMA line ($175.11) which defines important support above the prior low ($160.88 on 5/29/19). Reported Apr '19 quarterly earnings +35% on +20% sales revenues versus the ear ago period.
>>> FEATURED STOCK ARTICLE : Perched Near High Following Another Strong Earnings Report - 6/14/2019 |
View all notes |
Set NEW NOTE alert |
Company Profile |
SEC
News |
Chart |
Request a new note
C
A
S
I |
ULTA
-
NASDAQ
Ulta Beauty Inc
SPECIALTY RETAIL - Specialty Retail, Other
|
$341.33
|
+0.95
0.28% |
$345.78
|
585,106
76.48% of 50 DAV
50 DAV is 765,000
|
$365.54
-6.62%
|
3/15/2019
|
$341.27
|
PP = $322.59
|
|
MB = $338.72
|
Most Recent Note - 7/1/2019 1:20:47 PM
G - Reversed today's early gain slumping back below its 50 DMA line ($343.94). Recently noted action indicative of distributional pressure after wedging higher with gains backed by lackluster volume as touched a new all-time high. Reported earnings +17% on +13% sales revenues for the Apr '19 quarter, below the +25% minimum earnings guideline (C criteria), raising fundamental concerns.
>>> FEATURED STOCK ARTICLE : Sputtering Below 50-Day Moving Average Following Sub Par Earnings - 6/6/2019 |
View all notes |
Set NEW NOTE alert |
Company Profile |
SEC
News |
Chart |
Request a new note
C
A
S
I |
ESNT
-
NYSE
Essent Group Ltd
Finance-MrtgandRel Svc
|
$47.85
|
-0.17
-0.35% |
$48.13
|
435,958
69.20% of 50 DAV
50 DAV is 630,000
|
$50.51
-5.27%
|
3/18/2019
|
$45.84
|
PP = $45.06
|
|
MB = $47.31
|
Most Recent Note - 7/1/2019 5:18:17 PM
G - Rebounded above its 50 DMA line ($47.56) with today's 4th consecutive gain. Recently reported earnings +15% on +20% sales revenues for the Mar '19 quarter, below the +25% minimum earnings guideline (C criteria), raising fundamental concerns.
>>> FEATURED STOCK ARTICLE : Still Hovering Not Far From 52-Week High - 6/5/2019 |
View all notes |
Set NEW NOTE alert |
Company Profile |
SEC
News |
Chart |
Request a new note
C
A
S
I |
Symbol/Exchange
Company Name
Industry Group |
PRICE |
CHANGE
(%Change) |
Day High |
Volume
(% DAV)
(% 50 day avg vol) |
52 Wk Hi
% From Hi |
Featured
Date |
Price
Featured |
Pivot Featured |
|
Max Buy |
NOW
-
NYSE
Servicenow Inc
Computer Sftwr-Enterprse
|
$288.31
|
+4.80
1.69% |
$289.32
|
1,936,295
109.27% of 50 DAV
50 DAV is 1,772,000
|
$292.98
-1.59%
|
4/22/2019
|
$242.64
|
PP = $251.75
|
|
MB = $264.34
|
Most Recent Note - 7/1/2019 1:09:35 PM
G - Perched near its all-time high, extended from an sound base. Its 50 DMA line ($269) defines near-term support to watch. Recently reported earnings +20% on +34% sales revenues for the Mar '19 quarter, below the +25% minimum earnings guideline (C criteria), raising fundamental concerns.
>>> FEATURED STOCK ARTICLE : Pulling Back After Wedging to New Highs - 6/26/2019 |
View all notes |
Set NEW NOTE alert |
Company Profile |
SEC
News |
Chart |
Request a new note
C
A
S
I |
VEEV
-
NYSE
Veeva Systems Inc Cl A
Computer Sftwr-Medical
|
$166.60
|
+3.13
1.91% |
$166.73
|
1,717,281
113.65% of 50 DAV
50 DAV is 1,511,000
|
$173.65
-4.06%
|
5/30/2019
|
$154.32
|
PP = $145.80
|
|
MB = $153.09
|
Most Recent Note - 7/2/2019 5:36:24 PM
G -Posted a 4th consecutive gain today. It remains very extended from any sound base. Its 50 DMA line ($150.78) defines near-term support. Reported earnings +52% on +25% sales revenues for the Apr '19 quarter, marking its 5th strong quarter with earnings above the +25% minimum guideline (C criteria).
>>> FEATURED STOCK ARTICLE : Halted Slide After 4 Volume-Driven Losses From High - 6/27/2019 |
View all notes |
Set NEW NOTE alert |
Company Profile |
SEC
News |
Chart |
Request a new note
C
A
S
I |
PAYC
-
NYSE
Paycom Software Inc
COMPUTER SOFTWARE and SERVICES - Application Software
|
$232.92
|
+5.92
2.61% |
$233.07
|
648,001
81.61% of 50 DAV
50 DAV is 794,000
|
$233.43
-0.22%
|
2/6/2019
|
$171.66
|
PP = $164.18
|
|
MB = $172.39
|
Most Recent Note - 7/2/2019 5:42:28 PM
G - Posted a 4th consecutive gain today and ended near its all-time high. Its 50 DMA line ($211) defines near-term support to watch above the recent low ($194.84 on 6/03/19). Reported earnings +25% on +30% sales revenues for the Mar '19 quarter.
>>> FEATURED STOCK ARTICLE : Perched Near High Extended From Any Sound Base - 6/28/2019 |
View all notes |
Set NEW NOTE alert |
Company Profile |
SEC
News |
Chart |
Request a new note
C
A
S
I |
PYPL
-
NASDAQ
Paypal Holdings Inc
Finance-CrdtCard/PmtPr
|
$116.17
|
+1.14
0.99% |
$116.20
|
4,128,191
71.04% of 50 DAV
50 DAV is 5,811,000
|
$119.95
-3.15%
|
1/24/2019
|
$92.56
|
PP = $93.80
|
|
MB = $98.49
|
Most Recent Note - 7/2/2019 5:35:06 PM
G - Posted a 3rd consecutive gain and it remains perched near its all-time high. Did not form a sound base, yet promptly rebounded after violating its 50 DMA line and prior low ($106.52) on 6/03/19. Recently reported earnings +37% on +12% sales revenues for the Mar '19 quarter, continuing its strong earnings track record.
>>> FEATURED STOCK ARTICLE : Popular Payments Firm Extended From Any Sound Base - 6/19/2019 |
View all notes |
Set NEW NOTE alert |
Company Profile |
SEC
News |
Chart |
Request a new note
C
A
S
I |
PLNT
-
NYSE
Planet Fitness Inc Cl A
Leisure-Services
|
$76.05
|
+0.75
1.00% |
$76.56
|
1,890,146
110.28% of 50 DAV
50 DAV is 1,714,000
|
$81.90
-7.14%
|
11/7/2018
|
$57.10
|
PP = $55.45
|
|
MB = $58.22
|
Most Recent Note - 7/1/2019 1:12:39 PM
G - Its 50 DMA line may act as resistance while a rebound above the 50 DMA line ($76.41) is needed for its outlook to improve. Fundamentals remain strong.
>>> FEATURED STOCK ARTICLE : Undercut 50-Day Moving Average With Volume Behind Losses - 6/21/2019 |
View all notes |
Set NEW NOTE alert |
Company Profile |
SEC
News |
Chart |
Request a new note
C
A
S
I |
Symbol/Exchange
Company Name
Industry Group |
PRICE |
CHANGE
(%Change) |
Day High |
Volume
(% DAV)
(% 50 day avg vol) |
52 Wk Hi
% From Hi |
Featured
Date |
Price
Featured |
Pivot Featured |
|
Max Buy |
BLD
-
NYSE
Topbuild Corp
Bldg-Constr Prds/Misc
|
$81.19
|
+0.17
0.21% |
$81.35
|
217,949
63.36% of 50 DAV
50 DAV is 344,000
|
$86.96
-6.64%
|
5/17/2019
|
$82.19
|
PP = $87.31
|
|
MB = $91.68
|
Most Recent Note - 6/28/2019 5:59:36 PM
Y - Posted a solid gain today after finding prompt support at its 50 DMA line ($78.48) this week. Ended perched within striking distance of its 52-week high. Subsequent gains above the pivot point backed by at least +40% above average volume may trigger a technical buy signal. Fundamentals remain strong.
>>> FEATURED STOCK ARTICLE : Found Support at 50-Day Moving Averge Line - 6/20/2019 |
View all notes |
Set NEW NOTE alert |
Company Profile |
SEC
News |
Chart |
Request a new note
C
A
S
I |
TEAM
-
NASDAQ
Atlassian Corp Plc Cl A
Comp Sftwr-Spec Enterprs
|
$133.75
|
+1.98
1.50% |
$133.85
|
1,023,527
64.41% of 50 DAV
50 DAV is 1,589,000
|
$137.78
-2.92%
|
5/24/2019
|
$129.52
|
PP = $132.09
|
|
MB = $138.69
|
Most Recent Note - 7/1/2019 1:17:55 PM
Y - Volume totals in recent weeks have been mostly below average while remaining perched near its all-time high. The 50 DMA line ($123) and prior low ($115.87 on 6/03/19) define important near-term support to watch. Reported earnings +133% on +38% sales revenues for the Mar '19 quarter, continuing its strong earnings track record.
>>> FEATURED STOCK ARTICLE : Perched at High After Wedging into New High Territory - 6/24/2019 |
View all notes |
Set NEW NOTE alert |
Company Profile |
SEC
News |
Chart |
Request a new note
C
A
S
I |
UPLD
-
NASDAQ
Upland Software Inc
Computer Sftwr-Enterprse
|
$46.04
|
-0.68
-1.46% |
$46.91
|
233,150
38.47% of 50 DAV
50 DAV is 606,000
|
$54.87
-16.09%
|
6/10/2019
|
$53.30
|
PP = $50.74
|
|
MB = $53.28
|
Most Recent Note - 7/1/2019 1:23:02 PM
G - Halted its slide last week, however, a rebound above the 50 DMA line ($47.04) is needed for its outlook to improve. That important short-term average may act as resistance. Completed a new Public Offering on 5/08/19. Quarterly comparisons through Mar '19 have shown impressive sales revenues growth and greatly improved earnings increases above the +25% minimum guideline (C criteria).
>>> FEATURED STOCK ARTICLE : Rose From an Advanced Ascending Base - 6/10/2019 |
View all notes |
Set NEW NOTE alert |
Company Profile |
SEC
News |
Chart |
Request a new note
C
A
S
I |
GLOB
-
NYSE
Globant SA
Computer-Tech Services
|
$103.39
|
+0.67
0.65% |
$103.95
|
256,388
60.47% of 50 DAV
50 DAV is 424,000
|
$105.33
-1.84%
|
2/15/2019
|
$69.35
|
PP = $70.00
|
|
MB = $73.50
|
Most Recent Note - 7/1/2019 1:00:08 PM
G - Perched near its all-time high, very extended from any sound base. Its 50 DMA line ($90.41) defines important support where a violation would raise concerns and trigger a technical sell signal. Fundamentals remain strong.
>>> FEATURED STOCK ARTICLE : Posted Big Gain for Another New High Close - 6/12/2019 |
View all notes |
Set NEW NOTE alert |
Company Profile |
SEC
News |
Chart |
Request a new note
C
A
S
I |
PAGS
-
NYSE
Pagseguro Digital Cl A
Finance-CrdtCard/PmtPr
|
$39.52
|
+0.99
2.57% |
$39.68
|
1,309,401
60.90% of 50 DAV
50 DAV is 2,150,000
|
$40.36
-2.08%
|
6/25/2019
|
$37.69
|
PP = $40.07
|
|
MB = $42.07
|
Most Recent Note - 7/2/2019 5:40:55 PM
Y - Posted a gain today with below average volume and ended near the session high for a best-ever close. It was highlighted in yellow with pivot point cited based on its 3/29/18 high plus 10 cents in the 6/25/19 mid-day report. Faces no resistance due to overhead. Subsequent volume-driven gains for new highs may trigger a technical buy signal. Quarterly comparisons through Mar '19 showed earnings increases above the +25% minimum guideline (C criteria), however, sequential comparisons have shown deceleration in its sales revenues and earnings growth rate. Limited history for this Brazil-based firm is also a concern. Completed its $21.50 IPO on 1/24/18.
>>> FEATURED STOCK ARTICLE : Brazilian Payment Tech Firm Perched Near High - 6/25/2019 |
View all notes |
Set NEW NOTE alert |
Company Profile |
SEC
News |
Chart |
Request a new note
C
A
S
I |
Symbol/Exchange
Company Name
Industry Group |
PRICE |
CHANGE
(%Change) |
Day High |
Volume
(% DAV)
(% 50 day avg vol) |
52 Wk Hi
% From Hi |
Featured
Date |
Price
Featured |
Pivot Featured |
|
Max Buy |
|
|
|
THESE ARE NOT BUY RECOMMENDATIONS!
Comments contained in the body of this report are technical
opinions only. The material herein has been obtained
from sources believed to be reliable and accurate, however,
its accuracy and completeness cannot be guaranteed.
This site is not an investment advisor, hence it does
not endorse or recommend any securities or other investments.
Any recommendation contained in this report may not
be suitable for all investors and it is not to be deemed
an offer or solicitation on our part with respect to
the purchase or sale of any securities. All trademarks,
service marks and trade names appearing in this report
are the property of their respective owners, and are
likewise used for identification purposes only.
This report is a service available
only to active Paid Premium Members.
You may opt-out of receiving report notifications
at any time. Questions or comments may be submitted
by writing to Premium Membership Services 665 S.E. 10 Street, Suite 201 Deerfield Beach, FL 33441-5634 or by calling 1-800-965-8307
or 954-785-1121.
|
|
|

