***Last / Change / Volume data in this table is the closing quote data***
Symbol/Exchange
Company Name
Industry Group |
PRICE |
CHANGE
(%Change) |
Day High |
Volume
(% DAV)
(% 50 day avg vol) |
52 Wk Hi
% From Hi |
Featured
Date |
Price
Featured |
Pivot Featured |
|
Max Buy |
 SPSC
-
NASDAQ
SPSC
-
NASDAQ
S P S Commerce Inc
COMPUTER SOFTWARE and SERVICES - Application Software
|
$99.65
|
-2.81
-2.74% |
$104.18
|
136,349
88.54% of 50 DAV
50 DAV is 154,000
|
$115.00
-13.35%
|
6/7/2019
|
$107.72
|
PP = $115.10
|
|
MB = $120.86
|
Most Recent Note - 6/24/2019 5:34:41 PM
G - Color code is changed to green after it slumped below its 50 DMA line ($104.44) with today's big loss on light volume. A rebound and subsequent volume-driven gains above the pivot point are needed to trigger a new (or add-on) technical buy signal. Faces some resistance due to overhead supply up to the $115 level. Recent lows in the $98-99 area define important near-term support to watch. Fundamentals remain strong.
>>> FEATURED STOCK ARTICLE : Base Building Now Above 50-Day Moving Average Line - 6/7/2019 |
View all notes |
Set NEW NOTE alert |
Company Profile |
SEC
News |
Chart |
Request a new note
C
A
S
I |
EPAM
-
NYSE
Epam Systems Inc
COMPUTER SOFTWARE and SERVICES - Information Technology Service
|
$170.99
|
+0.50
0.29% |
$174.48
|
260,925
53.69% of 50 DAV
50 DAV is 486,000
|
$180.55
-5.29%
|
5/9/2019
|
$169.25
|
PP = $180.55
|
|
MB = $189.58
|
 Most Recent Note - 6/26/2019 5:45:49 PM
Y - Volume has been cooling while still perched within close striking distance of its 52-week high. Consolidating quietly near its 50 DMA line ($172). Subsequent gains above the pivot point backed by at least +40% above average volume may trigger a new (or add-on) technical buy signal.
>>> FEATURED STOCK ARTICLE : Perched Near Pivot Point After a New Flat Base - 6/13/2019 |
View all notes |
Set NEW NOTE alert |
Company Profile |
SEC
News |
Chart |
Request a new note
C
A
S
I |
ENV
-
NYSE
Envestnet Inc
FINANCIAL SERVICES - Diversified Investments
|
$66.58
|
-0.57
-0.85% |
$67.64
|
249,471
86.62% of 50 DAV
50 DAV is 288,000
|
$72.67
-8.38%
|
3/15/2019
|
$66.05
|
PP = $64.90
|
|
MB = $68.15
|
Most Recent Note - 6/25/2019 1:54:33 PM
G - Sputtering below its 50 DMA line ($69.10). Prior lows in the $65-66 area define the next important near-term support to watch. Recently reported earnings +5% on +1% sales revenues for the Mar '19 quarter, below the +25% minimum earnings guideline (C criteria).
>>> FEATURED STOCK ARTICLE : Rebound Above 50-Day Moving Average Improved Technical Stance - 6/4/2019 |
View all notes |
Set NEW NOTE alert |
Company Profile |
SEC
News |
Chart |
Request a new note
C
A
S
I |
LHCG
-
NASDAQ
L H C Group Inc
HEALTH SERVICES - Home Health Care
|
$116.42
|
+0.34
0.29% |
$119.74
|
293,157
120.15% of 50 DAV
50 DAV is 244,000
|
$122.20
-4.73%
|
4/29/2019
|
$110.94
|
PP = $115.64
|
|
MB = $121.42
|
Most Recent Note - 6/24/2019 2:55:28 PM
Y - Sputtering near its pivot point, meanwhile its 50 DMA line ($113) defines near-term support above recent lows. Fundamentals remain strong.
>>> FEATURED STOCK ARTICLE : Prior Gains Lacked Volume; 50-Day Moving Average Defines Support - 6/17/2019 |
View all notes |
Set NEW NOTE alert |
Company Profile |
SEC
News |
Chart |
Request a new note
C
A
S
I |
ENSG
-
NASDAQ
Ensign Group Inc
HEALTH SERVICES - Long-Term Care Facilities
|
$55.28
|
-1.29
-2.28% |
$57.27
|
255,145
85.05% of 50 DAV
50 DAV is 300,000
|
$58.35
-5.26%
|
4/30/2019
|
$51.46
|
PP = $53.30
|
|
MB = $55.97
|
Most Recent Note - 6/25/2019 1:52:42 PM
G - Color code is changed to green while hovering near its all-time high, extended from the previously noted "double bottom" base. Its 50 DMA line ($53.65) and recent low ($52.34 on 5/31/19) define near-term support to watch. Recently reported earnings +22% on +12% sales revenues for the Mar '19 quarter, below the +25% minimum earnings guideline (C criteria), raising fundamental concerns.
>>> FEATURED STOCK ARTICLE : Resilient After Latest Quarterly Report Missed Minimum Guideline - 6/3/2019 |
View all notes |
Set NEW NOTE alert |
Company Profile |
SEC
News |
Chart |
Request a new note
C
A
S
I |
Symbol/Exchange
Company Name
Industry Group |
PRICE |
CHANGE
(%Change) |
Day High |
Volume
(% DAV)
(% 50 day avg vol) |
52 Wk Hi
% From Hi |
Featured
Date |
Price
Featured |
Pivot Featured |
|
Max Buy |
CHDN
-
NASDAQ
Churchill Downs Inc
LEISURE - Gaming Activities
|
$111.02
|
+1.61
1.47% |
$111.67
|
259,053
77.33% of 50 DAV
50 DAV is 335,000
|
$117.14
-5.22%
|
6/5/2019
|
$108.87
|
PP = $104.96
|
|
MB = $110.21
|
Most Recent Note - 6/24/2019 2:49:59 PM
G - Retreating from its all-time high with today's 3rd consecutive loss. Prior highs in the $104 area define initial support to watch above its 50 DMA line ($101). Share price was impacted by a 3:1 split when noted on 1/28/19.
>>> FEATURED STOCK ARTICLE : Consolidating Near 50-Day Moving Average - 6/29/2018 |
View all notes |
Set NEW NOTE alert |
Company Profile |
SEC
News |
Chart |
Request a new note
C
A
S
I |
WWD
-
NASDAQ
Woodward Inc
MANUFACTURING - Diversified Machinery
|
$111.64
|
+0.45
0.40% |
$113.57
|
422,794
95.87% of 50 DAV
50 DAV is 441,000
|
$116.46
-4.14%
|
6/18/2019
|
$112.34
|
PP = $114.65
|
|
MB = $120.38
|
Most Recent Note - 6/25/2019 2:02:46 PM
Y - Still perched near its all-time high, however, recent gains lacked great volume conviction and it has encountered distributional pressure. Subsequent gains above the pivot point backed by at least +40% above average volume may clinch a convincing technical buy signal. Fundamentals remain strong.
>>> FEATURED STOCK ARTICLE : High Ranked Industrial Firm Perched Near All-Time High - 6/18/2019 |
View all notes |
Set NEW NOTE alert |
Company Profile |
SEC
News |
Chart |
Request a new note
C
A
S
I |
LULU
-
NASDAQ
Lululemon Athletica
MANUFACTURING - Textile Manufacturing
|
$177.31
|
+0.05
0.03% |
$180.74
|
1,937,326
89.73% of 50 DAV
50 DAV is 2,159,000
|
$190.52
-6.93%
|
6/13/2019
|
$174.48
|
PP = $179.60
|
|
MB = $188.58
|
Most Recent Note - 6/24/2019 5:32:46 PM
Y - Consolidating above the prior high ($179.50 on 4/24/19) which defines initial support to watch. The 50 DMA line ($174) and prior low ($160.88 on 5/29/19) define the next important support. Reported Apr '19 quarterly earnings +35% on +20% sales revenues versus the ear ago period.
>>> FEATURED STOCK ARTICLE : Perched Near High Following Another Strong Earnings Report - 6/14/2019 |
View all notes |
Set NEW NOTE alert |
Company Profile |
SEC
News |
Chart |
Request a new note
C
A
S
I |
ULTA
-
NASDAQ
Ulta Beauty Inc
SPECIALTY RETAIL - Specialty Retail, Other
|
$344.82
|
-3.87
-1.11% |
$352.65
|
557,752
73.49% of 50 DAV
50 DAV is 759,000
|
$365.54
-5.67%
|
3/15/2019
|
$341.27
|
PP = $322.59
|
|
MB = $338.72
|
Most Recent Note - 6/24/2019
G - Testing its 50 DMA line ($344) while today's big loss on higher volume is indicative of distributional pressure after wedging higher with gains backed by lackluster volume as it challenged it all-time high. Reported earnings +17% on +13% sales revenues for the Apr '19 quarter, below the +25% minimum earnings guideline (C criteria), raising fundamental concerns.
>>> FEATURED STOCK ARTICLE : Sputtering Below 50-Day Moving Average Following Sub Par Earnings - 6/6/2019 |
View all notes |
Set NEW NOTE alert |
Company Profile |
SEC
News |
Chart |
Request a new note
C
A
S
I |
ESNT
-
NYSE
Essent Group Ltd
Finance-MrtgandRel Svc
|
$46.15
|
+0.74
1.63% |
$46.24
|
660,695
104.38% of 50 DAV
50 DAV is 633,000
|
$50.51
-8.63%
|
3/18/2019
|
$45.84
|
PP = $45.06
|
|
MB = $47.31
|
Most Recent Note - 6/25/2019 12:27:08 PM
G - Raised concerns as it violated its 50 DMA line ($47.46) during a streak of 4 consecutive losses. Recently reported earnings +15% on +20% sales revenues for the Mar '19 quarter, below the +25% minimum earnings guideline (C criteria), raising fundamental concerns.
>>> FEATURED STOCK ARTICLE : Still Hovering Not Far From 52-Week High - 6/5/2019 |
View all notes |
Set NEW NOTE alert |
Company Profile |
SEC
News |
Chart |
Request a new note
C
A
S
I |
Symbol/Exchange
Company Name
Industry Group |
PRICE |
CHANGE
(%Change) |
Day High |
Volume
(% DAV)
(% 50 day avg vol) |
52 Wk Hi
% From Hi |
Featured
Date |
Price
Featured |
Pivot Featured |
|
Max Buy |
NOW
-
NYSE
Servicenow Inc
Computer Sftwr-Enterprse
|
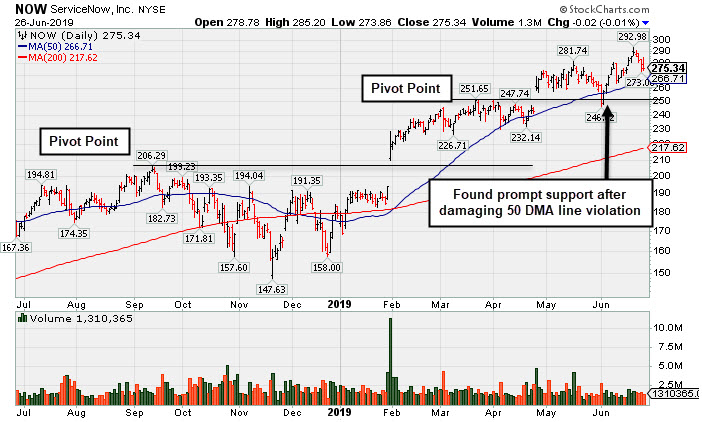
$275.34
|
-0.02
-0.01% |
$285.20
|
1,310,365
74.37% of 50 DAV
50 DAV is 1,762,000
|
$292.98
-6.02%
|
4/22/2019
|
$242.64
|
PP = $251.75
|
|
MB = $264.34
|
Most Recent Note - 6/26/2019 5:34:34 PM
G - Pulled back from its all-time high with 4 consecutive losses. Its 50 DMA line ($266) defines near-term support to watch. Recently reported earnings +20% on +34% sales revenues for the Mar '19 quarter, below the +25% minimum earnings guideline (C criteria), raising fundamental concerns. See the latest FSU analysis for more details and a new annotated graph.
>>> FEATURED STOCK ARTICLE : Pulling Back After Wedging to New Highs - 6/26/2019 |
View all notes |
Set NEW NOTE alert |
Company Profile |
SEC
News |
Chart |
Request a new note
C
A
S
I |
QLYS
-
NASDAQ
Qualys Inc
Computer Sftwr-Security
|
$83.14
|
-2.74
-3.19% |
$87.59
|
369,399
110.07% of 50 DAV
50 DAV is 335,600
|
$98.30
-15.42%
|
5/23/2019
|
$90.43
|
PP = $98.40
|
|
MB = $103.32
|
Most Recent Note - 6/26/2019 5:40:31 PM
Slumped below its 50 DMA line ($87.17) toward its 200 DMA line ($82.23) and prior low ($81.01 on 6/03/19). It will be dropped from the Featured Stocks list tonight. Ended the session -15.4% off its 52-week high. Its Relative Strength Rating of 60 is below the 80+ minimum guideline for buy candidates. Met stubborn resistance in the $97-98 area.
>>> FEATURED STOCK ARTICLE : Encountering Distributional Pressure in Recent Weeks - 6/11/2019 |
View all notes |
Set NEW NOTE alert |
Company Profile |
SEC
News |
Chart |
Request a new note
C
A
S
I |
VEEV
-
NYSE
Veeva Systems Inc Cl A
Computer Sftwr-Medical
|
$155.52
|
-1.64
-1.04% |
$161.00
|
2,371,740
163.01% of 50 DAV
50 DAV is 1,455,000
|
$173.65
-10.44%
|
5/30/2019
|
$154.32
|
PP = $145.80
|
|
MB = $153.09
|
Most Recent Note - 6/26/2019 12:50:54 PM
G -Abruptly retreated with 3 consecutive volume-driven losses and it remains very extended from any sound base. Its 50 DMA line ($148) defines near-term support. Reported earnings +52% on +25% sales revenues for the Apr '19 quarter, marking its 5th strong quarter with earnings above the +25% minimum guideline (C criteria).
>>> FEATURED STOCK ARTICLE : Big Volume-Driven Gain for New High Following Earnings News - 5/30/2019 |
View all notes |
Set NEW NOTE alert |
Company Profile |
SEC
News |
Chart |
Request a new note
C
A
S
I |
PAYC
-
NYSE
Paycom Software Inc
COMPUTER SOFTWARE and SERVICES - Application Software
|
$216.82
|
-1.53
-0.70% |
$222.18
|
659,847
84.06% of 50 DAV
50 DAV is 785,000
|
$233.43
-7.12%
|
2/6/2019
|
$171.66
|
PP = $164.18
|
|
MB = $172.39
|
Most Recent Note - 6/24/2019 3:00:44 PM
G - Extended from any sound base, it encountered distributional pressure on the prior session after quietly hitting a new all-time high. Its 50 DMA line ($207) defines near-term support to watch above the recent low ($194.84 on 6/03/19). Reported earnings +25% on +30% sales revenues for the Mar '19 quarter.
>>> FEATURED STOCK ARTICLE : Posted Volume-Driven Gain While Hovering Near All-Time High - 5/31/2019 |
View all notes |
Set NEW NOTE alert |
Company Profile |
SEC
News |
Chart |
Request a new note
C
A
S
I |
PYPL
-
NASDAQ
Paypal Holdings Inc
Finance-CrdtCard/PmtPr
|
$114.15
|
-0.29
-0.25% |
$116.38
|
4,574,840
78.28% of 50 DAV
50 DAV is 5,844,000
|
$119.95
-4.84%
|
1/24/2019
|
$92.56
|
PP = $93.80
|
|
MB = $98.49
|
Most Recent Note - 6/26/2019 5:48:28 PM
G - Gapped down on 6/21/19 for a volume-driven loss retreating from its all-time high after quiet gains. Did not form a sound base, yet promptly rebounded after violating its 50 DMA line and prior low ($106.52) on 6/03/19. Recently reported earnings +37% on +12% sales revenues for the Mar '19 quarter, continuing its strong earnings track record.
>>> FEATURED STOCK ARTICLE : Popular Payments Firm Extended From Any Sound Base - 6/19/2019 |
View all notes |
Set NEW NOTE alert |
Company Profile |
SEC
News |
Chart |
Request a new note
C
A
S
I |
Symbol/Exchange
Company Name
Industry Group |
PRICE |
CHANGE
(%Change) |
Day High |
Volume
(% DAV)
(% 50 day avg vol) |
52 Wk Hi
% From Hi |
Featured
Date |
Price
Featured |
Pivot Featured |
|
Max Buy |
PLNT
-
NYSE
Planet Fitness Inc Cl A
Leisure-Services
|
$71.65
|
+0.35
0.49% |
$71.98
|
2,054,465
140.05% of 50 DAV
50 DAV is 1,467,000
|
$81.90
-12.52%
|
11/7/2018
|
$57.10
|
PP = $55.45
|
|
MB = $58.22
|
Most Recent Note - 6/25/2019 1:08:07 PM
G - Today's 4th consecutive volume-driven loss is adding to a streak of damaging losses that violated its 50 DMA line ($76.43) triggering a technical sell signal. Fundamentals remain strong. A rebound above the 50 DMA line is needed for its outlook to improve.
>>> FEATURED STOCK ARTICLE : Undercut 50-Day Moving Average With Volume Behind Losses - 6/21/2019 |
View all notes |
Set NEW NOTE alert |
Company Profile |
SEC
News |
Chart |
Request a new note
C
A
S
I |
BLD
-
NYSE
Topbuild Corp
Bldg-Constr Prds/Misc
|
$77.66
|
-0.45
-0.58% |
$78.39
|
230,395
66.98% of 50 DAV
50 DAV is 344,000
|
$86.96
-10.69%
|
5/17/2019
|
$82.19
|
PP = $87.31
|
|
MB = $91.68
|
Most Recent Note - 6/24/2019 2:47:52 PM
Y - Finding support at its 50 DMA line ($77.89) after recent distributional pressure. Remains within striking distance of its 52-week high. Subsequent gains above the pivot point backed by at least +40% above average volume may trigger a technical buy signal. Fundamentals remain strong.
>>> FEATURED STOCK ARTICLE : Found Support at 50-Day Moving Averge Line - 6/20/2019 |
View all notes |
Set NEW NOTE alert |
Company Profile |
SEC
News |
Chart |
Request a new note
C
A
S
I |
TEAM
-
NASDAQ
Atlassian Corp Plc Cl A
Comp Sftwr-Spec Enterprs
|
$128.35
|
+2.61
2.08% |
$128.98
|
1,407,516
78.99% of 50 DAV
50 DAV is 1,782,000
|
$137.78
-6.84%
|
5/24/2019
|
$129.52
|
PP = $132.09
|
|
MB = $138.69
|
Most Recent Note - 6/24/2019 5:31:03 PM
Y - Pulled back for a second session with below average volume. The 50 DMA line ($121) and prior low ($115.87 on 6/03/19) define important near-term support to watch. Reported earnings +133% on +38% sales revenues for the Mar '19 quarter, continuing its strong earnings track record. See the latest FSU analysis for more details and a new annotated graph.
>>> FEATURED STOCK ARTICLE : Perched at High After Wedging into New High Territory - 6/24/2019 |
View all notes |
Set NEW NOTE alert |
Company Profile |
SEC
News |
Chart |
Request a new note
C
A
S
I |
UPLD
-
NASDAQ
Upland Software Inc
Computer Sftwr-Enterprse
|
$44.37
|
+0.19
0.43% |
$45.43
|
675,157
120.35% of 50 DAV
50 DAV is 561,000
|
$54.87
-19.14%
|
6/10/2019
|
$53.30
|
PP = $50.74
|
|
MB = $53.28
|
Most Recent Note - 6/25/2019 2:16:07 PM
G - Color code is changed to green after violating its 50 DMA line ($46.72) with today's 4th consecutive loss raising concerns and triggering a technical sell signal. Recent losses completely negated the prior breakout from an advanced ascending base. Completed a new Public Offering on 5/08/19. Quarterly comparisons through Mar '19 have shown impressive sales revenues growth and greatly improved earnings increases above the +25% minimum guideline (C criteria).
>>> FEATURED STOCK ARTICLE : Rose From an Advanced Ascending Base - 6/10/2019 |
View all notes |
Set NEW NOTE alert |
Company Profile |
SEC
News |
Chart |
Request a new note
C
A
S
I |
GLOB
-
NYSE
Globant SA
Computer-Tech Services
|
$98.29
|
-2.71
-2.68% |
$102.52
|
434,257
106.18% of 50 DAV
50 DAV is 409,000
|
$105.33
-6.68%
|
2/15/2019
|
$69.35
|
PP = $70.00
|
|
MB = $73.50
|
Most Recent Note - 6/24/2019 2:53:36 PM
G - Pulling back today following 5 consecutive gains into new high territory. Very extended from any sound base. Its 50 DMA line ($88.38) defines important support where a violation would raise concerns and trigger a technical sell signal. Fundamentals remain strong.
>>> FEATURED STOCK ARTICLE : Posted Big Gain for Another New High Close - 6/12/2019 |
View all notes |
Set NEW NOTE alert |
Company Profile |
SEC
News |
Chart |
Request a new note
C
A
S
I |
Symbol/Exchange
Company Name
Industry Group |
PRICE |
CHANGE
(%Change) |
Day High |
Volume
(% DAV)
(% 50 day avg vol) |
52 Wk Hi
% From Hi |
Featured
Date |
Price
Featured |
Pivot Featured |
|
Max Buy |
PAGS
-
NYSE
Pagseguro Digital Cl A
Finance-CrdtCard/PmtPr
|
$37.83
|
+0.75
2.02% |
$38.08
|
1,467,432
62.79% of 50 DAV
50 DAV is 2,337,000
|
$38.25
-1.10%
|
6/25/2019
|
$37.69
|
PP = $40.07
|
|
MB = $42.07
|
Most Recent Note - 6/25/2019 5:39:44 PM
Y - Ended the session lower with higher volume after highlighted in yellow with pivot point cited based on its 3/29/18 high plus 10 cents. Faces very little resistance due to overhead supply up to the $39 level. Subsequent volume-driven gains for new highs may trigger a technical buy signal. Quarterly comparisons through Mar '19 showed earnings increases above the +25% minimum guideline (C criteria), however, sequential comparisons have shown deceleration in its sales revenues and earnings growth rate. Limited history for this Brazil-based firm is also a concern. Completed its $21.50 IPO on 1/24/18. See the latest FSU analysis for more details and a new annotated graph.
>>> FEATURED STOCK ARTICLE : Brazilian Payment Tech Firm Perched Near High - 6/25/2019 |
View all notes |
Set NEW NOTE alert |
Company Profile |
SEC
News |
Chart |
Request a new note
C
A
S
I |