You are not logged in.
This means you
CAN ONLY VIEW reports that were published prior to Tuesday, March 25, 2025.
You
MUST UPGRADE YOUR MEMBERSHIP if you want to see any current reports.
AFTER MARKET UPDATE - WEDNESDAY, MARCH 6TH, 2024
Previous After Market Report Next After Market Report >>>
|
|
|
|
DOW |
+75.86 |
38,661.05 |
+0.20% |
|
Volume |
1,035,481,376 |
+2% |
|
Volume |
5,586,912,100 |
-15% |
|
NASDAQ |
+91.95 |
16,031.54 |
+0.58% |
|
Advancers |
1,939 |
70% |
|
Advancers |
2,571 |
60% |
|
S&P 500 |
+26.11 |
5,104.76 |
+0.51% |
|
Decliners |
824 |
30% |
|
Decliners |
1,694 |
40% |
|
Russell 2000 |
+14.38 |
2,068.09 |
+0.70% |
|
52 Wk Highs |
199 |
|
|
52 Wk Highs |
223 |
|
|
S&P 600 |
+3.83 |
1,301.73 |
+0.30% |
|
52 Wk Lows |
30 |
|
|
52 Wk Lows |
119 |
|
|
 |
Major Indices Rose With Improved Leadership
Kenneth J. Gruneisen - Passed the CAN SLIM® Master's Exam
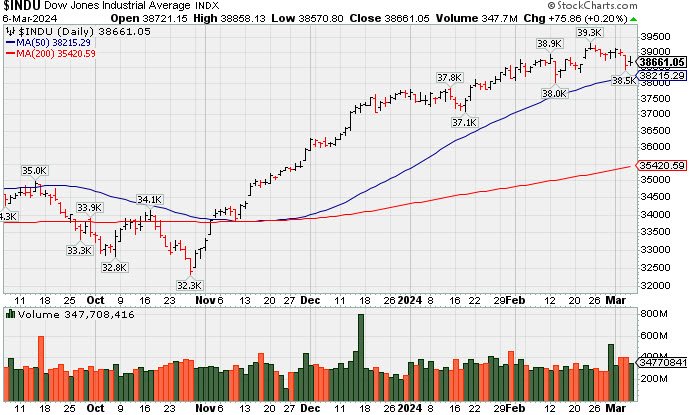
The major indices faded from their highs in the afternoon trade, but still closed with gains ranging from +0.2% to +0.7%. Volume reported was mixed, slightly higher than the prior session total on the NYSE and lower on the Nasdaq exchange. Advancers led decliners by more than a 2-1 margin on the NYSE and by a 3-2 margin on the Nasdaq exchange. There were 82 high-ranked companies from the Leaders List that hit new 52-week highs and were listed on the BreakOuts Page, versus the total of 66 on the prior session. New 52-week highs totals expanded and outnumbered new 52-week lows totals on the NYSE and on the Nasdaq exchange. The major indices are in a confirmed uptrend (M criteria). New buying efforts should be only made in stocks fitting all key criteria of the fact-based investment system.
PICTURED: The Dow Jones Industrial Average posted a small gain while consolidating above its 50-day moving average (DMA) line.
Impressive earnings and outlook from cybersecurity software provider CrowdStrike (CRWD +10.76%) contributed to the renewed buying in growth stocks and the tech space. Nine of the 11 S&P 500 sectors finished higher. The utilities sector (+1.0%) saw the largest gain, followed by the heavily-weighted information technology sector (+0.9%). Losses in some mega caps caused the communication services (-0.2%) and consumer discretionary (-0.4%) sectors to underperform the broader market.
New York Community Bancorp (NYCB +7.45%) rallied after announcing an over $1 billion equity investment anchored by former U.S. Treasury Secretary Steven Mnuchin's Liberty Strategic Capital, Hudson Bay and Reverence Capital. Shares initially plunged more than -40.0% on a Wall Street Journal report that the company was seeking to raise capital.
The 10-yr note yield slid three basis points to 4.10% and the 2-yr note yield settled one basis point higher.
|
 Kenneth J. Gruneisen started out as a licensed stockbroker in August 1987, a couple of months prior to the historic stock market crash that took the Dow Jones Industrial Average down -22.6% in a single day. He has published daily fact-based fundamental and technical analysis on high-ranked stocks online for two decades. Through FACTBASEDINVESTING.COM, Kenneth provides educational articles, news, market commentary, and other information regarding proven investment systems that work in good times and bad.
Comments contained in the body of this report are technical opinions only and are not necessarily those of Gruneisen Growth Corp. The material herein has been obtained from sources believed to be reliable and accurate, however, its accuracy and completeness cannot be guaranteed. Our firm, employees, and customers may effect transactions, including transactions contrary to any recommendation herein, or have positions in the securities mentioned herein or options with respect thereto. Any recommendation contained in this report may not be suitable for all investors and it is not to be deemed an offer or solicitation on our part with respect to the purchase or sale of any securities. |
|
 |
Tech, Broker/Dealer, and Commodity-Linked Groups Rose
Kenneth J. Gruneisen - Passed the CAN SLIM® Master's Exam
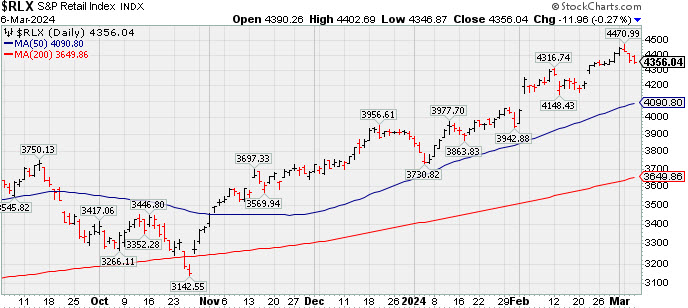
The Broker/Dealer Index ($XBD +0.47%) edged higher and the Bank Index ($BKX -0.66%) edged lower. The tech sector had a positive bias as the Semiconductor Index ($SOX +2.42%) outpaced the Networking Index ($NWX +1.00%) while the Biotech Index ($BTK +0.28%) posted a smaller gain. The Gold & Silver Index ($XAU +2.01%) posted a solid gain as the Oil Services Index ($OSX +0.69%) and the Integrated Oil Index ($XOI +0.31%) both posted smaller gains.
![]() PICTURED: The Retail Index ($RLX -0.27%) lost a little bit of ground for a 3rd consecutive session.
| Oil Services |
$OSX |
81.95 |
+0.56 |
+0.69% |
-2.30% |
| Integrated Oil |
$XOI |
1,961.51 |
+6.03 |
+0.31% |
+5.32% |
| Semiconductor |
$SOX |
4,997.93 |
+118.10 |
+2.42% |
+19.70% |
| Networking |
$NWX |
816.54 |
+8.11 |
+1.00% |
-1.95% |
| Broker/Dealer |
$XBD |
586.14 |
+2.77 |
+0.47% |
+5.18% |
| Retail |
$RLX |
4,356.04 |
-11.96 |
-0.27% |
+12.02% |
| Gold & Silver |
$XAU |
115.28 |
+2.27 |
+2.01% |
-8.29% |
| Bank |
$BKX |
98.82 |
-0.66 |
-0.66% |
+2.92% |
| Biotech |
$BTK |
5,259.37 |
+14.60 |
+0.28% |
-2.94% |
|
|
|
 |
Featured Stocks
Kenneth J. Gruneisen - Passed the CAN SLIM® Master's Exam
|
|
|
Color Codes Explained :
Y - Better candidates highlighted by our
staff of experts.
G - Previously featured
in past reports as yellow but may no longer be buyable under the
guidelines.
***Last / Change / Volume data in this table is the closing quote data***
Symbol/Exchange
Company Name
Industry Group |
PRICE |
CHANGE
(%Change) |
Day High |
Volume
(% DAV)
(% 50 day avg vol) |
52 Wk Hi
% From Hi |
Featured
Date |
Price
Featured |
Pivot Featured |
|
Max Buy |
 ANET
-
NYSE
ANET
-
NYSE
Arista Networks
Computer-Networking
|
$284.50
|
+4.03
1.44% |
$286.78
|
1,683,087
76.82% of 50 DAV
50 DAV is 2,191,000
|
$292.66
-2.79%
|
10/31/2023
|
$188.84
|
PP = $198.80
|
|
MB = $208.74
|
Most Recent Note - 3/1/2024 4:51:52 PM
G - Posted a gain with +23% above average volume for a best-ever close, very extended from any sound base. Its 50 DMA line ($257.51) defines important near-term support to watch on pullbacks. See the latest FSU analysis for more details and a new annotated graph.
>>> FEATURED STOCK ARTICLE : Best Ever Close for Arista Networks - 3/1/2024 |
View all notes |
Set NEW NOTE alert |
Company Profile |
SEC
News |
Chart |
Request a new note
C
A
S
I |
NVO
-
NYSE
Novo Nordisk ADR
Medical-Ethical Drugs
|
$124.75
|
+0.10
0.08% |
$125.18
|
3,877,994
83.06% of 50 DAV
50 DAV is 4,669,000
|
$128.77
-3.12%
|
3/1/2024
|
$124.23
|
PP = $124.97
|
|
MB = $131.22
|
Most Recent Note - 3/4/2024 12:32:14 PM
Y - Gapped up today hitting a new all-time high. Color code was recently changed to yellow after forming an advanced "3-weeks tight" base. Its 50 DMA line ($112.59) defines important near-term support to watch on pullbacks.
>>> FEATURED STOCK ARTICLE : Extended From Any Sound Base After Volume-Driven Gains - 2/8/2024 |
View all notes |
Set NEW NOTE alert |
Company Profile |
SEC
News |
Chart |
Request a new note
C
A
S
I |
AXON
-
NASDAQ
Axon Enterprise
Security/Sfty
|
$314.97
|
-0.13
-0.04% |
$318.00
|
467,269
103.38% of 50 DAV
50 DAV is 452,000
|
$325.63
-3.27%
|
11/8/2023
|
$127.84
|
PP = $223.30
|
|
MB = $234.47
|
Most Recent Note - 3/4/2024 12:04:00 PM
G - Very extended from any sound base and hitting another new all-time high today. Bullish action came after it reported Dec '23 quarterly earnings +60% on +29% sales revenues versus the year-ago period. Volume and volatility often increase near earnings news. Prior highs in the $260-262 area define initial support to watch along with its 50-day moving average (DMA) line ($262.58).
>>> FEATURED STOCK ARTICLE : Reversal at All-Time High After 7 Consecutive Gains - 2/12/2024 |
View all notes |
Set NEW NOTE alert |
Company Profile |
SEC
News |
Chart |
Request a new note
C
A
S
I |
TDG
-
NYSE
TransDigm Group
Aerospace/Defense
|
$1,168.68
|
+8.68
0.75% |
$1,174.97
|
230,307
107.12% of 50 DAV
50 DAV is 215,000
|
$1,207.58
-3.22%
|
12/12/2023
|
$1,000.39
|
PP = $1,013.18
|
|
MB = $1,063.84
|
Most Recent Note - 3/5/2024 9:15:39 PM
G - Pulled back today with average volume for a 2nd consecutive loss. Its 50 DMA line ($1,087) defines near-term support to watch.
>>> FEATURED STOCK ARTICLE : Transdigm Perched Near All-Time High - 2/14/2024 |
View all notes |
Set NEW NOTE alert |
Company Profile |
SEC
News |
Chart |
Request a new note
C
A
S
I |
CRWD
-
NASDAQ
CrowdStrike Holdings
Computer Sftwr-Security
|
$329.70
|
+32.14
10.80% |
$365.00
|
22,998,856
657.86% of 50 DAV
50 DAV is 3,496,000
|
$338.45
-2.59%
|
1/2/2024
|
$246.42
|
PP = $261.91
|
|
MB = $275.01
|
 Most Recent Note - 3/6/2024 12:26:53 PM
G - Gapped up today and hit a new all-time high after testing its 50 DMA ($295) which recently acted as support. Fundamentals remain strong after it reported Jan '24 quarterly earnings +102% on +33% sales revenues versus the year-ago period.
>>> FEATURED STOCK ARTICLE : Volume Totals Cooking While Stubbornly Perched at All-Time High - 2/6/2024 |
View all notes |
Set NEW NOTE alert |
Company Profile |
SEC
News |
Chart |
Request a new note
C
A
S
I |
Symbol/Exchange
Company Name
Industry Group |
PRICE |
CHANGE
(%Change) |
Day High |
Volume
(% DAV)
(% 50 day avg vol) |
52 Wk Hi
% From Hi |
Featured
Date |
Price
Featured |
Pivot Featured |
|
Max Buy |
ELF
-
NYSE
e.l.f. Beauty
Cosmetics/Personal Care
|
$207.01
|
+5.39
2.67% |
$212.90
|
1,288,313
85.66% of 50 DAV
50 DAV is 1,504,000
|
$221.83
-6.68%
|
1/2/2024
|
$138.23
|
PP = $153.63
|
|
MB = $161.31
|
Most Recent Note - 3/5/2024 12:23:18 PM
G - Pulling back today for a 2nd volume-driven loss after 8 consecutive gains for new all-time highs. Reported Dec '23 quarterly earnings +54% on +85% sales revenues versus the year-ago period, continuing its strong earnings track record. Its 50 DMA line ($165.63) defines important near-term support to watch.
>>> FEATURED STOCK ARTICLE : Peched at All-Time High With Earnings News Due - 2/5/2024 |
View all notes |
Set NEW NOTE alert |
Company Profile |
SEC
News |
Chart |
Request a new note
C
A
S
I |
KOF
-
NYSE
Coca Cola Femsa Sab Ads
FOOD and BEVERAGE - Beverages - Soft Drinks
|
$96.19
|
-1.14
-1.17% |
$98.84
|
136,216
82.56% of 50 DAV
50 DAV is 165,000
|
$104.38
-7.85%
|
1/12/2024
|
$93.38
|
PP = $99.34
|
|
MB = $104.31
|
Most Recent Note - 3/6/2024 5:14:57 PM
Y - Still quietly consolidating above its 50 DMA line ($95.10) which defines important near-term support to watch. There was a noted "negative reversal" on 2/20/24 at its all-time high. Reported Dec '23 quarterly earnings -13% on +24% sales revenues versus the year-ago period, raising fundamental concerns.
>>> FEATURED STOCK ARTICLE : Perched at High With Earnings News Due - 2/21/2024 |
View all notes |
Set NEW NOTE alert |
Company Profile |
SEC
News |
Chart |
Request a new note
C
A
S
I |
PCAR
-
NASDAQ
Paccar
Trucks and Parts-Hvy Duty
|
$115.48
|
+1.40
1.23% |
$116.15
|
2,289,934
107.61% of 50 DAV
50 DAV is 2,128,000
|
$115.78
-0.26%
|
1/23/2024
|
$100.35
|
PP = $98.57
|
|
MB = $103.50
|
Most Recent Note - 3/1/2024 4:56:57 PM
G - Hit another new all-time high with today's gain backed by average volume, getting more extended from any sound base. Its 50 DMA line ($101.55) defines near-term support to watch on pullbacks. Fundamentals remain strong.
>>> FEATURED STOCK ARTICLE : Extended From Any Sound Base After 7 Weekly Gains - 2/26/2024 |
View all notes |
Set NEW NOTE alert |
Company Profile |
SEC
News |
Chart |
Request a new note
C
A
S
I |
HUBB
-
NYSE
Hubbell
Electrical-Power/Equipmt
|
$387.92
|
+7.27
1.91% |
$388.86
|
332,945
85.37% of 50 DAV
50 DAV is 390,000
|
$392.98
-1.29%
|
1/30/2024
|
$343.26
|
PP = $336.83
|
|
MB = $353.67
|
Most Recent Note - 3/5/2024 9:18:55 PM
G - Pulled back from its all-time high with today's loss after 4 consecutive gains. Very extended from the previously noted base. Prior high ($340) and its 50 DMA line define important support to watch on pullbacks.
>>> FEATURED STOCK ARTICLE : Inched to New Highs With Average Volume - 2/28/2024 |
View all notes |
Set NEW NOTE alert |
Company Profile |
SEC
News |
Chart |
Request a new note
C
A
S
I |
MANH
-
NASDAQ
Manhattan Associates
Computer Sftwr-Enterprse
|
$254.76
|
+2.43
0.96% |
$257.00
|
243,132
69.67% of 50 DAV
50 DAV is 349,000
|
$258.91
-1.60%
|
1/31/2024
|
$240.57
|
PP = $230.71
|
|
MB = $242.25
|
Most Recent Note - 3/5/2024 9:14:22 PM
G - Pulled back from its all-time high with average volume behind today's small loss. Prior highs in the $230 area define near-term support to watch on pullbacks.
>>> FEATURED STOCK ARTICLE : Hovering Near All-Time High After Streak of Small Gains - 2/29/2024 |
View all notes |
Set NEW NOTE alert |
Company Profile |
SEC
News |
Chart |
Request a new note
C
A
S
I |
Symbol/Exchange
Company Name
Industry Group |
PRICE |
CHANGE
(%Change) |
Day High |
Volume
(% DAV)
(% 50 day avg vol) |
52 Wk Hi
% From Hi |
Featured
Date |
Price
Featured |
Pivot Featured |
|
Max Buy |
USLM
-
NASDAQ
U.S. Lime & Minerals
Bldg-Cement/Concrt/Ag
|
$275.56
|
-2.11
-0.76% |
$281.23
|
15,310
85.06% of 50 DAV
50 DAV is 18,000
|
$283.45
-2.78%
|
2/9/2024
|
$254.68
|
PP = $265.09
|
|
MB = $278.34
|
Most Recent Note - 3/4/2024 5:53:22 PM
Y - Posted a solid gain today with below-average volume for a best-ever close near its all-time high. Subsequent gains and a close above the pivot point backed by at least +40% above average volume may trigger a conviciing new technical buy signal. Through Dec '23 its quarterly and annual earnings (C and A criteria) history has been strong, a good match with the fact-based investment system's guidelines. Thinly traded firm has only 5.7 million shares outstanding (S criteria), which can contribute to greater price volatility in the event of institutional buying or selling.
>>> FEATURED STOCK ARTICLE : Strong Finish for Thinly Traded U.S Lime & Minerals - 2/9/2024 |
View all notes |
Set NEW NOTE alert |
Company Profile |
SEC
News |
Chart |
Request a new note
C
A
S
I |
NOW
-
NYSE
ServiceNow
Computer Sftwr-Enterprse
|
$741.06
|
+0.91
0.12% |
$752.39
|
1,250,778
106.54% of 50 DAV
50 DAV is 1,174,000
|
$815.32
-9.11%
|
2/22/2024
|
$771.75
|
PP = $815.32
|
|
MB = $856.09
|
Most Recent Note - 3/5/2024 9:13:17 PM
G - Color code is changed to green after today's volume-driven loss violated its 50 DMA line triggering a technical sell signal. A prompt rebound above the 50 DMA line is needed for its outlook to improve.
>>> FEATURED STOCK ARTICLE : Found Support With a Solid Gap Up from 10-Week Moving Average - 2/23/2024 |
View all notes |
Set NEW NOTE alert |
Company Profile |
SEC
News |
Chart |
Request a new note
C
A
S
I |
SNPS
-
NASDAQ
Synopsys
Computer Sftwr-Design
|
$575.97
|
+10.71
1.89% |
$582.52
|
777,418
54.06% of 50 DAV
50 DAV is 1,438,000
|
$629.38
-8.49%
|
2/22/2024
|
$600.65
|
PP = $582.85
|
|
MB = $611.99
|
Most Recent Note - 3/5/2024 9:06:52 PM
Y - Suffered a big loss today with below-average volume, retreating from a best-ever close. Previously noted - "A strong volume-driven gain and close above the pivot point is needed to clinch a proper technical buy signal. Found support recently at its 50 DMA line ($538). Reported Jan '24 quarterly earnings +36% on +21% sales revenues versus the year-ago period, its 3rd strong quarter above the +25% minimum earnings guideline (C criteria). Annual earnings growth (A criteria) has been strong and steady."
>>> FEATURED STOCK ARTICLE : Gapped Up for New High But Ended Near Session Low - 2/22/2024 |
View all notes |
Set NEW NOTE alert |
Company Profile |
SEC
News |
Chart |
Request a new note
C
A
S
I |
PAY
-
NYSE
Paymentus Holdings
Finance-CrdtCard/PmtPr
|
$19.09
|
-0.56
-2.85% |
$20.24
|
930,418
525.66% of 50 DAV
50 DAV is 177,000
|
$21.02
-9.18%
|
3/5/2024
|
$19.97
|
PP = $18.89
|
|
MB = $19.83
|
Most Recent Note - 3/6/2024 12:33:50 PM
Y - Pulling back today, undercutting prior highs raising some concerns. Closed in the middle of its intra-day range with a considerable volume-driven gain on the prior session after highlighted in yellow in the mid-day report with pivot point cited based on its 12/26/23 high plus 10 cents. Reported Dec '23 quarterly earnings +175% on +25% sales revenues versus the year-ago period, its 3rd strong quarterly comparison well above the +25% minimum earnings guideline (C criteria). Annual earnings history (A criteria) has been strong since its $21 IPO in May '21. See the latest FSU analysis for more details and an annotated graph.
>>> FEATURED STOCK ARTICLE : Big Gap Up Gain Triggered Technical Buy Signal - 3/5/2024 |
View all notes |
Set NEW NOTE alert |
Company Profile |
SEC
News |
Chart |
Request a new note
C
A
S
I |
|
|
|
THESE ARE NOT BUY RECOMMENDATIONS!
Comments contained in the body of this report are technical
opinions only. The material herein has been obtained
from sources believed to be reliable and accurate, however,
its accuracy and completeness cannot be guaranteed.
This site is not an investment advisor, hence it does
not endorse or recommend any securities or other investments.
Any recommendation contained in this report may not
be suitable for all investors and it is not to be deemed
an offer or solicitation on our part with respect to
the purchase or sale of any securities. All trademarks,
service marks and trade names appearing in this report
are the property of their respective owners, and are
likewise used for identification purposes only.
This report is a service available
only to active Paid Premium Members.
You may opt-out of receiving report notifications
at any time. Questions or comments may be submitted
by writing to Premium Membership Services 665 S.E. 10 Street, Suite 201 Deerfield Beach, FL 33441-5634 or by calling 1-800-965-8307
or 954-785-1121.
|
|
|