You are not logged in.
This means you
CAN ONLY VIEW reports that were published prior to Tuesday, April 1, 2025.
You
MUST UPGRADE YOUR MEMBERSHIP if you want to see any current reports.
AFTER MARKET UPDATE - FRIDAY, JANUARY 20TH, 2023
Previous After Market Report Next After Market Report >>>
|
|
|
|
DOW |
+330.93 |
33,375.49 |
+1.00% |
|
Volume |
999,034,463 |
+17% |
|
Volume |
6,000,727,800 |
+29% |
|
NASDAQ |
+288.17 |
11,140.43 |
+2.66% |
|
Advancers |
2,393 |
79% |
|
Advancers |
3,228 |
71% |
|
S&P 500 |
+73.76 |
3,972.61 |
+1.89% |
|
Decliners |
622 |
21% |
|
Decliners |
1,323 |
29% |
|
Russell 2000 |
+30.99 |
1,867.34 |
+1.69% |
|
52 Wk Highs |
47 |
|
|
52 Wk Highs |
88 |
|
|
S&P 600 |
+18.69 |
1,223.39 |
+1.55% |
|
52 Wk Lows |
16 |
|
|
52 Wk Lows |
27 |
|
|
 |
Breadth Positive as Major Indices Rose With Better Leadership
Kenneth J. Gruneisen - Passed the CAN SLIM® Master's Exam
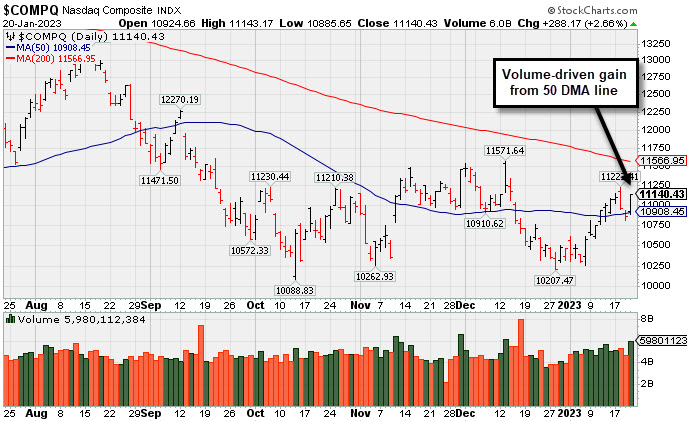
The Dow climbed 330 points, while the Nasdaq Composite advanced 2.7% amid a rally in technology shares. The S&P 500 added 1.9%, with all sectors finishing in positive territory. Despite today’s gains, the major averages ended mixed for the week. The Dow fell 2.7%, while the S&P 500 shed 0.7%. The Nasdaq Composite finished 0.6% higher. Volume totals were higher than the prior session on the NYSE and on the Nasdaq exchange, a sign that institutional buying demand was on the rise Breadth was positive as advancers led decliners by almost a 4-1 margin on the NYSE and more than 2-1 on the Nasdaq exchange. Leadership remained thin as there were only 8 high-ranked companies from the Leaders List that hit new 52-week highs and were listed on the BreakOuts Page versus the total of 3 on the prior session. New 52-week highs totals still outnumbered new 52-week lows on both the NYSE and the Nasdaq exchange. The major indices are in an uptrend that has come under pressure (M criteria). Disciplined investors still have a green light for making new buys only in stocks matching all key criteria of the fact-based investment system.
PICTURED: The Nasdaq Composite Index rose from its 50-day moving average line with Friday's big gain backed by higher volume.
U.S. equities finished higher Friday as investors looked to shake off the impact of recession concerns and weak economic data. On the data front, existing home sales fell 1.5% month-over-month in December to notch its eleventh-straight month of declines and lowest rate since 2010. In the central bank space, Federal Reserve (Fed) Governor Christopher Waller noted that he supports a 25-basis point (0.25%) interest rate hike at the February meeting, but indicated the central bank has a “considerable way to go” before they can halt their monetary policy path. Philadelphia Fed President Patrick Harker reiterated his belief the Fed needs to moderate its pace of rate hikes, while Kansas City Fed President Esther George was optimistic the economy could avoid a hard landing.
Treasuries weakened, with the yield on the benchmark 10-year note up nine basis points (0.09%) to 3.48%, while the 30-year bond yield climbed nine basis points (0.09%) to 3.65%. The two-year note, which is more sensitive to changes in Fed policy, advanced six basis points (0.06%) to 4.17%. In commodities, West Texas Intermediate (WTI) crude added 1.2% to $81.31/barrel amid renewed optimism over China’s reopening. |
 Kenneth J. Gruneisen started out as a licensed stockbroker in August 1987, a couple of months prior to the historic stock market crash that took the Dow Jones Industrial Average down -22.6% in a single day. He has published daily fact-based fundamental and technical analysis on high-ranked stocks online for two decades. Through FACTBASEDINVESTING.COM, Kenneth provides educational articles, news, market commentary, and other information regarding proven investment systems that work in good times and bad.
Comments contained in the body of this report are technical opinions only and are not necessarily those of Gruneisen Growth Corp. The material herein has been obtained from sources believed to be reliable and accurate, however, its accuracy and completeness cannot be guaranteed. Our firm, employees, and customers may effect transactions, including transactions contrary to any recommendation herein, or have positions in the securities mentioned herein or options with respect thereto. Any recommendation contained in this report may not be suitable for all investors and it is not to be deemed an offer or solicitation on our part with respect to the purchase or sale of any securities. |
|
 |
Retail, Financial, Tech and Commodity-Linked Groups Rose
Kenneth J. Gruneisen - Passed the CAN SLIM® Master's Exam
The Retail Index ($RLX +2.44%), Bank Index ($BKX +3.12%), and Broker/Dealer Index ($XBD +1.43%) each posted gains that had a positive influence on the major averages. The Semiconductor Index ($SOX +3.11%) led the tech sector higher while the Networking Index ($NWX +1.30%) and Biotech Index ($BTK +1.53%) also rose. Commodity-linked groups had a positive bias as the Gold & Silver Index ($XAU +1.56%), Oil Services Index ($OSX +1.47%), and Integrated Oil Index ($XOI +1.39%) all posted gains.
PICTURED: The Integrated Oil Index ($XOI +1.39%) is consolidating above its 50-day moving average (DMA) line and rising near the prior high.
| Oil Services |
$OSX |
91.06 |
+1.32 |
+1.47% |
+8.59% |
| Integrated Oil |
$XOI |
1,877.80 |
+25.72 |
+1.39% |
+5.07% |
| Semiconductor |
$SOX |
2,794.69 |
+84.26 |
+3.11% |
+10.37% |
| Networking |
$NWX |
806.79 |
+10.34 |
+1.30% |
+3.00% |
| Broker/Dealer |
$XBD |
477.03 |
+6.74 |
+1.43% |
+6.21% |
| Retail |
$RLX |
2,949.46 |
+70.35 |
+2.44% |
+7.10% |
| Gold & Silver |
$XAU |
135.67 |
+2.08 |
+1.56% |
+12.25% |
| Bank |
$BKX |
107.07 |
+3.24 |
+3.12% |
+6.17% |
| Biotech |
$BTK |
5,528.41 |
+83.22 |
+1.53% |
+4.68% |
|
|
|
 |
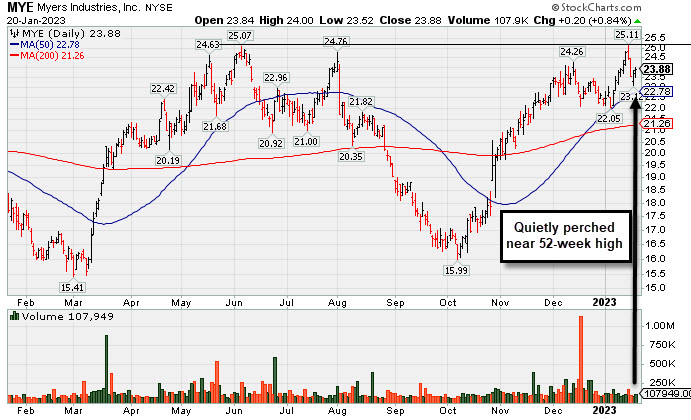
Myers Quietly Consolidating Within Striking Distance of Prior High
Kenneth J. Gruneisen - Passed the CAN SLIM® Master's Exam
Myers Industries Inc (MYE +$0.20 or +0.84% to $23.88\) posted a small gain today with below average volume after it managed a "positive reversal" on the prior session . Its 50-day moving average (DMA) line ($22.82) defines near-term support to watch on pullbacks. It faces little resistance due to overhead supply up to the $25.50 level.
MYE was highlighted in yellow in the 12/08/22 mid-day report (read here). It was last covered in greater detail in the FSU section on 1/05/23 with an annotated graph under the headline, "Pullback Testing 50-Day Moving Average Line". It has a 96 Earnings Per Share Rating. The Sep '22 quarter showed +78% earnings on +14% sales revenues versus the year ago period. The past 4 quarterly comparisons were above the +25% minimum guideline (C criteria), however, its sales revenues growth rate has shown deceleration in sequential comparisons +45%, +29%, +24%, to +14%. Annual earnings (A criteria) history had a slight downturn in FY '19 but growth has been otherwise strong and steady.
It hails from the Containers/Packaging industry group which is now ranked 47th on the 197 Industry Groups list (L criteria). There are only 36.5 million shares outstanding (S criteria) which can contribute to greater price volatility in the event of institutional buying or selling. The number of top-rated funds owning its shares was 336 in Mar '22 and was reported at 336 as of Dec '22. Its current Up/Down Volume Ratio of 1.0 is an unbiased indication its shares have been neutral concerning accumulation/distribution over the past 50 days (I criteria). |
|
|
Color Codes Explained :
Y - Better candidates highlighted by our
staff of experts.
G - Previously featured
in past reports as yellow but may no longer be buyable under the
guidelines.
***Last / Change / Volume data in this table is the closing quote data***
Symbol/Exchange
Company Name
Industry Group |
PRICE |
CHANGE
(%Change) |
Day High |
Volume
(% DAV)
(% 50 day avg vol) |
52 Wk Hi
% From Hi |
Featured
Date |
Price
Featured |
Pivot Featured |
|
Max Buy |
 CMC
-
NYSE
CMC
-
NYSE
Commercial Metals Co
METALS and MINING - Steel and Iron
|
$52.15
|
+0.20
0.38% |
$52.45
|
2,019,424
199.55% of 50 DAV
50 DAV is 1,012,000
|
$56.88
-8.32%
|
10/14/2022
|
$41.61
|
PP = $44.45
|
|
MB = $46.67
|
 Most Recent Note - 1/20/2023 10:36:51 PM
G - Churned higher volume and held its ground today after pulling back from its 52-week high. Its 50 DMA line ($49.30) defines important near-term support to watch on pullbacks. Fundamentals remain strong.
>>> FEATURED STOCK ARTICLE : Pulling Back After Rallying From 50-Day Moving Average Line - 1/18/2023 |
View all notes |
Set NEW NOTE alert |
Company Profile |
SEC
News |
Chart |
Request a new note
C
A
S
I |
GPK
-
NYSE
Graphic Packaging Hldg
CONSUMER NON-DURABLES - Packaging and Containers
|
$22.56
|
+0.41
1.85% |
$22.61
|
2,661,457
91.15% of 50 DAV
50 DAV is 2,919,900
|
$24.07
-6.27%
|
10/25/2022
|
$22.75
|
PP = $24.17
|
|
MB = $25.38
|
Most Recent Note - 1/17/2023 5:59:51 PM
Y - Consolidating near its 50 DMA line ($22.31) after recently finding support at its 200 DMA line ($21.71). More damaging losses may raise concerns. Faces some resistance due to overhead supply up to the $24 level. Fundamentals remain strong.
>>> FEATURED STOCK ARTICLE : Found Support at 200-Day Moving Average and Still Faces Resistance - 1/10/2023 |
View all notes |
Set NEW NOTE alert |
Company Profile |
SEC
News |
Chart |
Request a new note
C
A
S
I |
GFF
-
NYSE
Griffon Corporation
MATERIALS and CONSTRUCTION - General Building Materials
|
$38.00
|
-0.36
-0.94% |
$39.23
|
373,193
76.47% of 50 DAV
50 DAV is 488,000
|
$40.74
-6.73%
|
11/10/2022
|
$34.13
|
PP = $35.02
|
|
MB = $36.77
|
Most Recent Note - 1/19/2023 6:15:46 PM
G - Showed resilience today and closed near the session high following a "negative reversal" at its 52-week high on the prior session. Its 50 DMA line ($35.62) defines near-term support above recent lows in the $33.82 area. Reported Sep '22 quarterly earnings +230% on +24% sales revenues versus the year ago period.
>>> FEATURED STOCK ARTICLE : Showed Resilience Following Negative Reversal at 52-Week High - 1/19/2023 |
View all notes |
Set NEW NOTE alert |
Company Profile |
SEC
News |
Chart |
Request a new note
C
A
S
I |
CPRX
-
NASDAQ
Catalyst Pharma Inc
Medical-Biomed/Biotech
|
$20.80
|
+0.53
2.61% |
$21.01
|
1,915,762
76.78% of 50 DAV
50 DAV is 2,495,000
|
$22.11
-5.92%
|
11/22/2022
|
$17.38
|
PP = $16.66
|
|
MB = $17.49
|
Most Recent Note - 1/20/2023 10:38:29 PM
G - Hovering near its 52-week high with today's gain backed by higher but below average volume. Its 50 DMA line ($17.62) defines near-term support to watch on pullbacks.
>>> FEATURED STOCK ARTICLE : Making Gradual Progress Hitting Another New High - 1/11/2023 |
View all notes |
Set NEW NOTE alert |
Company Profile |
SEC
News |
Chart |
Request a new note
C
A
S
I |
TITN
-
NASDAQ
Titan Machinery Inc
SPECIALTY RETAIL
|
$40.60
|
+1.62
4.16% |
$40.69
|
182,893
77.17% of 50 DAV
50 DAV is 237,000
|
$44.35
-8.46%
|
1/13/2023
|
$40.10
|
PP = $44.45
|
|
MB = $46.67
|
Most Recent Note - 1/20/2023 10:34:35 PM
Y - Posted a gain today with lighter volume. The prior high in the $38 area defines important support to watch along with its 50 DMA line ($38.69)..A new pivot point was recently cited based on its 12/01/22 high plus 10 cents.
>>> FEATURED STOCK ARTICLE : Forming New Base for Past 7 Weeks - 1/13/2023 |
View all notes |
Set NEW NOTE alert |
Company Profile |
SEC
News |
Chart |
Request a new note
C
A
S
I |
Symbol/Exchange
Company Name
Industry Group |
PRICE |
CHANGE
(%Change) |
Day High |
Volume
(% DAV)
(% 50 day avg vol) |
52 Wk Hi
% From Hi |
Featured
Date |
Price
Featured |
Pivot Featured |
|
Max Buy |
MYE
-
NYSE
Myers Industries Inc
Containers/Packaging
|
$23.88
|
+0.20
0.84% |
$24.00
|
107,949
65.03% of 50 DAV
50 DAV is 166,000
|
$25.55
-6.54%
|
12/8/2022
|
$23.94
|
PP = $25.65
|
|
MB = $26.93
|
Most Recent Note - 1/20/2023 10:32:54 PM
Y - Posted a quiet gain today after a "positive reversal" on the prior session. Its 50 DMA line ($22.82) defines near-term support to watch. Faces little resistance due to overhead supply up to the $25.50 level. See the latest FSU analysis for more details and a new annotated graph.
>>> FEATURED STOCK ARTICLE : Myers Quietly Consolidating Within Striking Distance of Prior High - 1/20/2023 |
View all notes |
Set NEW NOTE alert |
Company Profile |
SEC
News |
Chart |
Request a new note
C
A
S
I |
BOX
-
NYSE
Box Inc Cl A
Computer Sftwr-Database
|
$30.99
|
+0.45
1.47% |
$31.07
|
886,124
66.43% of 50 DAV
50 DAV is 1,334,000
|
$33.04
-6.20%
|
12/12/2022
|
$29.83
|
PP = $29.57
|
|
MB = $31.05
|
Most Recent Note - 1/18/2023 5:21:10 PM
Y - There was a "negative reversal today after early gains and it closed near the session low. Its 50 DMA line ($29.37) defines important near-term support to watch. Still faces some resistance due to overhead supply up to the $32 level. Quarterly and annual earnings increases have been strong and steady.
>>> FEATURED STOCK ARTICLE : Pulled Back After Perched Near All-Time High - 1/6/2023 |
View all notes |
Set NEW NOTE alert |
Company Profile |
SEC
News |
Chart |
Request a new note
C
A
S
I |
STRL
-
NASDAQ
Sterling Infrastructure
MATERIALS and; CONSTRUCTION - Heavy Construction
|
$32.04
|
+0.59
1.88% |
$32.21
|
286,687
137.17% of 50 DAV
50 DAV is 209,000
|
$34.86
-8.09%
|
12/14/2022
|
$32.41
|
PP = $33.72
|
|
MB = $35.41
|
Most Recent Note - 1/17/2023 5:58:57 PM
Y - There was a "negative reversal" today for a loss with higher volume after early gains nearly challenging its prior high. Its 50 DMA line ($32.15) defines important support after its recent failed breakout attempt. Highlighted in yellow with pivot point cited based on its 11/08/22 high plus 10 cents in the 12/14/22 mid-day report. Confirming volume-driven gains for a new high would be a reassuring sign of fresh institutional buying demand.
>>> FEATURED STOCK ARTICLE : Finding Support Near 50-Day Moving Average After Failed Breakout Attempt - 1/9/2023 |
View all notes |
Set NEW NOTE alert |
Company Profile |
SEC
News |
Chart |
Request a new note
C
A
S
I |
|
|
|
THESE ARE NOT BUY RECOMMENDATIONS!
Comments contained in the body of this report are technical
opinions only. The material herein has been obtained
from sources believed to be reliable and accurate, however,
its accuracy and completeness cannot be guaranteed.
This site is not an investment advisor, hence it does
not endorse or recommend any securities or other investments.
Any recommendation contained in this report may not
be suitable for all investors and it is not to be deemed
an offer or solicitation on our part with respect to
the purchase or sale of any securities. All trademarks,
service marks and trade names appearing in this report
are the property of their respective owners, and are
likewise used for identification purposes only.
This report is a service available
only to active Paid Premium Members.
You may opt-out of receiving report notifications
at any time. Questions or comments may be submitted
by writing to Premium Membership Services 665 S.E. 10 Street, Suite 201 Deerfield Beach, FL 33441-5634 or by calling 1-800-965-8307
or 954-785-1121.
|
|
|